Japan Smart Drink Dispensing Systems Market Size & Growth Rate
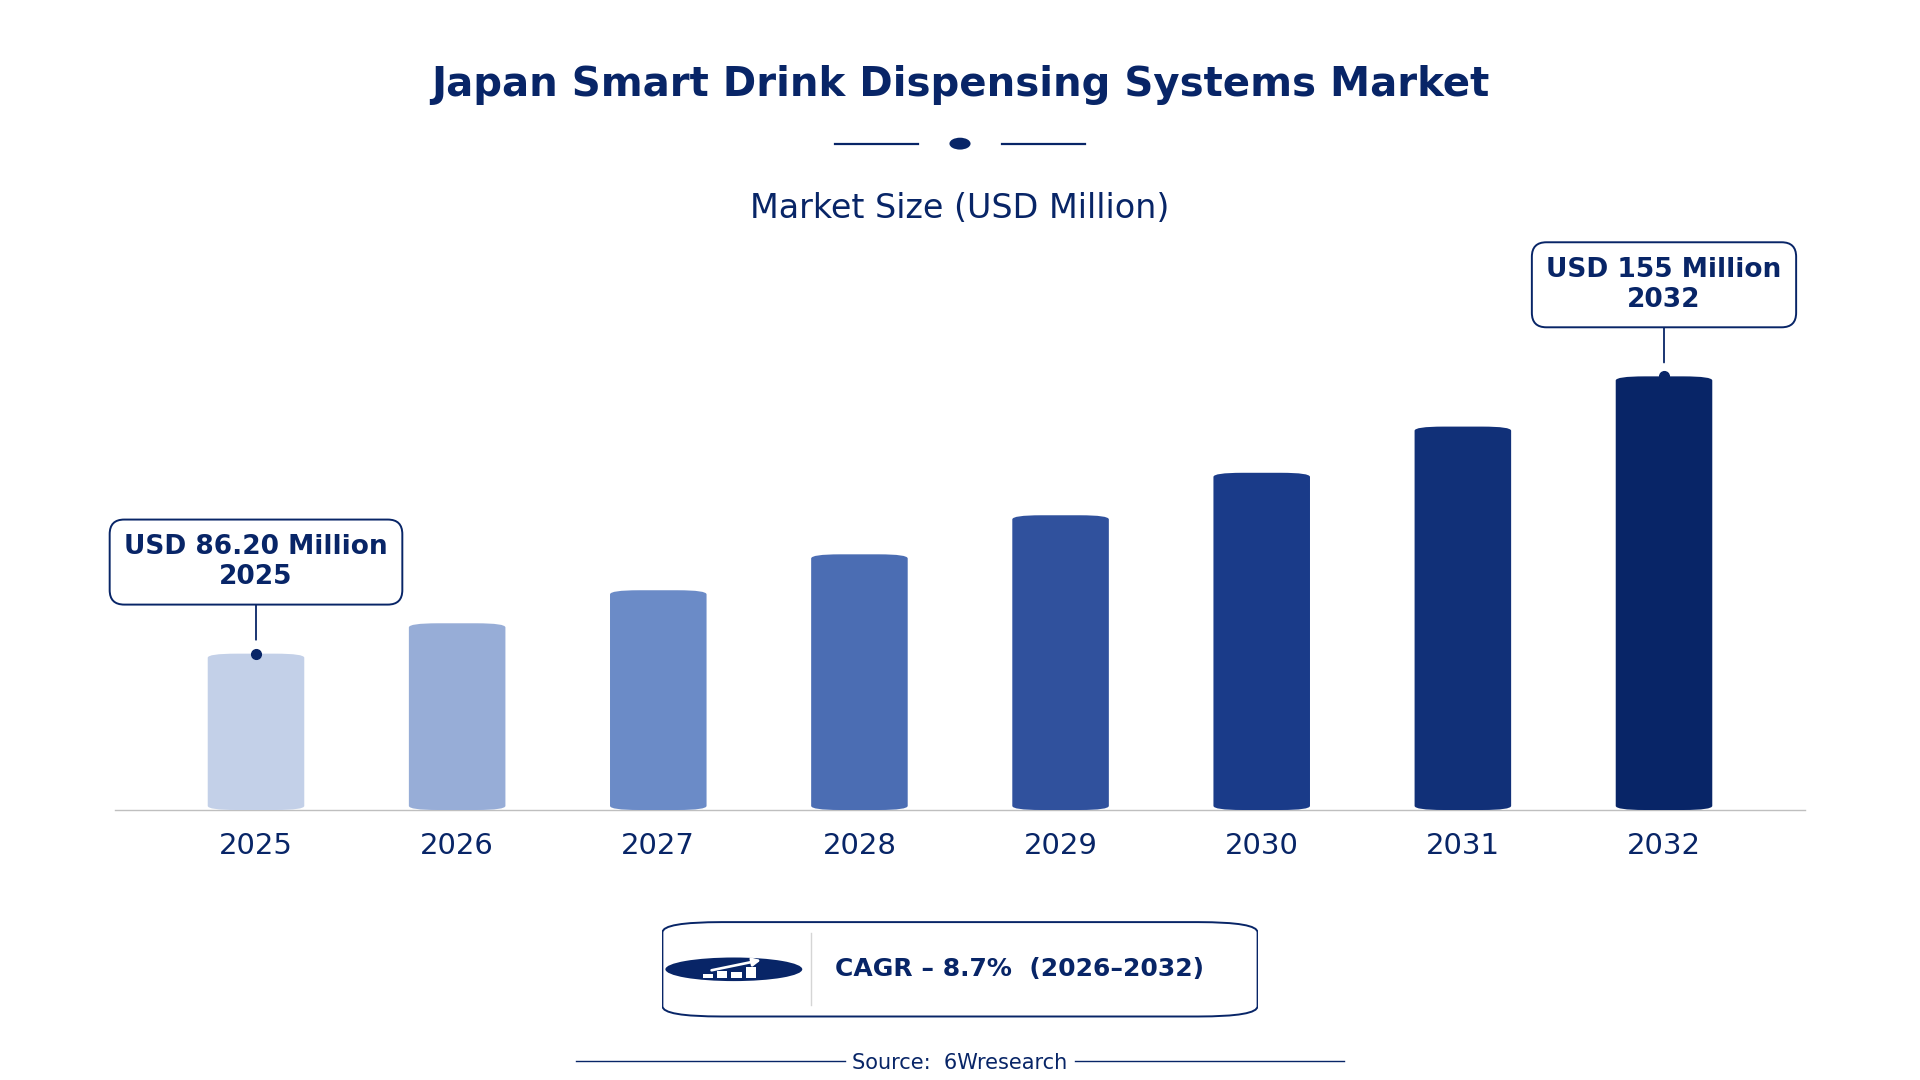
According to 6Wresearch internal database and industry insights, the Japan Smart Drink Dispensing Systems Market was valued at USD 86.20 Million in 2025 and is projected to reach USD 155 Million by 2032, growing at a CAGR of approximately 8.7% during 2026–2032.
Japan Smart Drink Dispensing Systems Market Highlights
| Report Metric | Details |
| Report Name | Japan Smart Drink Dispensing Systems Market (2026-2032) |
| Market Size 2025 | USD 86.20 Million |
| Market Size 2032 | USD 155 Million |
| Absolute Growth 2025–2032 | USD 68.80 Million |
| CAGR 2026–2032 | 8.7% |
| Peak Annual Growth | 10.3% in 2028 |
| Forecast Period | 2026–2032 |
| Historical Data | 2022–2025 |
| Base Year | 2025 |
| Leading Dispenser Type, 2025 | Self-Serve Kiosks (42% share) |
| Leading Smart Functionality, 2025 | Portion + Recipe Control (39% share) |
| Leading Use Location, 2025 | Cafeterias & Restaurants (34% share) |
| Leading End User, 2025 | Food Service Chains (40% share) |
| Fastest-Growing Dispenser Type | App-Controlled Dispensers (11.9% CAGR) |
| Fastest-Growing Smart Functionality | User Profiles & Mixing (11.4% CAGR) |
| Fastest-Growing Use Location | Homes (11.6% CAGR) |
| Fastest-Growing End User | Beverage Brands (10.9% CAGR) |
| Growing Sector | Beverage Brands |
| Key End Users | Food Service Chains, Beverage Brands, Vending Service Providers, Hospitality Industry |
Japan Smart Drink Dispensing Systems Market Year-wise Growth Rate and Key Drivers (2022–2032)
This graph illustrates the annual growth rates of the market from 2022 to 2032, highlighting a steady upward trajectory and projected market expansion over the forecast period.
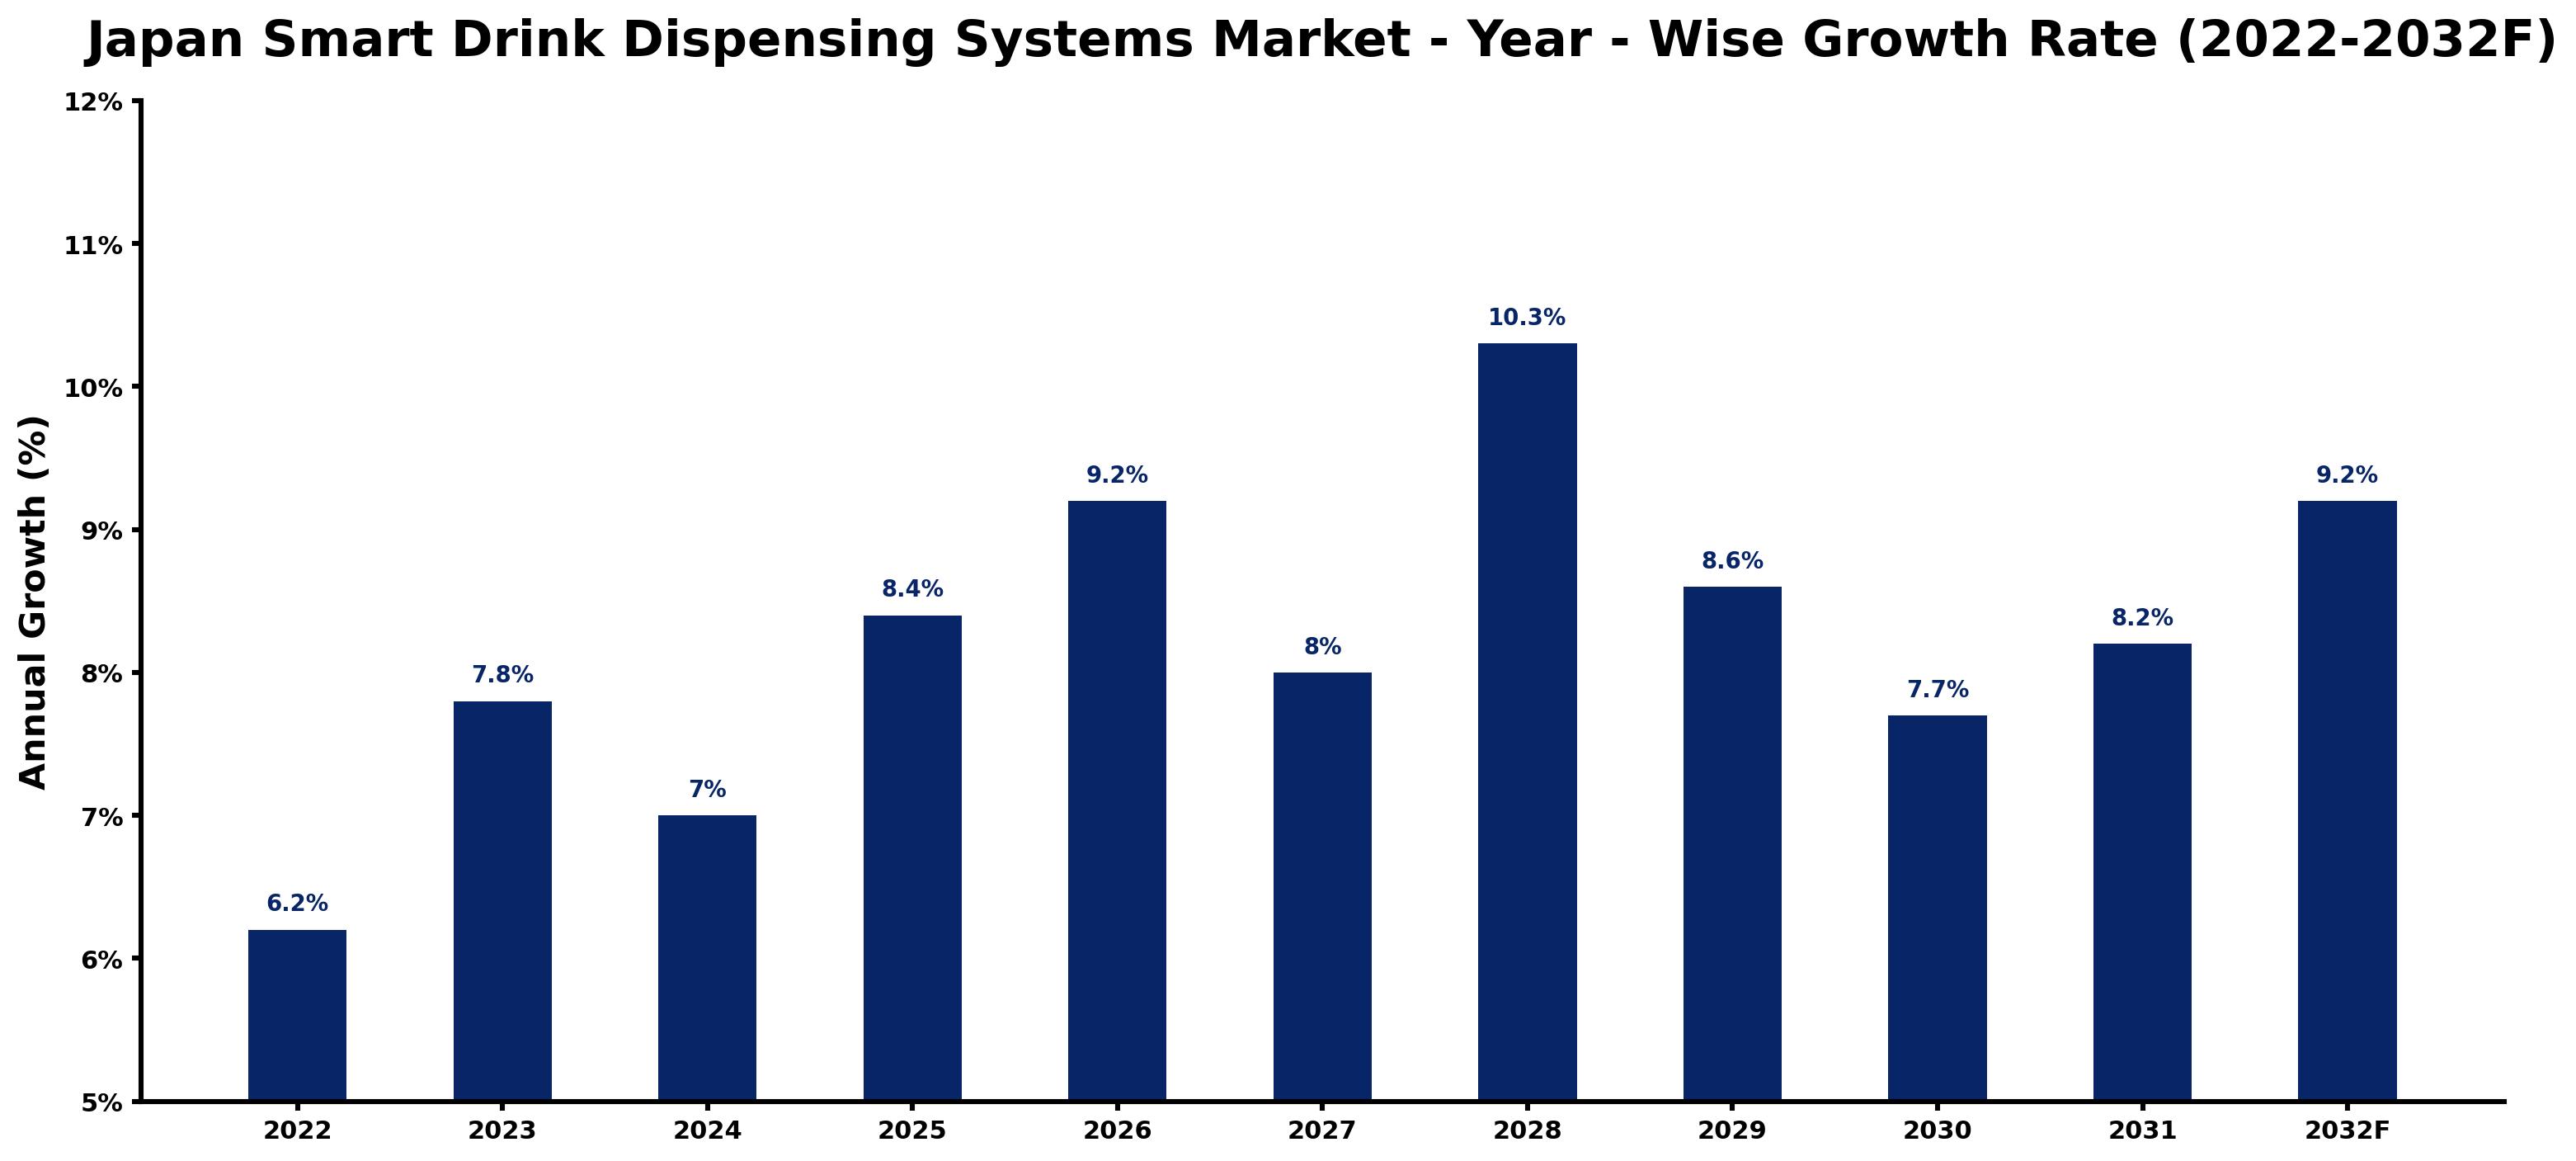
Below, each year's estimated growth is shown next to the factor that most influenced it.
| Year | Estimated Annual Growth (%) | Market Rationale |
| 2022 | 6.2 | The market showed steady growth with increasing interest in automation in food service. |
| 2023 | 7.8 | Demand accelerated due to heightened consumer preferences for convenience and automation. |
| 2024 | 7.0 | Growth slowed as market saturation began to affect new installations. |
| 2025 | 8.4 | The market rebounded with investments in smart technology across food services. |
| 2026 | 9.2 | Demand is expected to rise as more corporate offices adopt smart drink dispensing systems. |
| 2027 | 8.0 | Growth is projected to slow again as competition intensifies among suppliers. |
| 2028 | 10.3 | The market is expected to peak due to a surge in hygiene-focused solutions. |
| 2029 | 8.6 | Growth will slow as the market begins to stabilise after rapid expansion. |
| 2030 | 7.7 | Demand is projected to continue slowing as the market matures and competition increases. |
| 2031 | 8.2 | The market will see renewed interest as new technologies emerge and gain traction. |
| 2032 | 9.2 | Growth is expected to stabilise as the market reaches maturity with consistent demand. |
Note: Market size estimations and growth projections presented in this report are based on 6Wresearch's proprietary forecasting methodology, utilizing the latest available industry data, government publications, and primary research inputs.
Japan Smart Drink Dispensing Systems Market Synopsis
Smart Drink Dispensing Systems are automated machines that dispense beverages according to user preferences, improving customer experience in food service and hospitality sectors. The Japan Smart Drink Dispensing Systems Market is growing due to the booming food service industry, which generated over 20 trillion JPY in 2023, alongside rising trends in automation. The integration of smart technology in over 50% of corporate offices and the presence of self-serve kiosks in 70% of major fast-food chains further drive demand for these systems.
Market Dynamics Impact Analysis (2026–2032)
| Factor | Type | Impact | Primary Segment Affected |
| Growing demand for automation in food service | Driver | High | Self-Serve Kiosks |
| Increased focus on hygiene and safety post-pandemic | Driver | High | Touchless Drink Towers |
| Expansion of corporate offices adopting smart systems | Opportunity | High | Corporate Offices |
| Rising consumer spending on beverages in urban areas | Opportunity | High | Cafeterias & Restaurants |
| Market saturation limiting new installations | Restraint | Medium | App-Controlled Dispensers |
| High initial investment costs for advanced systems | Restraint | Medium | Self-Serve Kiosks |
| Intense competition among suppliers affecting pricing | Challenge | High | Self-Serve Kiosks |
| Technological advancements requiring continuous updates | Challenge | Medium | Self-Serve Kiosks |
Evaluation of Drivers in Japan Smart Drink Dispensing Systems Market (2026–2032)
The factors lifting demand, and the evidence behind each, are summarised below.
| Drivers | Primary Segment Affected | Why It Matters (Evidence) |
| Increased automation in food service operations | Self-Serve Kiosks | Over 70% of major fast-food chains in Japan now use self-serve kiosks, improving customer convenience. |
| Growing consumer preference for hygiene | Touchless Drink Towers | Touchless drink towers are gaining traction, with installations in urban public spaces addressing hygiene standards. |
| Rising beverage consumption in urban areas | Cafeterias & Restaurants | Tokyo accounts for 30% of Japan's beverage consumption, driving demand for efficient dispensing solutions. |
| Corporate investment in employee amenities | Corporate Offices | Smart drink dispensers are now used in over 50% of corporate offices, boosting workplace satisfaction. |
| Technological advancements in beverage dispensing | App-Controlled Dispensers | The demand for app-controlled dispensers is increasing as consumers seek personalised beverage experiences. |
Behind the steady rise in orders sits the increasing automation in food service operations, with over 60% of cafes and restaurants adopting smart drink dispensing systems to improve customer experience. Demand for touchless drink towers has surged, particularly in public venues, as hygiene concerns rise. In urban areas, the beverage market continues to expand, with Tokyo accounting for 30% of consumption, driving demand for efficient dispensing solutions. Corporate investment in employee amenities has led to smart drink dispensers being adopted in over 50% of corporate offices, enhancing workplace satisfaction. Technological advancements are pushing the demand for app-controlled dispensers, as consumers increasingly seek tailored beverage experiences.
Evaluation of Restraints in Japan Smart Drink Dispensing Systems Market
Below are the constraints most often cited by buyers and suppliers, with the segment each affects.
| Market Restraint | Primary Segment Affected | Why It Matters (Evidence) |
| Outdated technology in food service operations | Self-Serve Kiosks | Many restaurants face inefficiencies due to outdated systems, leading to annual revenue losses of up to 15%. |
| Skills gaps in operating advanced systems | Touchless Drink Towers | Many workers lack training in new technologies, delaying implementation by an average of six months. |
| Regulatory compliance costs | App-Controlled Dispensers | Compliance with ISO 22000 can take over a year and cost around 5 million JPY for certification. |
| Competition from traditional beverage service methods | Cafeterias & Restaurants | Buyers hesitate to invest in new systems due to fierce competition from established service methods. |
| Market saturation affecting new installations | Corporate Offices | As the market matures, new installations are becoming less frequent, slowing growth. |
Japan Smart Drink Dispensing Systems Market Challenges
Japan's food service sector grapples with outdated technology, resulting in inefficiencies that cost restaurants up to 15% in lost revenue annually. A shortage of skilled workers proficient in advanced dispensing systems delays implementation for cafes and restaurants by an average of six months. Regulatory hurdles, particularly compliance with ISO 22000, impose additional costs on producers, with certification processes taking over a year and costing around 5 million JPY. Traditional beverage service methods still prevail, causing buyers to hesitate on investing in new systems despite their long-term advantages, leading to missed opportunities for improved customer experience.
Trends in the Japan Smart Drink Dispensing Systems Market
Below are the shifts with the largest effect on the Japan Smart Drink Dispensing Systems Market.
- Shift Towards Touchless Solutions: Public venues are increasingly adopting touchless drink towers to address hygiene concerns, especially post-2020. Installations are rising in urban areas, reflecting changing consumer preferences.
- Rise of App-Controlled Dispensers: The demand for app-controlled dispensers is growing as consumers seek personalised beverage experiences. This shift is particularly notable in urban cafes, where convenience is paramount.
- Increased Automation in Corporate Offices: Corporate offices are embracing automation with smart drink dispensing systems, enhancing employee satisfaction. Over 50% of offices in urban areas have already adopted these systems.
- Growth in Self-Serve Kiosks: Self-serve kiosks are prevalent in over 70% of major fast-food chains, reflecting a shift towards customer convenience in Japan's food service sector.
Investment Opportunities in the Japan Smart Drink Dispensing Systems Market
The following areas offer the clearest openings for investors and suppliers in the Japan Smart Drink Dispensing Systems Market.
- Timing for Smart Drink Solutions: With the food service industry generating over 20 trillion JPY in 2023, there is an opportunity to supply smart drink dispensing systems to improve customer service.
- Investing in Touchless Technology: The increasing demand for hygiene solutions presents an opportunity to supply touchless drink towers, particularly in urban public spaces, where installations are on the rise.
- Partnering for Market Entry: Local partnerships can facilitate entry into the market for smart drink dispensing systems, especially in urban areas where demand is growing.
- Addressing the Skills Gap: Investing in training programs for staff on advanced dispensing systems can bridge the skills gap, improving implementation efficiency in food service.
Government Initiatives in the Japan Smart Drink Dispensing Systems Market
The Food Sanitation Act amendment of 2018 mandates HACCP-based hygiene management for food businesses, impacting producers of smart drink dispensing systems by requiring them to implement stringent safety protocols. Compliance with this regulation ensures that beverage dispensing systems meet high standards, which is crucial for gaining consumer trust and maintaining market competitiveness. Additionally, the New Robot Strategy initiated in 2015 promotes the integration of robotics in various sectors, including food service, encouraging producers to invest in automated solutions that align with national goals for efficiency and innovation.
The Ministry of Economy, Trade and Industry (METI) is funding research on smart food technologies, with an allocation of 2 billion JPY aimed at enhancing automation in food service. This funding supports the development and implementation of advanced smart drink dispensing systems, enabling producers to innovate and improve operational efficiency. The agency also oversees the Smart Food Service Initiative, which aims to promote automation across the food service industry, benefiting both producers and buyers by streamlining operations and improving service quality.
Future Insight of the Japan Smart Drink Dispensing Systems Market
By 2032, the Japanese food service sector will undergo a transformation driven by government initiatives and technological advancements. The adoption of JIS standards will improve safety and quality in smart dispensing technology, reassuring buyers about product reliability. Automation will proliferate, with over 70% of fast-food chains implementing smart drink dispensing systems, streamlining operations and enhancing customer engagement.
Market Segmentation Analysis
Japan Smart Drink Dispensing Systems Market report covers a detailed analysis of the following market segments:
By Dispenser Type – Self-Serve Kiosks Lead, App-Controlled Dispensers Expected to Grow Fastest
According to Saurav Kr Singh, Senior Research Analyst at 6Wresearch, in 2025, Self-Serve Kiosks led the dispenser type split with a 42% share. Self-serve kiosks dominate the market due to their widespread implementation in restaurants, significantly enhancing customer convenience. Their usage is evident in over 70% of major fast-food chains, making them a staple in the food service sector. Over 2026–2032, App-Controlled Dispensers are expected to post the fastest growth, at a CAGR of 11.9%. App-controlled dispensers are experiencing rapid growth as consumers increasingly desire personalised drink options through smartphone integration. This trend is reflected in the rising adoption rates among cafes aiming to attract tech-savvy clientele. Suppliers should focus on developing app-controlled solutions to meet the growing consumer demand for personalised experiences.
By Smart Functionality – Portion + Recipe Control Leads, User Profiles & Mixing Expected to Grow Fastest
Portion + Recipe Control held 39% of the Japan Smart Drink Dispensing Systems Market by smart functionality in 2025. Portion and recipe control features are essential for ensuring consistent beverage quality, making them highly sought after in the food service sector. Their importance is underscored by the rigorous standards set by ISO 22000 for food safety in beverage dispensing. User Profiles & Mixing is set to record the highest CAGR in this split, 11.4% over 2026–2032. User profiles and mixing functionalities are gaining traction as they cater to niche markets seeking personalised beverage experiences. This growth is propelled by increasing consumer interest in tailored drink options, particularly in upscale venues. Buyers may benefit from investing in systems that offer advanced mixing capabilities to differentiate their offerings.
By Use Location – Cafeterias & Restaurants Lead, Homes Expected to Grow Fastest
With 34% of use location revenue in 2025, Cafeterias & Restaurants was the largest category. Cafeterias and restaurants are the leading locations for deploying smart drink dispensing systems, driven by the high demand within Japan's thriving food service industry. With over 400,000 cafes and restaurants, this segment presents a substantial market for these systems. Homes are projected to grow fastest, at a CAGR of 11.6% during 2026–2032. Homes are becoming the fastest-growing segment for smart drink dispensing systems, fuelled by a rising interest in convenience and personalised beverage experiences. This trend is evidenced by the increasing number of households adopting such technologies. Suppliers should target residential markets to take advantage of this emerging consumer trend.
By End User – Food Service Chains Lead, Beverage Brands Expected to Grow Fastest
Food Service Chains took 40% of end user revenue in 2025, more than any other category. Food service chains are the largest users of smart drink dispensing systems, as they depend on these technologies to optimise operations and enhance customer satisfaction. Their extensive presence across various dining establishments underscores their significant market share. The quickest growth will come from Beverage Brands, forecast to expand at a CAGR of 10.9% between 2026 and 2032. Beverage brands are rapidly increasing their utilisation of smart drink dispensing systems for promotional activities, indicating a shift towards direct consumer engagement. This trend is likely to grow as brands seek new ways to connect with their audience. Suppliers should consider collaborations with beverage brands to capitalise on promotional opportunities and broaden their market presence.
Key Attractiveness of the Report
- 10 Years of Market Numbers
- Historical Data Starting from 2022 to 2025
- Base Year 2025
- Forecast Data until 2032
- Key Performance Indicators Impacting the Market
- Major Upcoming Developments and Projects
Key Highlights of the Report:
- Japan Smart Drink Dispensing Systems Market Outlook
- Market Size of Japan Smart Drink Dispensing Systems Market, 2025
- Forecast of Japan Smart Drink Dispensing Systems Market, 2032
- Historical Data and Forecast of Japan Smart Drink Dispensing Systems Revenues & Volume for the Period 2022-2032F
- Japan Smart Drink Dispensing Systems Market Trend Evolution
- Japan Smart Drink Dispensing Systems Market Drivers and Challenges
- Japan Smart Drink Dispensing Systems Price Trends
- Japan Smart Drink Dispensing Systems Porter's Five Forces
- Japan Smart Drink Dispensing Systems Industry Life Cycle
- Historical Data and Forecast of Japan Smart Drink Dispensing Systems Market Revenues & Volume By Dispenser Type for the Period 2022-2032F
- Historical Data and Forecast of Japan Smart Drink Dispensing Systems Market Revenues & Volume By Self-Serve Kiosks for the Period 2022-2032F
- Historical Data and Forecast of Japan Smart Drink Dispensing Systems Market Revenues & Volume By App-Controlled Dispensers for the Period 2022-2032F
- Historical Data and Forecast of Japan Smart Drink Dispensing Systems Market Revenues & Volume By RFID-Enabled Machines for the Period 2022-2032F
- Historical Data and Forecast of Japan Smart Drink Dispensing Systems Market Revenues & Volume By Touchless Drink Towers for the Period 2022-2032F
- Historical Data and Forecast of Japan Smart Drink Dispensing Systems Market Revenues & Volume By Smart Functionality for the Period 2022-2032F
- Historical Data and Forecast of Japan Smart Drink Dispensing Systems Market Revenues & Volume By Portion + Recipe Control for the Period 2022-2032F
- Historical Data and Forecast of Japan Smart Drink Dispensing Systems Market Revenues & Volume By User Profiles & Mixing for the Period 2022-2032F
- Historical Data and Forecast of Japan Smart Drink Dispensing Systems Market Revenues & Volume By Access Control + Payment for the Period 2022-2032F
- Historical Data and Forecast of Japan Smart Drink Dispensing Systems Market Revenues & Volume By Motion/Voice Activation for the Period 2022-2032F
- Historical Data and Forecast of Japan Smart Drink Dispensing Systems Market Revenues & Volume By Use Location for the Period 2022-2032F
- Historical Data and Forecast of Japan Smart Drink Dispensing Systems Market Revenues & Volume By Cafeterias & Restaurants for the Period 2022-2032F
- Historical Data and Forecast of Japan Smart Drink Dispensing Systems Market Revenues & Volume By Homes, Gyms for the Period 2022-2032F
- Historical Data and Forecast of Japan Smart Drink Dispensing Systems Market Revenues & Volume By Corporate Offices for the Period 2022-2032F
- Historical Data and Forecast of Japan Smart Drink Dispensing Systems Market Revenues & Volume By Events & Hotels for the Period 2022-2032F
- Historical Data and Forecast of Japan Smart Drink Dispensing Systems Market Revenues & Volume By End User for the Period 2022-2032F
- Historical Data and Forecast of Japan Smart Drink Dispensing Systems Market Revenues & Volume By Food Service Chains for the Period 2022-2032F
- Historical Data and Forecast of Japan Smart Drink Dispensing Systems Market Revenues & Volume By Beverage Brands for the Period 2022-2032F
- Historical Data and Forecast of Japan Smart Drink Dispensing Systems Market Revenues & Volume By Vending Service Providers for the Period 2022-2032F
- Historical Data and Forecast of Japan Smart Drink Dispensing Systems Market Revenues & Volume By Hospitality Industry for the Period 2022-2032F
- Japan Smart Drink Dispensing Systems Import Export Trade Statistics
- Market Opportunity Assessment By Dispenser Type
- Market Opportunity Assessment By Smart Functionality
- Market Opportunity Assessment By Use Location
- Market Opportunity Assessment By End User
- Japan Smart Drink Dispensing Systems Top Companies Market Share
- Japan Smart Drink Dispensing Systems Competitive Benchmarking By Technical and Operational Parameters
- Japan Smart Drink Dispensing Systems Company Profiles
- Japan Smart Drink Dispensing Systems Key Strategic Recommendations
Market Covered
Segments analysed in this report are listed below.
By Dispenser Type
- Self-Serve Kiosks
- App-Controlled Dispensers
- RFID-Enabled Machines
- Touchless Drink Towers
By Smart Functionality
- Portion + Recipe Control
- User Profiles & Mixing
- Access Control + Payment
- Motion/Voice Activation
By Use Location
- Cafeterias & Restaurants
- Homes
- Gyms
- Corporate Offices
- Events & Hotels
By End User
- Food Service Chains
- Beverage Brands
- Vending Service Providers
- Hospitality Industry































