Japan Smart Manufacturing Visualization Market Size & Growth Rate
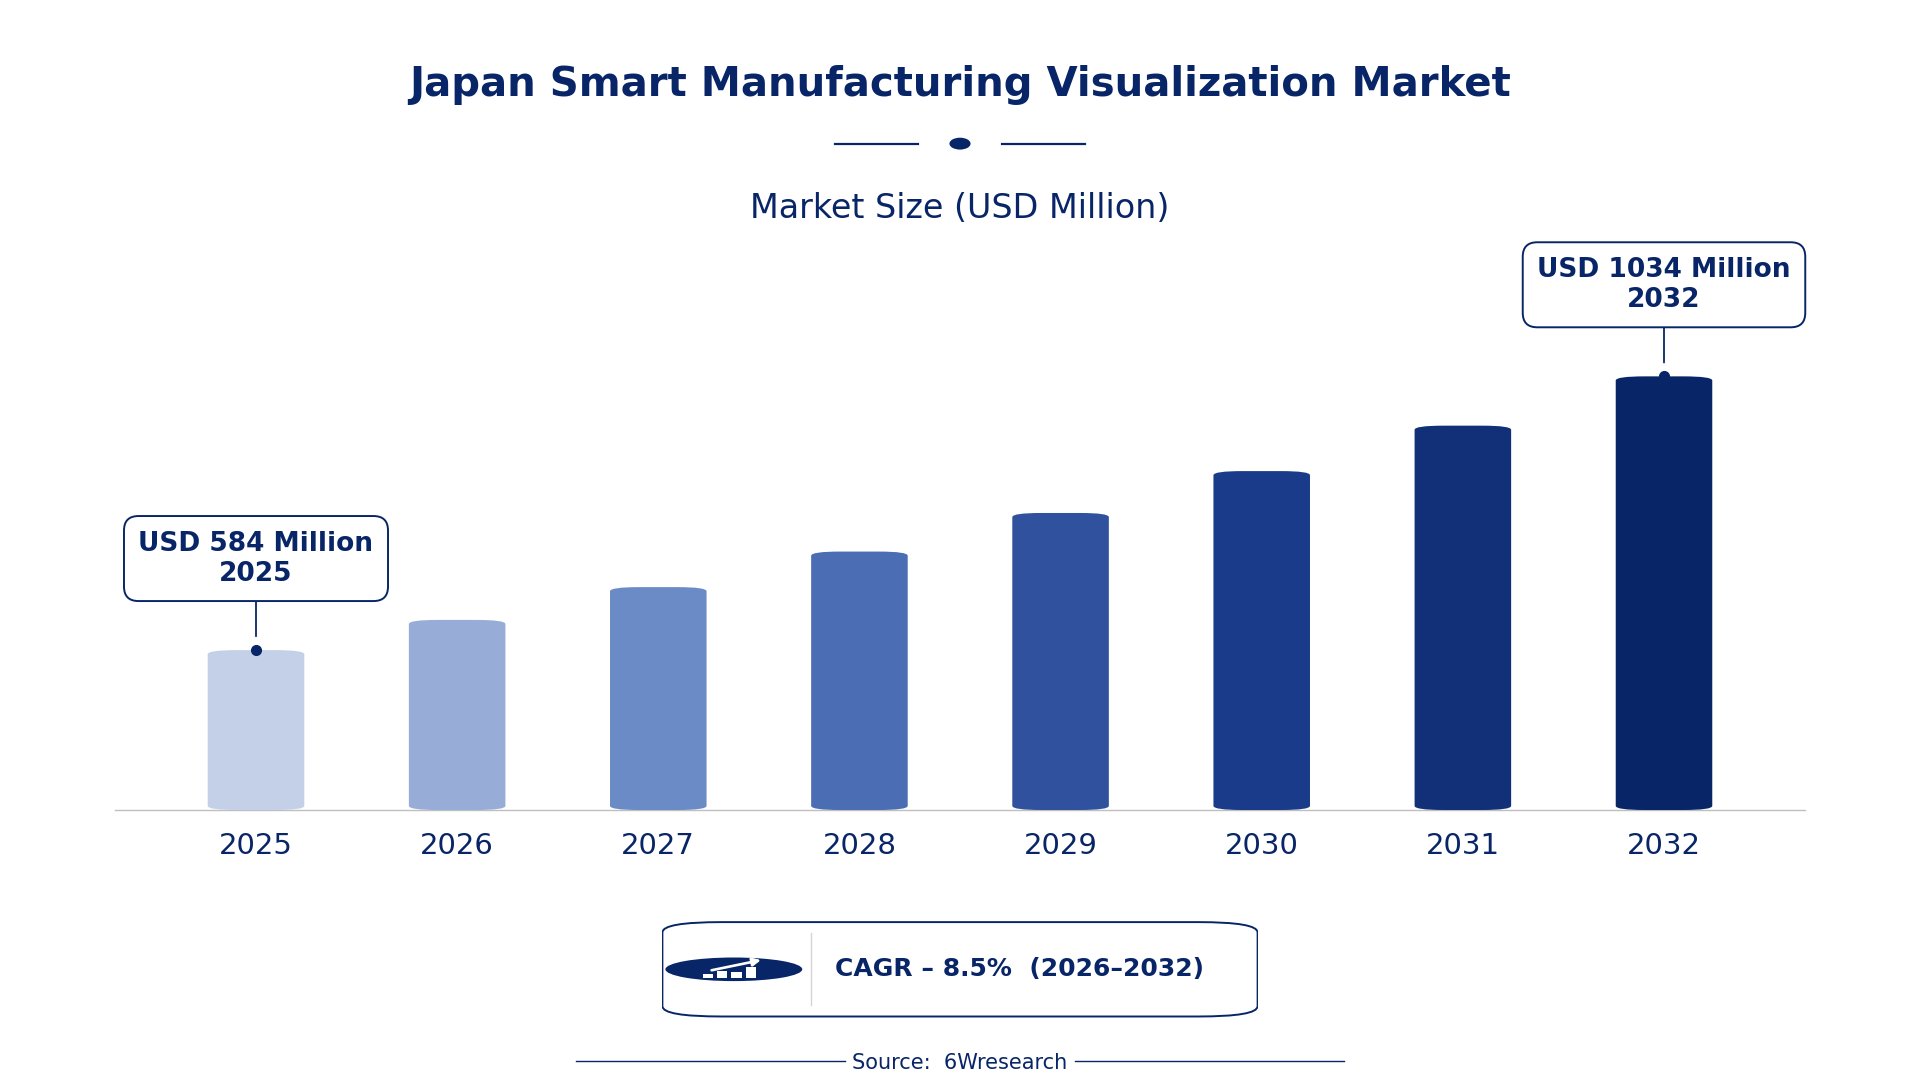
According to 6Wresearch internal database and industry insights, the Japan Smart Manufacturing Visualization Market was valued at USD 584 Million in 2025 and is projected to reach USD 1,034 Million by 2032, growing at a CAGR of approximately 8.5% during 2026–2032.
Japan Smart Manufacturing Visualization Market Highlights
| Report Metric | Details |
| Report Name | Japan Smart Manufacturing Visualization Market (2026-2032) |
| Market Size 2025 | USD 584 Million |
| Market Size 2032 | USD 1,034 Million |
| Absolute Growth 2025–2032 | USD 450 Million |
| CAGR 2026–2032 | 8.5% |
| Peak Annual Growth | 10.1% in 2028 |
| Forecast Period | 2026–2032 |
| Historical Data | 2022–2025 |
| Base Year | 2025 |
| Leading Visualization Tool, 2025 | Digital Dashboards (43% share) |
| Leading Core Feature, 2025 | Real-Time Metrics (46% share) |
| Leading Visualization Method, 2025 | Web & Mobile Interface (40% share) |
| Leading End User, 2025 | Plant Managers (41% share) |
| Fastest-Growing Visualization Tool | AR-Based Layout Planning (11.5% CAGR) |
| Fastest-Growing Core Feature | Spatial Simulation (10.9% CAGR) |
| Fastest-Growing Visualization Method | Augmented Reality (12.7% CAGR) |
| Fastest-Growing End User | Manufacturing Analysts (10.8% CAGR) |
| Growing Sector | Manufacturing |
| Key End Users | Plant Managers, Manufacturing Analysts, Facility Managers, Factory Designers |
Japan Smart Manufacturing Visualization Market Year-wise Growth Rate and Key Drivers (2022–2032)
This graph illustrates the annual growth rates of the market from 2022 to 2032, highlighting a steady upward trajectory and projected market expansion over the forecast period.
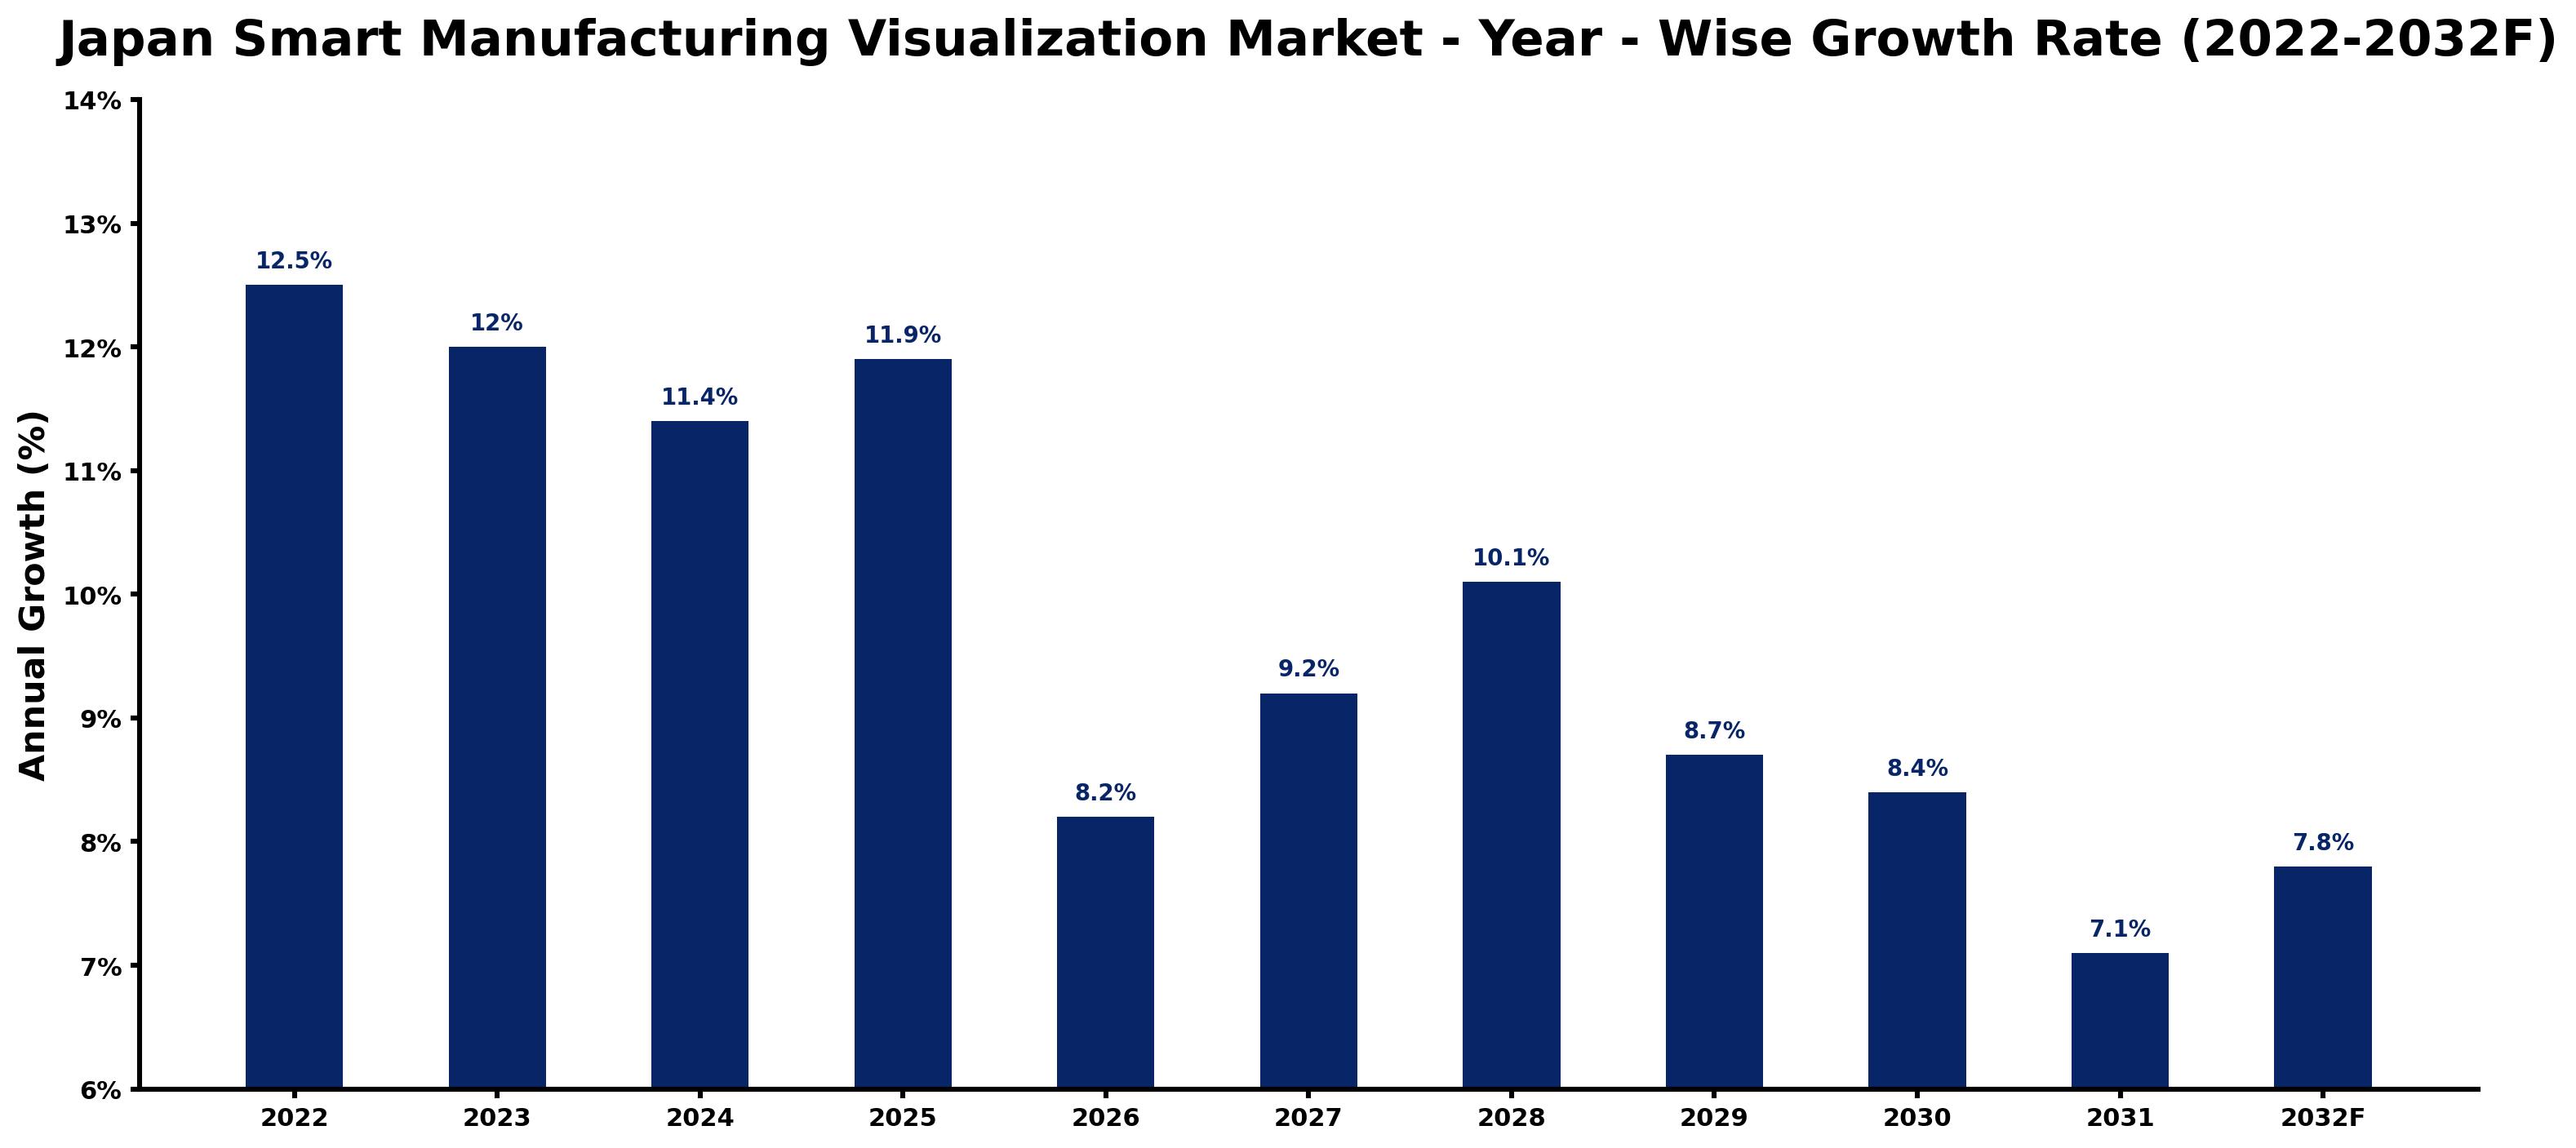
Each row of the following table gives one year's estimated growth and the event or demand shift that explains it.
| Year | Estimated Annual Growth (%) | Market Rationale |
| 2022 | 12.5 | The market experienced strong demand due to increased digital transformation initiatives. |
| 2023 | 12.0 | Growth slowed slightly as companies adjusted to new technologies and processes. |
| 2024 | 11.4 | Demand continued to rise, although at a reduced pace as firms focused on efficiency. |
| 2025 | 11.9 | Investment in smart manufacturing tools accelerated, driving faster growth than the previous year. |
| 2026 | 8.2 | Growth is expected to decelerate as the market begins to normalise after rapid expansion. |
| 2027 | 9.2 | Demand is projected to increase again as companies seek to improve operational capabilities. |
| 2028 | 10.1 | The market is expected to peak with investments in advanced visualization technologies. |
| 2029 | 8.7 | Growth will slow as the market matures and competition intensifies. |
| 2030 | 8.4 | Demand is projected to continue growing but at a slower rate as firms consolidate gains. |
| 2031 | 7.1 | The market is expected to experience a further slowdown as saturation begins to set in. |
| 2032 | 7.8 | Growth will pick up slightly as new technologies emerge to meet evolving needs. |
Note: Market size estimations and growth projections presented in this report are based on 6Wresearch's proprietary forecasting methodology, utilizing the latest available industry data, government publications, and primary research inputs.
Japan Smart Manufacturing Visualization Market Synopsis
Smart Manufacturing Visualization includes technologies that enhance manufacturing processes through real-time data representation, primarily utilising software platforms that integrate various data sources. The Japan Smart Manufacturing Visualization Market is growing due to substantial investments in digital transformation, with ¥1 trillion allocated in 2022. The Tokyo Metropolitan area acts as a hub for advanced technologies, while government support encourages further adoption, driving demand from domestic users and enabling better decision-making in production environments.
Market Dynamics Impact Analysis (2026–2032)
| Factor | Type | Impact | Primary Segment Affected |
| Increased investment in digital transformation initiatives | Driver | High | Digital Dashboards |
| Growing demand for operational efficiency | Driver | High | Real-Time Metrics |
| Rising need for advanced visualization tools | Opportunity | High | AR-Based Layout Planning |
| Expansion of smart manufacturing practices in various sectors | Opportunity | Medium | Data Heatmaps |
| High initial costs of implementation | Restraint | High | 3D Floor Mapping |
| Limited awareness among smaller manufacturers | Restraint | Medium | Spatial Simulation |
| Competition from alternative technologies | Challenge | High | Production Bottlenecks |
| Shortage of skilled workforce for implementation | Challenge | Medium | Equipment Tracking |
Evaluation of Drivers in Japan Smart Manufacturing Visualization Market (2026–2032)
Below are the drivers that matter most for revenue growth, with supporting evidence.
| Drivers | Primary Segment Affected | Why It Matters (Evidence) |
| Significant investment in digital transformation | Digital Dashboards | In 2022, Japan invested ¥1 trillion in digital transformation, boosting demand for visualization tools. |
| Need for real-time operational insights | Real-Time Metrics | Data heatmaps are used in over 70% of manufacturing plants, driving demand for metrics. |
| Adoption of augmented reality in factories | AR-Based Layout Planning | AR technologies have seen a 50% increase in adoption, enhancing layout planning capabilities. |
| Focus on improving manufacturing efficiency | Data Heatmaps | The average factory in Japan has a production capacity of 500 units per day, necessitating efficiency tools. |
| Government initiatives promoting smart manufacturing | 3D Floor Mapping | The Smart Manufacturing Strategy launched in 2021 encourages the adoption of advanced technologies. |
Most of the extra volume stems from investments in digital transformation, with Japan allocating ¥1 trillion in 2022 to improve manufacturing capabilities. The average factory operates at a capacity of 500 units per day, creating a demand for real-time insights. Data heatmaps are widely used, facilitating efficiency analysis across numerous plants. The rise of augmented reality applications has transformed layout planning, with a notable increase in adoption over the past year.
Evaluation of Restraints in Japan Smart Manufacturing Visualization Market
Below are the constraints most often cited by buyers and suppliers, with the segment each affects.
| Market Restraint | Primary Segment Affected | Why It Matters (Evidence) |
| High initial costs associated with implementation | 3D Floor Mapping | The average age of manufacturing equipment in Japan is over 10 years, requiring substantial upgrades. |
| Limited awareness of smart manufacturing benefits | Spatial Simulation | Many smaller manufacturers lack knowledge about the advantages of visualization tools. |
| Competition from alternative technologies | Production Bottlenecks | Emerging technologies may offer similar benefits, impacting market share for visualization tools. |
| Shortage of skilled workforce for implementation | Equipment Tracking | The demand for skilled workers in advanced manufacturing exceeds supply, delaying projects. |
| Regulatory compliance challenges | AR-Based Layout Planning | Manufacturers must navigate complex regulations, which can slow down adoption of new technologies. |
Japan Smart Manufacturing Visualization Market Challenges
Over 8 million people work in Japan's manufacturing sector, yet many producers face challenges with outdated equipment, which limits their ability to adopt smart manufacturing technologies. Buyers experience delays in operational efficiency, extending production timelines by 20%. A skills gap persists as the average age of manufacturing equipment exceeds 10 years, making it difficult for workers to adapt to new systems and diminishing overall productivity. Regulatory requirements from the Ministry of Economy, Trade and Industry, such as compliance with ISO 9001, impose additional costs on producers striving to meet these standards.
Trends in the Japan Smart Manufacturing Visualization Market
Below are the shifts with the largest effect on the Japan Smart Manufacturing Visualization Market.
- Shift Towards Augmented Reality: In 2022, augmented reality applications in factories increased by 50%, reflecting a shift in layout planning methodologies. This trend is particularly pronounced in the Tokyo Metropolitan area, where advanced technologies are increasingly embraced.
- Increase in Data-Driven Decision Making: Data heatmaps are now employed in over 70% of manufacturing plants, indicating a strong trend towards data-driven decision-making. This shift is especially notable in regions with high manufacturing activity, improving operational efficiency.
- Growing Adoption of Real-Time Metrics: The use of real-time metrics is expanding rapidly, with a projected increase in installed visualization tools by 2025. This trend assists manufacturers in optimising production processes and minimising downtime.
- Rise of Integrated Visualization Tools: The integration of visualization tools with IoT technologies began in 2021, coinciding with the government's push for 100% IoT integration by 2030. This initiative is reshaping how manufacturers approach operational efficiency.
Investment Opportunities in the Japan Smart Manufacturing Visualization Market
The following opportunities in the Japan Smart Manufacturing Visualization Market pair current demand with a clear way in.
- Gap in Advanced Visualization Adoption: With the Japanese government aiming for 100% IoT integration in manufacturing by 2030, there is a gap in advanced visualization adoption. Manufacturers in the Tokyo area are particularly in need of these tools to improve efficiency.
- Investment in AR-Based Solutions: The 50% increase in AR adoption presents a prime opportunity for suppliers to offer augmented reality solutions. Factory designers are actively seeking these tools to improve layout planning and operational workflows.
- Demand for Real-Time Data Solutions: As data-driven decision-making rises, the need for real-time data solutions is growing. Manufacturing analysts are looking for advanced visualization tools to improve performance analysis and operational oversight.
- Expansion of Smart Manufacturing Practices: The ongoing promotion of smart manufacturing practices creates opportunities for suppliers of visualization tools. Industry associations are supporting this shift, encouraging manufacturers to invest in advanced technologies.
Government Initiatives in the Japan Smart Manufacturing Visualization Market
The AI Promotion Act, established in 2025, sets a national framework for AI research and development, directly impacting buyers of smart manufacturing visualization tools by encouraging the integration of AI in production processes. Additionally, the Semiconductor and Digital Industry Strategy launched by METI in June 2021 aims to secure domestic semiconductor manufacturing, which is essential for the development of advanced visualization technologies.
The Ministry of Economy, Trade and Industry oversees the implementation of various initiatives, including funding for projects that improve operational efficiency through visualization tools, benefiting manufacturers across Japan by facilitating access to advanced technologies.
Future Insight of the Japan Smart Manufacturing Visualization Market
The Smart Manufacturing Strategy launched by the government will encourage suppliers to improve their technologies and services. By 2025, automation in manufacturing is projected to rise by 30%, enabling buyers to optimise their processes. The growth of data visualization tools will support improved decision-making across factories. As the installed base of these tools expands, manufacturers will increasingly leverage real-time data to enhance operational efficiency.
Market Segmentation Analysis
Japan Smart Manufacturing Visualization Market report covers a detailed analysis of the following market segments:
By Visualization Tool – Digital Dashboards Lead, AR-Based Layout Planning Expected to Grow Fastest
According to Saurav Kr Singh, Senior Research Analyst at 6Wresearch, Digital Dashboards accounted for 43% of the market by visualization tool in 2025. Digital dashboards dominate the market as they provide essential real-time insights into production metrics, which are crucial for operational efficiency in Japan's manufacturing sector. Their widespread use in advanced facilities across the Tokyo Metropolitan area illustrates their importance in enhancing decision-making processes. The quickest growth will come from AR-Based Layout Planning, forecast to expand at a CAGR of 11.5% between 2026 and 2032. AR-based layout planning is gaining momentum due to its effectiveness in optimising factory layouts, which directly impacts space utilisation. The 50% increase in AR applications over the last year signifies a strong shift towards integrating augmented reality technologies in manufacturing. Suppliers should prioritise the development of digital dashboards to align with the growing demand for real-time operational insights.
By Core Feature – Real-Time Metrics Lead, Spatial Simulation Expected to Grow Fastest
In 2025, Real-Time Metrics led the core feature split with a 46% share. Real-time metrics are critical for monitoring production performance, enabling manufacturers to make timely decisions that enhance overall efficiency. The Japanese government's ambition for 100% IoT integration in manufacturing by 2030 underscores the importance of this feature in driving operational improvements. Spatial Simulation is set to record the highest CAGR in this split, 10.9% over 2026–2032. Spatial simulation is rapidly gaining traction as it supports effective planning and optimisation of production flows, which is vital for maintaining competitiveness. The government's target to increase automation in manufacturing by 30% by 2025 further fuels the demand for these planning tools. Buyers should invest in spatial simulation technologies to improve their production planning and operational efficiency.
By Visualization Method – Web & Mobile Interface Leads, Augmented Reality Expected to Grow Fastest
With 40% of visualization method revenue in 2025, Web & Mobile Interface was the largest category. Web and mobile interfaces are essential as they facilitate remote access to data, allowing users to monitor operations from various locations. Their integration into numerous manufacturing facilities highlights their role in providing critical information access to users. Over 2026–2032, Augmented Reality is expected to post the fastest growth, at a CAGR of 12.7%. Augmented reality is emerging as a preferred visualisation method, enhancing user experience with immersive insights. The increasing adoption of AR technologies in factories indicates a shift towards more interactive and engaging visualisation solutions. Suppliers must focus on developing augmented reality solutions to meet the changing preferences of end users.
By End User – Plant Managers Lead, Manufacturing Analysts Expected to Grow Fastest
Plant Managers held 41% of the Japan Smart Manufacturing Visualization Market by end user in 2025. Plant managers are the primary users of visualisation tools, requiring comprehensive oversight to ensure operational efficiency in manufacturing environments. Their pivotal role in decision-making processes necessitates tailored solutions that cater to their specific operational needs. Manufacturing Analysts are projected to grow fastest, at a CAGR of 10.8% during 2026–2032. Manufacturing analysts are increasingly utilising visualisation tools to analyse data for performance improvements, reflecting a trend towards data-driven decision-making. The growing emphasis on operational efficiency suggests that their demand for advanced analytics will continue to rise. Suppliers should consider creating specialised tools that address the analytical requirements of manufacturing analysts.
Key Attractiveness of the Report
- 10 Years of Market Numbers
- Historical Data Starting from 2022 to 2025
- Base Year 2025
- Forecast Data until 2032
- Key Performance Indicators Impacting the Market
- Major Upcoming Developments and Projects
Key Highlights of the Report:
- Japan Smart Manufacturing Visualization Market Outlook
- Market Size of Japan Smart Manufacturing Visualization Market, 2025
- Forecast of Japan Smart Manufacturing Visualization Market, 2032
- Historical Data and Forecast of Japan Smart Manufacturing Visualization Revenues & Volume for the Period 2022-2032F
- Japan Smart Manufacturing Visualization Market Trend Evolution
- Japan Smart Manufacturing Visualization Market Drivers and Challenges
- Japan Smart Manufacturing Visualization Price Trends
- Japan Smart Manufacturing Visualization Porter's Five Forces
- Japan Smart Manufacturing Visualization Industry Life Cycle
- Historical Data and Forecast of Japan Smart Manufacturing Visualization Market Revenues & Volume By Visualization Tool for the Period 2022-2032F
- Historical Data and Forecast of Japan Smart Manufacturing Visualization Market Revenues & Volume By Digital Dashboards for the Period 2022-2032F
- Historical Data and Forecast of Japan Smart Manufacturing Visualization Market Revenues & Volume By AR-Based Layout Planning for the Period 2022-2032F
- Historical Data and Forecast of Japan Smart Manufacturing Visualization Market Revenues & Volume By Data Heatmaps for the Period 2022-2032F
- Historical Data and Forecast of Japan Smart Manufacturing Visualization Market Revenues & Volume By 3D Floor Mapping for the Period 2022-2032F
- Historical Data and Forecast of Japan Smart Manufacturing Visualization Market Revenues & Volume By Core Feature for the Period 2022-2032F
- Historical Data and Forecast of Japan Smart Manufacturing Visualization Market Revenues & Volume By Real-Time Metrics for the Period 2022-2032F
- Historical Data and Forecast of Japan Smart Manufacturing Visualization Market Revenues & Volume By Spatial Simulation for the Period 2022-2032F
- Historical Data and Forecast of Japan Smart Manufacturing Visualization Market Revenues & Volume By Production Bottlenecks for the Period 2022-2032F
- Historical Data and Forecast of Japan Smart Manufacturing Visualization Market Revenues & Volume By Equipment Tracking for the Period 2022-2032F
- Historical Data and Forecast of Japan Smart Manufacturing Visualization Market Revenues & Volume By Visualization Method for the Period 2022-2032F
- Historical Data and Forecast of Japan Smart Manufacturing Visualization Market Revenues & Volume By Web & Mobile Interface for the Period 2022-2032F
- Historical Data and Forecast of Japan Smart Manufacturing Visualization Market Revenues & Volume By Augmented Reality for the Period 2022-2032F
- Historical Data and Forecast of Japan Smart Manufacturing Visualization Market Revenues & Volume By Visual Analytics for the Period 2022-2032F
- Historical Data and Forecast of Japan Smart Manufacturing Visualization Market Revenues & Volume By CAD/IoT Sync for the Period 2022-2032F
- Historical Data and Forecast of Japan Smart Manufacturing Visualization Market Revenues & Volume By End User for the Period 2022-2032F
- Historical Data and Forecast of Japan Smart Manufacturing Visualization Market Revenues & Volume By Plant Managers for the Period 2022-2032F
- Historical Data and Forecast of Japan Smart Manufacturing Visualization Market Revenues & Volume By Factory Designers for the Period 2022-2032F
- Historical Data and Forecast of Japan Smart Manufacturing Visualization Market Revenues & Volume By Manufacturing Analysts for the Period 2022-2032F
- Historical Data and Forecast of Japan Smart Manufacturing Visualization Market Revenues & Volume By Facility Managers for the Period 2022-2032F
- Japan Smart Manufacturing Visualization Import Export Trade Statistics
- Market Opportunity Assessment By Visualization Tool
- Market Opportunity Assessment By Core Feature
- Market Opportunity Assessment By Visualization Method
- Market Opportunity Assessment By End User
- Japan Smart Manufacturing Visualization Top Companies Market Share
- Japan Smart Manufacturing Visualization Competitive Benchmarking By Technical and Operational Parameters
- Japan Smart Manufacturing Visualization Company Profiles
- Japan Smart Manufacturing Visualization Key Strategic Recommendations
Market Covered
Coverage by segment is as follows.
By Visualization Tool
- Digital Dashboards
- AR-Based Layout Planning
- Data Heatmaps
- 3D Floor Mapping
By Core Feature
- Real-Time Metrics
- Spatial Simulation
- Production Bottlenecks
- Equipment Tracking
By Visualization Method
- Web & Mobile Interface
- Augmented Reality
- Visual Analytics
- CAD/IoT Sync
By End User
- Plant Managers
- Factory Designers
- Manufacturing Analysts
- Facility Managers































