Japan Spectroscopy Equipment Market Size & Growth Rate
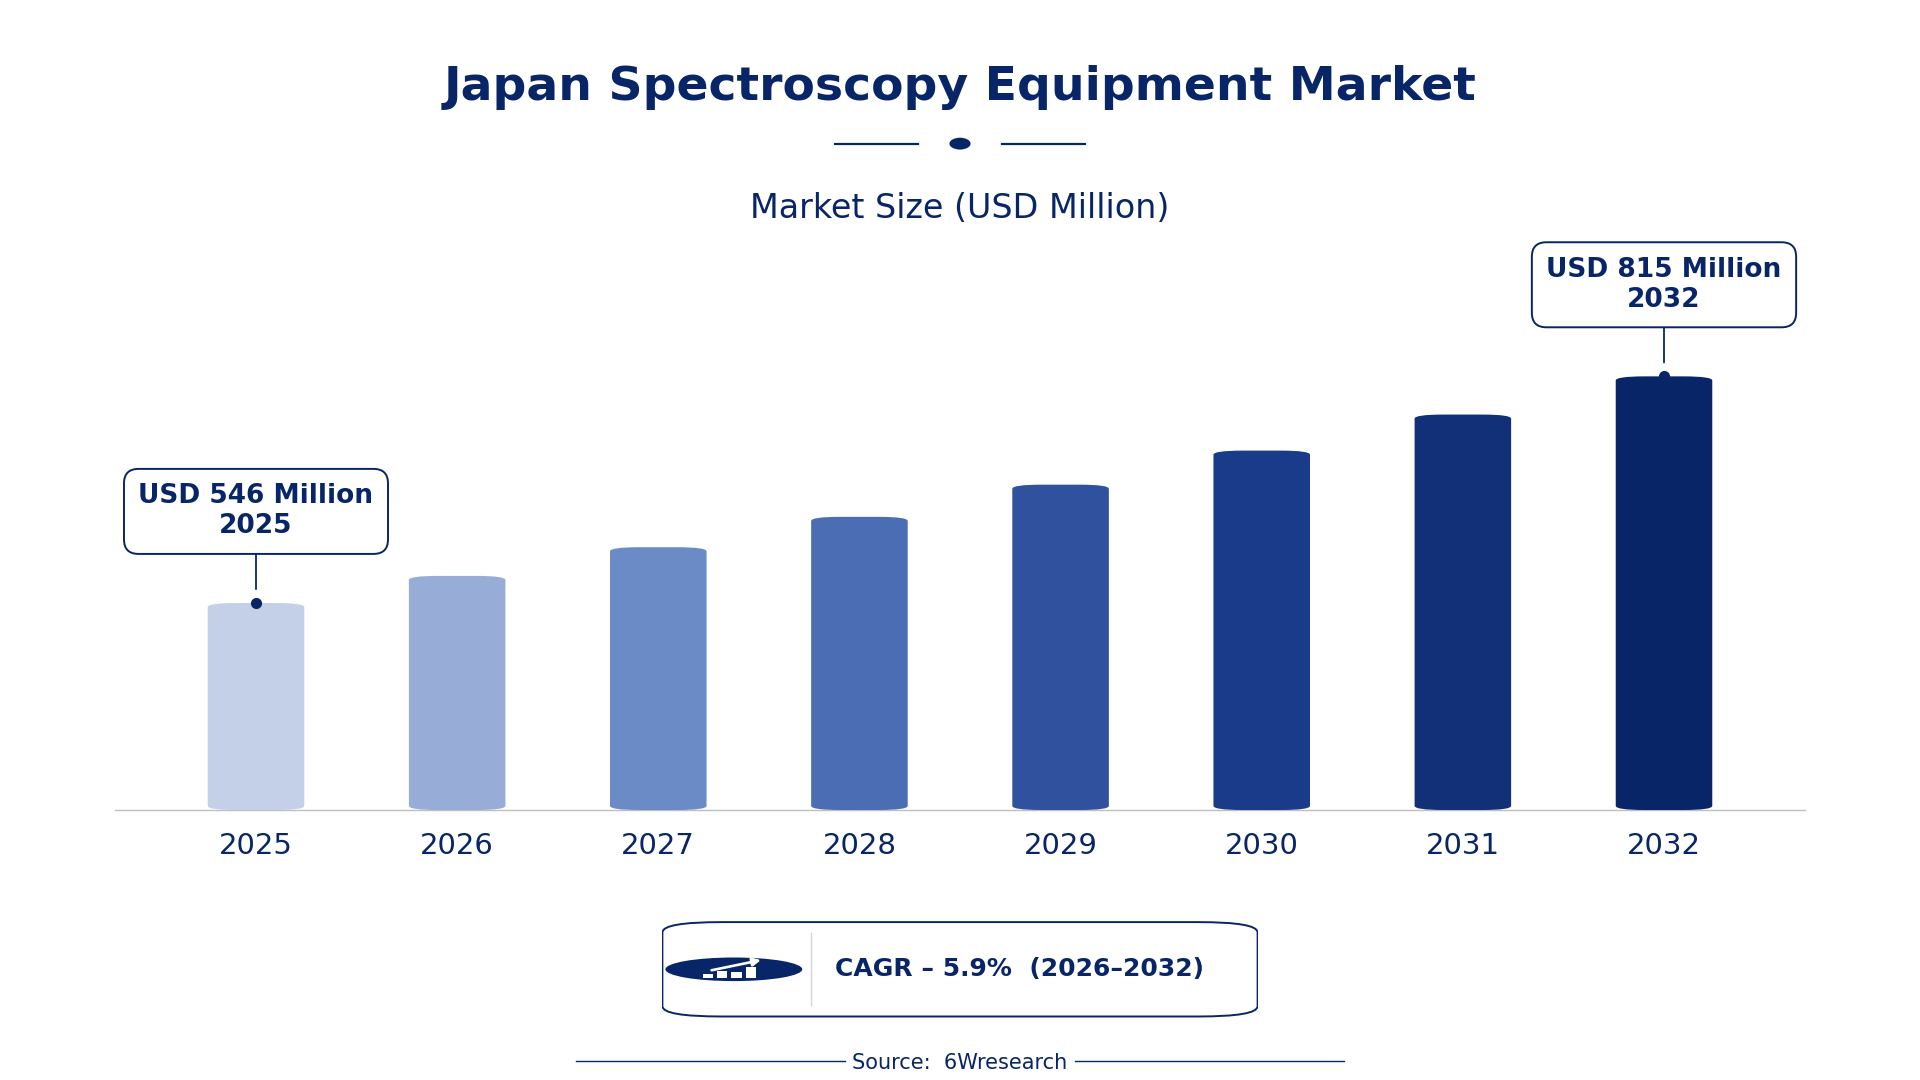
According to 6Wresearch internal database and industry insights, the Japan Spectroscopy Equipment Market was valued at USD 546 Million in 2025 and is projected to reach USD 815 Million by 2032, growing at a CAGR of approximately 5.9% during 2026–2032.
Japan Spectroscopy Equipment Market Highlights
| Report Metric | Details |
| Report Name | Japan Spectroscopy Equipment Market (2026-2032) |
| Market Size 2025 | USD 546 Million |
| Market Size 2032 | USD 815 Million |
| Absolute Growth 2025–2032 | USD 269 Million |
| CAGR 2026–2032 | 5.9% |
| Peak Annual Growth | 6.6% in 2027 |
| Forecast Period | 2026–2032 |
| Historical Data | 2022–2025 |
| Base Year | 2025 |
| Leading Equipment Type, 2025 | Mass Spectrometers (37% share) |
| Leading Spectral Range, 2025 | Mass-to-Charge Ratio (49% share) |
| Leading Detection Principle, 2025 | Ion Detection (35% share) |
| Leading End User, 2025 | Biotech & Pharma Firms (47% share) |
| Fastest-Growing Equipment Type | FTIR Spectrometers (8.2% CAGR) |
| Fastest-Growing Spectral Range | Infrared (8.0% CAGR) |
| Fastest-Growing Detection Principle | Absorbance (7.9% CAGR) |
| Fastest-Growing End User | Chemical Analysts (7.8% CAGR) |
| Growing Sector | Chemical Analysts |
| Key End Users | Biotech & Pharma Firms, Chemical Analysts, Academic Research Labs, Food Safety Laboratories |
Japan Spectroscopy Equipment Market Year-wise Growth Rate and Key Drivers (2022–2032)
This graph illustrates the annual growth rates of the market from 2022 to 2032, highlighting a steady upward trajectory and projected market expansion over the forecast period.
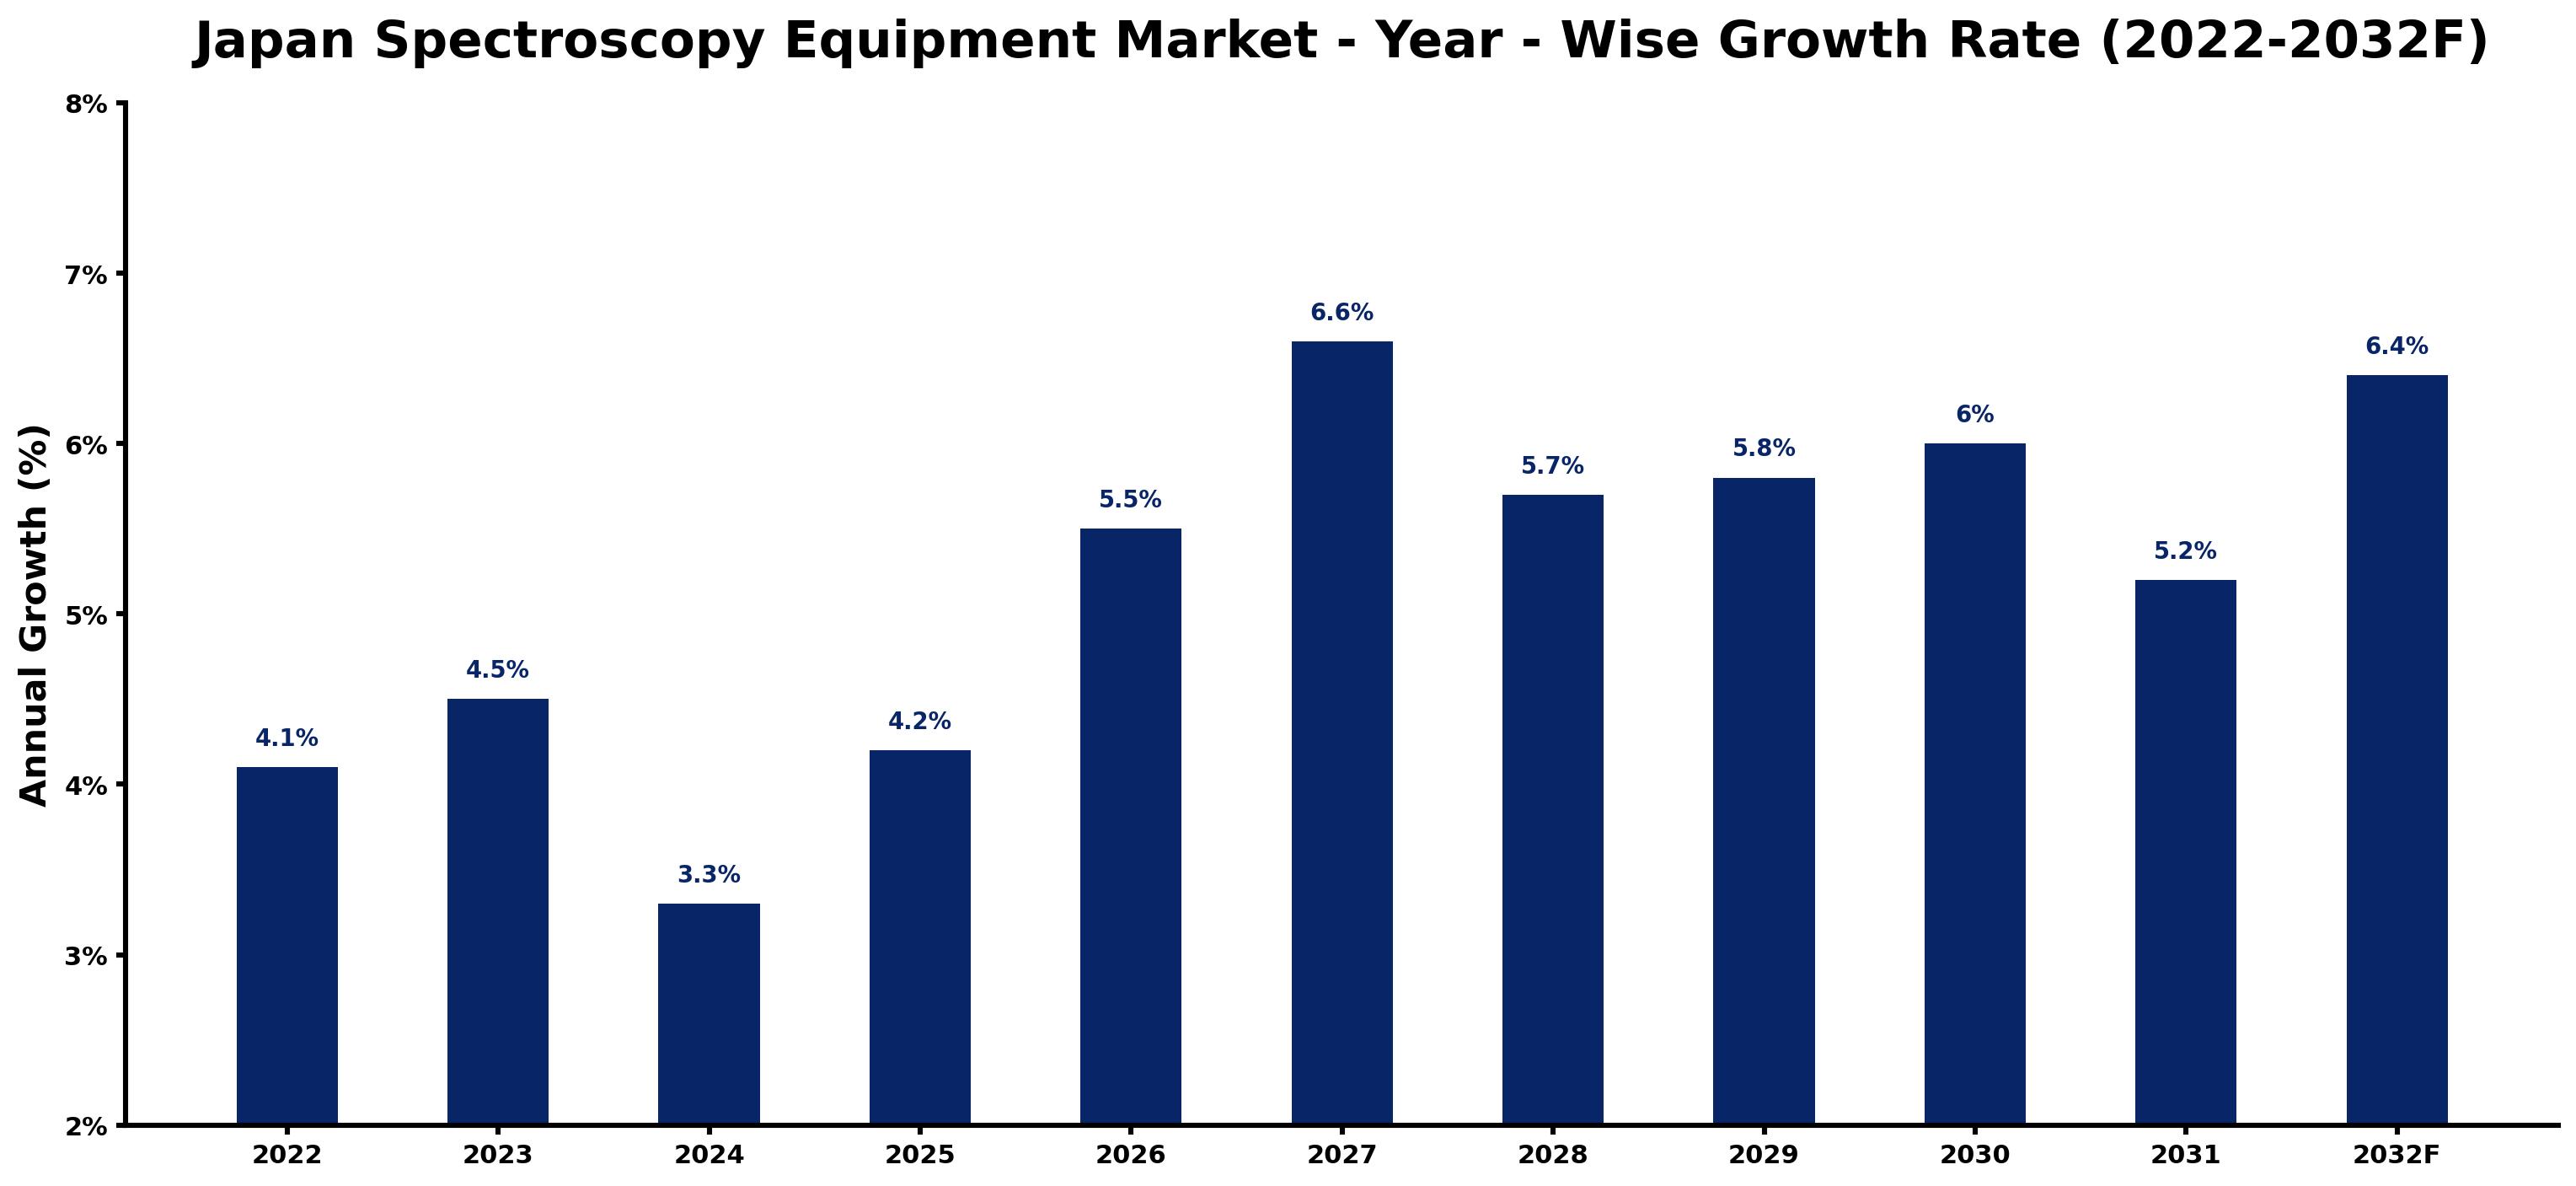
The table below sets out the estimated growth rate for each year and the main factor behind it.
| Year | Estimated Annual Growth (%) | Market Rationale |
| 2022 | 4.1 | The market showed steady growth due to ongoing investments in analytical technologies. |
| 2023 | 4.5 | Demand increased as academic institutions expanded their research capabilities with advanced equipment. |
| 2024 | 3.3 | Growth slowed slightly as firms adjusted to market saturation in certain segments. |
| 2025 | 4.2 | The market rebounded with renewed interest in quality control measures across industries. |
| 2026 | 5.5 | Investment in spectroscopy technologies is expected to drive demand higher this year. |
| 2027 | 6.6 | The peak growth rate is projected as new applications emerge in pharmaceuticals. |
| 2028 | 5.7 | Growth is expected to slow as the market matures and competition intensifies. |
| 2029 | 5.8 | Demand will rise again as firms seek to enhance their analytical capabilities. |
| 2030 | 6.0 | The market is projected to continue growing as new research initiatives are launched. |
| 2031 | 5.2 | Growth is expected to decelerate slightly as firms focus on cost management strategies. |
| 2032 | 6.4 | Demand will surge as technological advancements in spectroscopy gain traction. |
Note: Market size estimations and growth projections presented in this report are based on 6Wresearch's proprietary forecasting methodology, utilizing the latest available industry data, government publications, and primary research inputs.
Japan Spectroscopy Equipment Market Synopsis
Spectroscopy equipment serves as a vital analytical technology that measures light interactions with matter, essential for chemical analysis, quality control, and research. The Japan Spectroscopy Equipment Market is experiencing growth driven by demand from biotech and pharmaceutical firms, which employ mass spectrometers extensively. In 2023, the government allocated ¥5 billion for research in analytical technologies, promoting innovation and expanding the market further. The Tokyo region, a hub for biotech firms, is particularly influential in driving this demand.
Market Dynamics Impact Analysis (2026–2032)
| Factor | Type | Impact | Primary Segment Affected |
| Growing adoption of mass spectrometers in chemical analysis labs | Driver | High | Mass Spectrometers |
| Increased focus on food safety regulations | Driver | High | FTIR Spectrometers |
| Rising number of academic research labs | Opportunity | High | Raman Spectrometers |
| Expansion of biotech firms in Tokyo | Opportunity | High | UV-Vis Spectrometers |
| High costs of advanced equipment | Restraint | Medium | Mass Spectrometers |
| Limited awareness of new technologies | Restraint | Medium | FTIR Spectrometers |
| Competition from alternative analytical methods | Challenge | High | Raman Spectrometers |
| Dependence on imports for specialized applications | Challenge | Medium | UV-Vis Spectrometers |
Evaluation of Drivers in Japan Spectroscopy Equipment Market (2026–2032)
Key forces behind demand, with the segment each one moves most, are listed below.
| Drivers | Primary Segment Affected | Why It Matters (Evidence) |
| Increased investment in analytical technologies | Mass Spectrometers | Over 60% of chemical analysis labs in Japan rely on mass spectrometers for precise results. |
| Growing emphasis on quality control in food safety | FTIR Spectrometers | FTIR spectrometers are commonly used in food safety laboratories across Japan. |
| Expansion of research funding from government | Raman Spectrometers | The Japanese government allocated ¥5 billion for research in analytical technologies in 2023. |
| Rising demand from biotech and pharmaceutical sectors | UV-Vis Spectrometers | UV-Vis spectrometers are standard equipment in over 70% of university labs in Japan. |
| Increasing need for compliance with JIS standards | Mass Spectrometers | Chemical analysts rely heavily on spectroscopy for compliance with JIS standards. |
Behind the steady rise in orders sits increased investment in analytical technologies, with over 60% of chemical analysis labs in Japan relying on mass spectrometers for precise results. The emphasis on quality control in food safety has led to widespread adoption of FTIR spectrometers, commonly used in food safety laboratories. Research funding for analytical technologies reached ¥5 billion in 2023, driving demand further. The biotech and pharmaceutical sectors are expanding, with UV-Vis spectrometers becoming standard in many university labs. Compliance with JIS standards is increasingly important, as chemical analysts depend on spectroscopy for accurate results.
Evaluation of Restraints in Japan Spectroscopy Equipment Market
Several factors work against faster growth; the main ones are summarised below.
| Market Restraint | Primary Segment Affected | Why It Matters (Evidence) |
| High costs of advanced spectroscopy equipment | Mass Spectrometers | The average price of mass spectrometers can exceed ¥10 million, limiting purchases by smaller labs. |
| Limited awareness of emerging spectroscopy technologies | FTIR Spectrometers | Many firms are unaware of the benefits of newer FTIR models, hindering market growth. |
| Competition from alternative analytical methods | Raman Spectrometers | Emerging technologies may offer lower-cost solutions, impacting Raman spectrometer sales. |
| Dependence on imports for specialized applications | UV-Vis Spectrometers | Specialized UV-Vis models often require imports, leading to higher costs and delays. |
| Market saturation in certain segments | Mass Spectrometers | Many labs have already upgraded their equipment, slowing new purchases. |
Japan Spectroscopy Equipment Market Challenges
High labour costs challenge suppliers, as Japan's minimum wage reached JPY 1,055 per hour in October 2024. A shortage of skilled technicians delays production timelines, affecting delivery schedules for buyers in research labs. Supply chain disruptions for electronic components prolong lead times, impacting over 300 academic labs that require timely access to equipment. The need for substantial investment in advanced technology strains budgets for buyers, especially in food safety laboratories that must adhere to strict testing standards.
Trends in the Japan Spectroscopy Equipment Market
The trends below show where the Japan Spectroscopy Equipment Market is heading.
- Biotech Firms Increasingly Adopt Advanced Spectroscopy: Biotech firms in the Tokyo region are adopting advanced spectroscopy equipment, with over 300 academic research labs utilizing these technologies. This shift is expected to improve research capabilities.
- Growing Focus on Food Safety Testing: In 2023, the number of registered food safety laboratories reached 1,200 in Japan, reflecting a heightened focus on food safety. This trend drives demand for FTIR spectrometers commonly used in these labs.
- Shift Towards Automation in Analytical Labs: Analytical laboratories are transitioning towards automation, with many investing in automated UV-Vis spectrometers. This change improves efficiency and accuracy, particularly in university labs.
- Increased Focus on Environmental Monitoring: Environmental monitoring is becoming a priority in Japan's industrial sectors, with spectroscopy equipment playing an important role. The government supports this trend through various grants and programs.
Investment Opportunities in the Japan Spectroscopy Equipment Market
The opportunities below stand out in the Japan Spectroscopy Equipment Market for new entrants and existing suppliers.
- Tokyo Region as a Hub for Biotech: The Tokyo region is a central hub for biotech firms, with over 300 academic research labs. This presents an opportunity to supply advanced spectroscopy equipment to meet increasing research demands.
- Timing for Investment in Food Safety: With 1,200 registered food safety laboratories in 2023, there is a strong need for advanced analytical technologies. Suppliers can enter this market through partnerships with local food safety labs.
- Gap in Advanced Spectroscopy Equipment: The average price of advanced spectroscopy equipment can exceed ¥10 million, indicating a gap for cost-effective solutions. Suppliers can target smaller labs that require affordable options.
- Entry through Local Partnerships: Collaboration with local research institutions can facilitate entry into the Japanese market. Establishing joint ventures with academic labs can build credibility and expand market reach.
Government Initiatives in the Japan Spectroscopy Equipment Market
The Act on the Rational Use of Energy, established in 1979, mandates large energy users to improve energy efficiency and report usage. This law impacts producers by requiring them to invest in energy-efficient technologies, including spectroscopy equipment, to comply with regulations.
The Ministry of Health, Labour and Welfare oversees food safety testing protocols, ensuring that laboratories adhere to strict standards. This agency approves laboratories for compliance, influencing buyers to seek accredited facilities for reliable testing.
Future Insight of the Japan Spectroscopy Equipment Market
By 2032, advancements in analytical technology will reshape demand for spectroscopy equipment, particularly through the adoption of AI-driven testing methods. The implementation of ISO 17025 standards will improve accuracy in testing, benefiting both buyers and suppliers. Increased funding for spectroscopy research will drive innovation and expand equipment capabilities. Stricter food safety protocols will require more sophisticated analytical techniques, creating opportunities for suppliers to address evolving market needs.
Market Segmentation Analysis
Japan Spectroscopy Equipment Market report covers a detailed analysis of the following market segments:
By Equipment Type – Mass Spectrometers Lead, FTIR Spectrometers Expected to Grow Fastest
According to Saurav Kr Singh, Senior Research Analyst at 6Wresearch, Mass Spectrometers accounted for 37% of the market by equipment type in 2025. Mass spectrometers dominate the market as they are critical for precise molecular analysis in laboratories. For instance, over 60% of chemical analysis labs in Japan rely on mass spectrometers for accurate and reliable results. FTIR Spectrometers are projected to grow fastest, at a CAGR of 8.2% during 2026–2032. FTIR spectrometers are experiencing rapid growth due to their essential role in identifying organic compounds, particularly in food safety laboratories. The heightened focus on food safety regulations is significantly driving their adoption. Suppliers should focus on increasing the availability of FTIR spectrometers to meet the growing demand in food safety applications.
By Spectral Range – Mass-to-Charge Ratio Leads, Infrared Expected to Grow Fastest
The largest spectral range category in 2025 was Mass-to-Charge Ratio, at 49% of revenue. The mass-to-charge ratio is the leading spectral range, as it is fundamental to mass spectrometry, which is widely used in chemical analysis. This principle is crucial for accurately identifying and quantifying various substances across multiple industries. The quickest growth will come from Infrared, forecast to expand at a CAGR of 8.0% between 2026 and 2032. Infrared spectral range is witnessing the fastest growth because of its critical importance in molecular identification, especially within research and development sectors. The rise in research activities is significantly enhancing its demand. Buyers should consider investing in infrared technologies to stay competitive in molecular research and analysis.
By Detection Principle – Ion Detection Leads, Absorbance Expected to Grow Fastest
Ion Detection held 35% of the Japan Spectroscopy Equipment Market by detection principle in 2025. Ion detection is the primary detection principle, essential for mass spectrometry, ensuring accurate results in molecular analysis. This principle plays a vital role in numerous applications across the biotech and pharmaceutical industries. Absorbance is set to record the highest CAGR in this split, 7.9% over 2026–2032. Absorbance detection is rapidly gaining traction as it is fundamental to UV-Vis spectroscopy, which is extensively used in quality control processes. The increasing regulatory requirements for quality assurance are driving its adoption. Suppliers must enhance their product offerings in absorbance detection technologies to satisfy the growing quality control demands.
By End User – Biotech & Pharma Firms Lead, Chemical Analysts Expected to Grow Fastest
In 2025, Biotech & Pharma Firms led the end user split with a 47% share. Biotech and pharma firms constitute the largest end user segment, primarily due to their reliance on spectroscopy for drug development and testing. Their substantial investments in research and development drive the demand for advanced analytical equipment. Over 2026–2032, Chemical Analysts are expected to post the fastest growth, at a CAGR of 7.8%. Chemical analysts represent the fastest-growing end user group, as they increasingly employ spectroscopy for quality control across various industries. The heightened focus on compliance with industry standards is contributing to this growth. Suppliers should tailor their products to meet the specific needs of chemical analysts to capture this expanding market.
Key Attractiveness of the Report
- 10 Years of Market Numbers
- Historical Data Starting from 2022 to 2025
- Base Year 2025
- Forecast Data until 2032
- Key Performance Indicators Impacting the Market
- Major Upcoming Developments and Projects
Key Highlights of the Report:
- Japan Spectroscopy Equipment Market Outlook
- Market Size of Japan Spectroscopy Equipment Market, 2025
- Forecast of Japan Spectroscopy Equipment Market, 2032
- Historical Data and Forecast of Japan Spectroscopy Equipment Revenues & Volume for the Period 2022-2032F
- Japan Spectroscopy Equipment Market Trend Evolution
- Japan Spectroscopy Equipment Market Drivers and Challenges
- Japan Spectroscopy Equipment Price Trends
- Japan Spectroscopy Equipment Porter's Five Forces
- Japan Spectroscopy Equipment Industry Life Cycle
- Historical Data and Forecast of Japan Spectroscopy Equipment Market Revenues & Volume By Equipment Type for the Period 2022-2032F
- Historical Data and Forecast of Japan Spectroscopy Equipment Market Revenues & Volume By Mass Spectrometers for the Period 2022-2032F
- Historical Data and Forecast of Japan Spectroscopy Equipment Market Revenues & Volume By FTIR Spectrometers for the Period 2022-2032F
- Historical Data and Forecast of Japan Spectroscopy Equipment Market Revenues & Volume By Raman Spectrometers for the Period 2022-2032F
- Historical Data and Forecast of Japan Spectroscopy Equipment Market Revenues & Volume By UV-Vis Spectrometers for the Period 2022-2032F
- Historical Data and Forecast of Japan Spectroscopy Equipment Market Revenues & Volume By Spectral Range for the Period 2022-2032F
- Historical Data and Forecast of Japan Spectroscopy Equipment Market Revenues & Volume By Mass-to-Charge Ratio for the Period 2022-2032F
- Historical Data and Forecast of Japan Spectroscopy Equipment Market Revenues & Volume By Infrared for the Period 2022-2032F
- Historical Data and Forecast of Japan Spectroscopy Equipment Market Revenues & Volume By Laser Scattering for the Period 2022-2032F
- Historical Data and Forecast of Japan Spectroscopy Equipment Market Revenues & Volume By Ultraviolet-Visible for the Period 2022-2032F
- Historical Data and Forecast of Japan Spectroscopy Equipment Market Revenues & Volume By Detection Principle for the Period 2022-2032F
- Historical Data and Forecast of Japan Spectroscopy Equipment Market Revenues & Volume By Ion Detection for the Period 2022-2032F
- Historical Data and Forecast of Japan Spectroscopy Equipment Market Revenues & Volume By Absorbance for the Period 2022-2032F
- Historical Data and Forecast of Japan Spectroscopy Equipment Market Revenues & Volume By Molecular Identification for the Period 2022-2032F
- Historical Data and Forecast of Japan Spectroscopy Equipment Market Revenues & Volume By Light Absorption for the Period 2022-2032F
- Historical Data and Forecast of Japan Spectroscopy Equipment Market Revenues & Volume By End User for the Period 2022-2032F
- Historical Data and Forecast of Japan Spectroscopy Equipment Market Revenues & Volume By Biotech & Pharma Firms for the Period 2022-2032F
- Historical Data and Forecast of Japan Spectroscopy Equipment Market Revenues & Volume By Chemical Analysts for the Period 2022-2032F
- Historical Data and Forecast of Japan Spectroscopy Equipment Market Revenues & Volume By Academic Research Labs for the Period 2022-2032F
- Historical Data and Forecast of Japan Spectroscopy Equipment Market Revenues & Volume By Food Safety Laboratories for the Period 2022-2032F
- Japan Spectroscopy Equipment Import Export Trade Statistics
- Market Opportunity Assessment By Equipment Type
- Market Opportunity Assessment By Spectral Range
- Market Opportunity Assessment By Detection Principle
- Market Opportunity Assessment By End User
- Japan Spectroscopy Equipment Top Companies Market Share
- Japan Spectroscopy Equipment Competitive Benchmarking By Technical and Operational Parameters
- Japan Spectroscopy Equipment Company Profiles
- Japan Spectroscopy Equipment Key Strategic Recommendations
Market Covered
The report covers the following segments.
By Equipment Type
- Mass Spectrometers
- FTIR Spectrometers
- Raman Spectrometers
- UV-Vis Spectrometers
By Spectral Range
- Mass-to-Charge Ratio
- Infrared
- Laser Scattering
- Ultraviolet-Visible
By Detection Principle
- Ion Detection
- Absorbance
- Molecular Identification
- Light Absorption
By End User
- Biotech & Pharma Firms
- Chemical Analysts
- Academic Research Labs
- Food Safety Laboratories































