Japan Supply Chain Transparency Market Size & Growth Rate
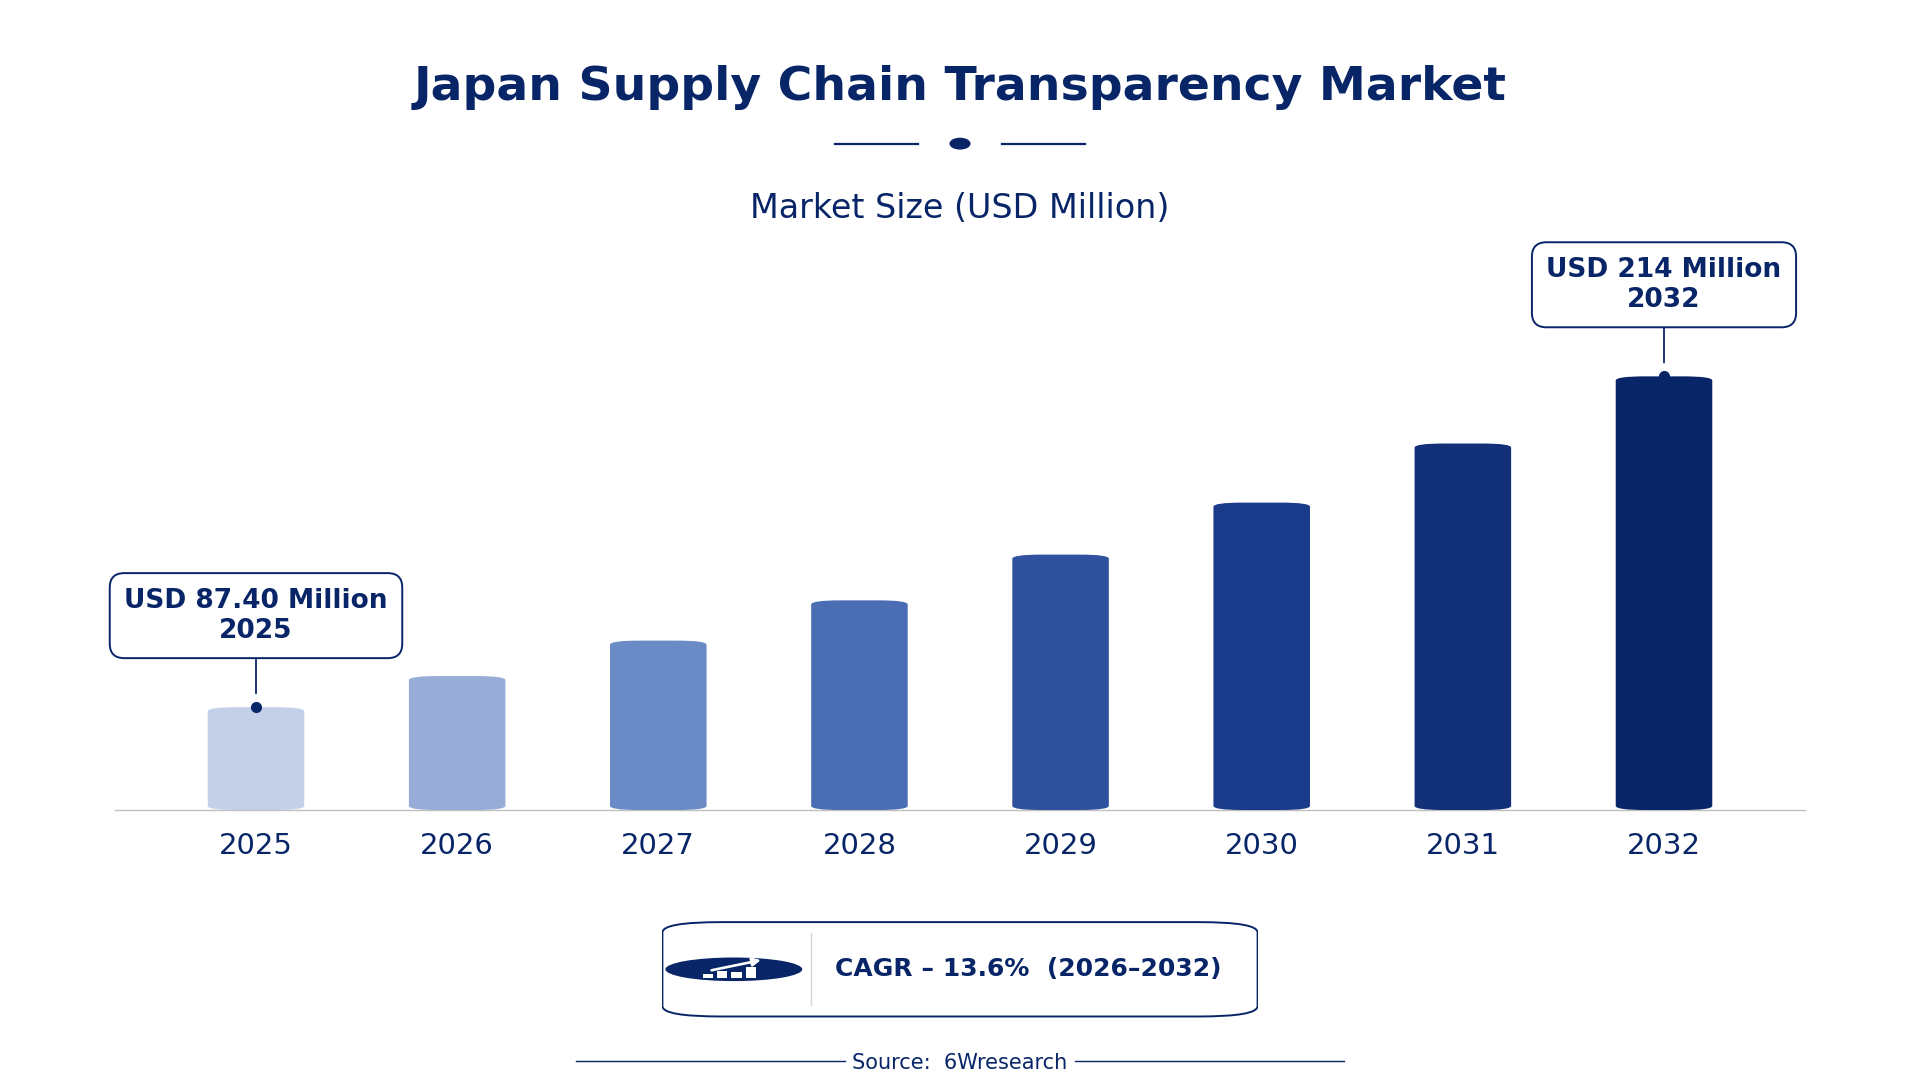
According to 6Wresearch internal database and industry insights, the Japan Supply Chain Transparency Market was valued at USD 87.40 Million in 2025 and is projected to reach USD 214 Million by 2032, growing at a CAGR of approximately 13.6% during 2026–2032.
Japan Supply Chain Transparency Market Highlights
| Report Metric | Details |
| Report Name | Japan Supply Chain Transparency Market (2026-2032) |
| Market Size 2025 | USD 87.40 Million |
| Market Size 2032 | USD 214 Million |
| Absolute Growth 2025–2032 | USD 126.60 Million |
| CAGR 2026–2032 | 13.6% |
| Peak Annual Growth | 20.1% in 2032 |
| Forecast Period | 2026–2032 |
| Historical Data | 2022–2025 |
| Base Year | 2025 |
| Leading Transparency Type, 2025 | End-to-End Traceability (38% share) |
| Leading Technology Used, 2025 | Blockchain (45% share) |
| Leading Focus Area, 2025 | Supplier Verification (53% share) |
| Leading End User, 2025 | Retail Chains (43% share) |
| Fastest-Growing Transparency Type | Real-Time Monitoring (19.2% CAGR) |
| Fastest-Growing Technology Used | IoT (16.1% CAGR) |
| Fastest-Growing Focus Area | Inventory Management (17.2% CAGR) |
| Fastest-Growing End User | Manufacturing Firms (17.7% CAGR) |
| Growing Sector | manufacturing |
| Key End Users | retail chains, manufacturing firms, consumer brands |
Japan Supply Chain Transparency Market Year-wise Growth Rate and Key Drivers (2022–2032)
This graph illustrates the annual growth rates of the market from 2022 to 2032, highlighting a steady upward trajectory and projected market expansion over the forecast period.
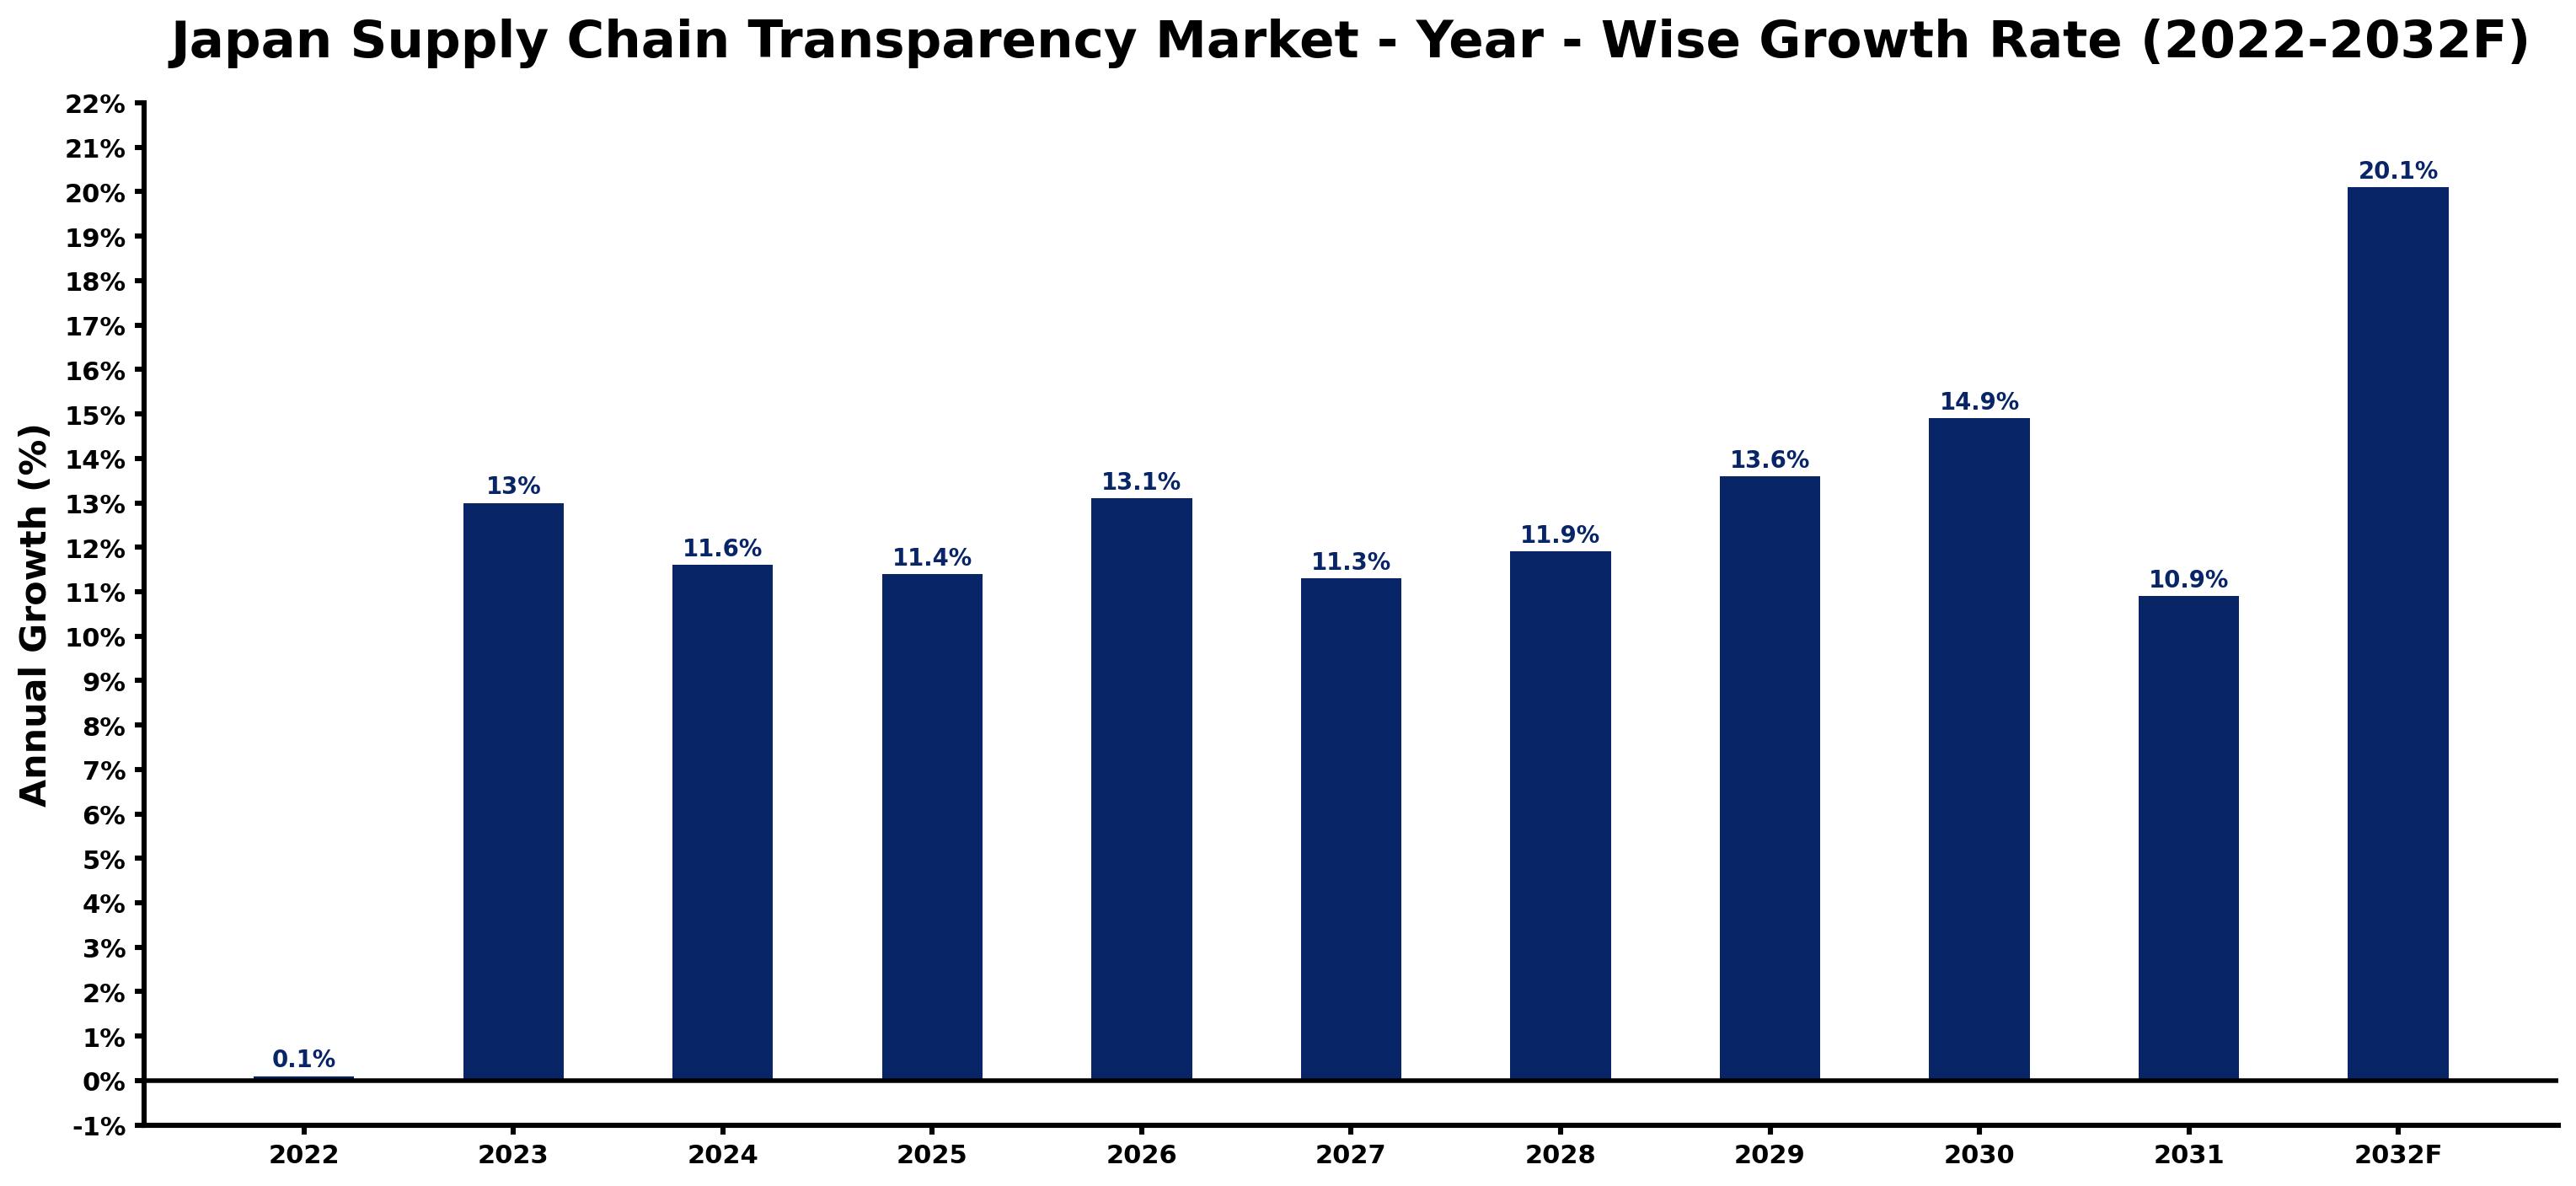
The yearly estimates that follow link every growth rate to its principal driver, so readers can see why the pace changed in each period.
| Year | Estimated Annual Growth (%) | Market Rationale |
| 2022 | 0.1 | The market exhibited minimal growth, reflecting initial adoption of transparency technologies. |
| 2023 | 13.0 | Growth accelerated due to increased investments in supply chain transparency technologies. |
| 2024 | 11.6 | A slowdown occurred as firms adjusted to new technologies and standards. |
| 2025 | 11.4 | Growth continued to slow slightly as companies focused on integration and compliance. |
| 2026 | 13.1 | An uptick in growth is expected to be driven by renewed interest in real-time monitoring solutions. |
| 2027 | 11.3 | The market is projected to experience a slowdown as firms consolidate their transparency efforts. |
| 2028 | 11.9 | Growth is expected to pick up again, supported by advancements in IoT applications. |
| 2029 | 13.6 | Demand is projected to surge as manufacturing firms expand their transparency initiatives. |
| 2030 | 14.9 | Growth is expected to continue rising, driven by the increasing importance of compliance visibility. |
| 2031 | 10.9 | A slowdown is anticipated as the market matures and competition intensifies. |
| 2032 | 20.1 | The market is projected to peak with substantial investments in blockchain and AI technologies. |
Note: Market size estimations and growth projections presented in this report are based on 6Wresearch's proprietary forecasting methodology, utilizing the latest available industry data, government publications, and primary research inputs.
Japan Supply Chain Transparency Market Synopsis
Supply Chain Transparency encompasses technologies and practices that ensure visibility and accountability throughout the supply chain, primarily through blockchain, IoT, and AI analytics. The Japan Supply Chain Transparency Market is growing as the retail sector plans to invest 1.5 billion JPY in transparency technologies by 2025, driven by compliance requirements and international standards. Initiatives like the Supply Chain Innovation Program are further stimulating demand for transparency solutions.
Market Dynamics Impact Analysis (2026–2032)
| Factor | Type | Impact | Primary Segment Affected |
| Increased investment in transparency technologies | Driver | High | Real-Time Monitoring |
| Growing regulatory compliance requirements | Driver | High | Compliance Visibility |
| Emerging demand for sustainable practices | Opportunity | Medium | Sustainability Reporting |
| Expansion of blockchain applications in supply chains | Opportunity | High | Blockchain |
| High costs associated with technology implementation | Restraint | High | End-to-End Traceability |
| Limited awareness among smaller firms | Restraint | Medium | Supplier Verification |
| Competition from established players in technology | Challenge | High | Inventory Management |
| Rapid technological changes requiring constant adaptation | Challenge | Medium | AI Analytics |
Evaluation of Drivers in Japan Supply Chain Transparency Market (2026–2032)
Below are the drivers that matter most for revenue growth, with supporting evidence.
| Drivers | Primary Segment Affected | Why It Matters (Evidence) |
| Investment in real-time monitoring solutions | Real-Time Monitoring | Japan's manufacturing sector reported a 70% adoption of such solutions, improving decision-making. |
| Regulatory compliance mandates | Compliance Visibility | The Economic Security Promotion Act requires firms to meet strict transparency standards, driving purchases of compliance visibility tools. |
| Increased focus on sustainability | Sustainability Reporting | Over 60% of consumer brands prioritise ESG transparency, driving demand for reporting solutions. |
| Adoption of blockchain technology | Blockchain | The Japan Blockchain Association promotes its use, ensuring secure and transparent data management. |
| Growth in digital transformation initiatives | IoT | The government allocated 500 million JPY for enhancing digital capabilities in supply chains. |
Much of the new demand traces back to Japan's manufacturing sector, which reported a 70% adoption of real-time monitoring solutions, improving decision-making and inventory management. A strong focus on sustainability is evident, as over 60% of consumer brands prioritise ESG transparency, prompting investments in sustainability reporting.
Evaluation of Restraints in Japan Supply Chain Transparency Market
The main factors holding the market back are set out below.
| Market Restraint | Primary Segment Affected | Why It Matters (Evidence) |
| High costs associated with implementing transparency technologies | End-to-End Traceability | Investment in new technologies can be prohibitive, especially for smaller firms with limited budgets. |
| Limited awareness among smaller firms about transparency benefits | Supplier Verification | Many smaller firms lack the knowledge to implement effective transparency measures, hindering adoption. |
| Competition from established technology providers | Inventory Management | Established players dominate the market, making it challenging for new entrants to gain traction. |
| Rapid technological changes requiring constant adaptation | AI Analytics | Firms struggle to keep up with evolving technologies, which can delay implementation. |
| Complexity of integrating multiple systems | Blockchain | Integrating blockchain with existing systems can be technically challenging and resource-intensive. |
Japan Supply Chain Transparency Market Challenges
Retail buyers encounter high costs due to inconsistent supply chain transparency, which can raise operational expenses by up to 15%. Many suppliers face delays since only 70% of manufacturers have adopted real-time monitoring solutions, affecting their ability to fulfil orders promptly. Technology integration poses challenges, as limited adoption of advanced solutions restricts suppliers' competitiveness. Competition intensifies with over 60% of consumer brands prioritising ESG transparency, compelling suppliers to allocate up to 20% of their operational budget to compliance measures, which can strain their resources.
Trends in the Japan Supply Chain Transparency Market
Buyers and suppliers in the Japan Supply Chain Transparency Market are adjusting to the following trends.
- Shift towards Real-Time Monitoring Solutions: Tokyo is experiencing a notable shift towards real-time monitoring solutions, with 70% of manufacturers adopting such technologies in 2022. This trend improves decision-making and inventory management across sectors.
- Emergence of Blockchain in Supply Chains: The launch of the Supply Chain Innovation Program in 2023 promotes blockchain adoption among firms, with 45% of companies already utilising it. This shift ensures secure and transparent data management.
- Focus on ESG Transparency: The Supply Chain Innovation Program, established in 2023, encourages firms to prioritise ESG transparency. Over 60% of consumer brands are now focusing on sustainability reporting to improve their corporate image.
- Increased Investment in Digital Transformation: The government allocated 500 million JPY in 2023 for digital transformation in supply chains, prompting firms to invest in transparency technologies and improve operational efficiency.
Investment Opportunities in the Japan Supply Chain Transparency Market
Investors looking at the Japan Supply Chain Transparency Market should consider the following areas.
- Investment in Real-Time Monitoring Technologies: Tokyo's manufacturing sector shows a gap in real-time monitoring solutions, with 70% adoption. Investing in these technologies can improve decision-making for firms seeking efficiency.
- Supply Chain Blockchain Solutions: With 45% of firms adopting blockchain, there is an opportunity to supply blockchain solutions. Collaborating with the Japan Blockchain Association can facilitate market entry.
- Sustainability Reporting Services: As over 60% of consumer brands prioritise ESG transparency, there is a growing demand for sustainability reporting services. Targeting retail chains can yield substantial opportunities.
- Supplier Verification Technologies: The need for supplier verification is rising, especially among retail chains. Investing in verification technologies can help firms ensure compliance and reliability.
Government Initiatives in the Japan Supply Chain Transparency Market
The Supply Chain Innovation Program, launched by the Ministry of Economy, Trade and Industry in 2023, enhances existing frameworks by providing guidelines for transparency practices and funding opportunities. This initiative builds on the Economic Security Promotion Act of 2022, which supports supply-chain resilience for critical products. Together, these measures aim to improve transparency in supply chains, ensuring compliance with international standards and enhancing overall operational efficiency for producers and buyers alike.
In 2023, the government allocated 500 million JPY for digital transformation initiatives within supply chains, administered by the Digital Agency. This funding is designed to support businesses in implementing advanced technologies, improving supply chain visibility, and ensuring compliance with regulations. The allocation reflects a commitment to driving innovation and improving the competitiveness of Japanese firms in the global market.
Future Insight of the Japan Supply Chain Transparency Market
By 2032, a shift driven by government initiatives will prompt suppliers to embrace technologies such as IoT for improved visibility. The Ministry of Economy, Trade and Industry's Supply Chain Innovation Program will facilitate this transition, allowing buyers to benefit from enhanced data access for decision-making. As ISO 28000 becomes more widely adopted, firms will align with international standards, building trust across the supply chain. The Tokyo Metropolitan Government's target to increase transparency by 30% will further streamline operations for both buyers and suppliers.
Market Segmentation Analysis
Japan Supply Chain Transparency Market report covers a detailed analysis of the following market segments:
By Transparency Type – End-to-End Traceability Leads, Real-Time Monitoring Expected to Grow Fastest
According to Saurav Kr Singh, Senior Research Analyst at 6Wresearch, End-to-End Traceability took 38% of transparency type revenue in 2025, more than any other category. End-to-End Traceability holds the largest share as it is essential for tracking product origins and movements, particularly in sectors like retail where consumer trust is paramount. The 'Supply Chain Innovation Program' launched by the Ministry of Economy, Trade and Industry in 2023 has further solidified its importance. Real-Time Monitoring is projected to grow fastest, at a CAGR of 19.2% during 2026–2032. Real-Time Monitoring is experiencing rapid growth due to its necessity for timely decision-making and inventory management, especially as 70% of the manufacturing sector reported adopting such solutions in 2022. This trend indicates that as businesses seek to optimise operations, the demand for real-time data will continue to rise. Suppliers must prioritise the development of end-to-end traceability solutions to meet the increasing demands of the retail sector.
By Technology Used – Blockchain Leads, IoT Expected to Grow Fastest
Blockchain held 45% of the Japan Supply Chain Transparency Market by technology used in 2025. Blockchain technology holds the largest share as it is crucial for secure and immutable data management, essential for maintaining trust in supply chains. Its widespread adoption is evidenced by the support from the Japan Blockchain Association, which has been promoting its use since 2021. The quickest growth will come from IoT, forecast to expand at a CAGR of 16.1% between 2026 and 2032. IoT is experiencing rapid growth due to its integral role in real-time data collection and monitoring, increasingly vital for operational efficiency. The government's allocation of 500 million JPY for digital transformation in 2023 will further accelerate its adoption across various sectors. Suppliers should prioritise the integration of IoT solutions to remain competitive and meet the evolving demands of the market.
By Focus Area – Supplier Verification Leads, Inventory Management Expected to Grow Fastest
With 53% of focus area revenue in 2025, Supplier Verification was the largest category. Supplier Verification leads the market as it is key for ensuring supplier compliance and reliability, which is critical for maintaining quality standards in supply chains. The emphasis on compliance is underscored by the adoption of ISO 28000 by many firms in Japan. Inventory Management is set to record the highest CAGR in this split, 17.2% over 2026–2032. Inventory Management is the fastest-growing focus area as it is vital for maintaining stock levels and reducing waste, particularly in the manufacturing sector. The need for efficiency drives firms to adopt advanced inventory management practices, leading to increased growth in this area. Buyers will benefit from prioritising suppliers that excel in inventory management to ensure operational efficiency.
By End User – Retail Chains Lead, Manufacturing Firms Expected to Grow Fastest
In 2025, Retail Chains led the end user split with a 43% share. Retail Chains dominate the end-user segment as they require transparency to build consumer trust and comply with regulatory standards. The projected investment of 1.5 billion JPY by this sector by 2025 underscores their commitment to enhancing supply chain transparency. Over 2026–2032, Manufacturing Firms are expected to post the fastest growth, at a CAGR of 17.7%. Manufacturing Firms are the fastest-growing end-user segment, driven by their need for transparency to improve supply chain efficiency. With 70% of these firms adopting real-time monitoring solutions, their demand for transparency technologies is expected to rise significantly. Suppliers should customise their offerings to address the specific requirements of manufacturing firms to capitalise on this expanding market.
Key Attractiveness of the Report
- 10 Years of Market Numbers
- Historical Data Starting from 2022 to 2025
- Base Year 2025
- Forecast Data until 2032
- Key Performance Indicators Impacting the Market
- Major Upcoming Developments and Projects
Key Highlights of the Report:
- Japan Supply Chain Transparency Market Outlook
- Market Size of Japan Supply Chain Transparency Market, 2025
- Forecast of Japan Supply Chain Transparency Market, 2032
- Historical Data and Forecast of Japan Supply Chain Transparency Revenues & Volume for the Period 2022-2032F
- Japan Supply Chain Transparency Market Trend Evolution
- Japan Supply Chain Transparency Market Drivers and Challenges
- Japan Supply Chain Transparency Price Trends
- Japan Supply Chain Transparency Porter's Five Forces
- Japan Supply Chain Transparency Industry Life Cycle
- Historical Data and Forecast of Japan Supply Chain Transparency Market Revenues & Volume By Transparency Type for the Period 2022-2032F
- Historical Data and Forecast of Japan Supply Chain Transparency Market Revenues & Volume By End-to-End Traceability for the Period 2022-2032F
- Historical Data and Forecast of Japan Supply Chain Transparency Market Revenues & Volume By Real-Time Monitoring for the Period 2022-2032F
- Historical Data and Forecast of Japan Supply Chain Transparency Market Revenues & Volume By ESG Transparency for the Period 2022-2032F
- Historical Data and Forecast of Japan Supply Chain Transparency Market Revenues & Volume By Compliance Visibility for the Period 2022-2032F
- Historical Data and Forecast of Japan Supply Chain Transparency Market Revenues & Volume By Technology Used for the Period 2022-2032F
- Historical Data and Forecast of Japan Supply Chain Transparency Market Revenues & Volume By Blockchain for the Period 2022-2032F
- Historical Data and Forecast of Japan Supply Chain Transparency Market Revenues & Volume By IoT for the Period 2022-2032F
- Historical Data and Forecast of Japan Supply Chain Transparency Market Revenues & Volume By AI Analytics for the Period 2022-2032F
- Historical Data and Forecast of Japan Supply Chain Transparency Market Revenues & Volume By Cloud Software for the Period 2022-2032F
- Historical Data and Forecast of Japan Supply Chain Transparency Market Revenues & Volume By Focus Area for the Period 2022-2032F
- Historical Data and Forecast of Japan Supply Chain Transparency Market Revenues & Volume By Supplier Verification for the Period 2022-2032F
- Historical Data and Forecast of Japan Supply Chain Transparency Market Revenues & Volume By Inventory Management for the Period 2022-2032F
- Historical Data and Forecast of Japan Supply Chain Transparency Market Revenues & Volume By Sustainability Reporting for the Period 2022-2032F
- Historical Data and Forecast of Japan Supply Chain Transparency Market Revenues & Volume By Regulatory Audits for the Period 2022-2032F
- Historical Data and Forecast of Japan Supply Chain Transparency Market Revenues & Volume By End User for the Period 2022-2032F
- Historical Data and Forecast of Japan Supply Chain Transparency Market Revenues & Volume By Retail Chains for the Period 2022-2032F
- Historical Data and Forecast of Japan Supply Chain Transparency Market Revenues & Volume By Manufacturing Firms for the Period 2022-2032F
- Historical Data and Forecast of Japan Supply Chain Transparency Market Revenues & Volume By Consumer Brands for the Period 2022-2032F
- Historical Data and Forecast of Japan Supply Chain Transparency Market Revenues & Volume By Global Enterprises for the Period 2022-2032F
- Japan Supply Chain Transparency Import Export Trade Statistics
- Market Opportunity Assessment By Transparency Type
- Market Opportunity Assessment By Technology Used
- Market Opportunity Assessment By Focus Area
- Market Opportunity Assessment By End User
- Japan Supply Chain Transparency Top Companies Market Share
- Japan Supply Chain Transparency Competitive Benchmarking By Technical and Operational Parameters
- Japan Supply Chain Transparency Company Profiles
- Japan Supply Chain Transparency Key Strategic Recommendations
Market Covered
Coverage by segment is as follows.
By Transparency Type
- End-to-End Traceability
- Real-Time Monitoring
- ESG Transparency
- Compliance Visibility
By Technology Used
- Blockchain
- IoT
- AI Analytics
- Cloud Software
By Focus Area
- Supplier Verification
- Inventory Management
- Sustainability Reporting
- Regulatory Audits
By End User
- Retail Chains
- Manufacturing Firms
- Consumer Brands
- Global Enterprises































