Japan Transportation-as-a-Service Market Size & Growth Rate
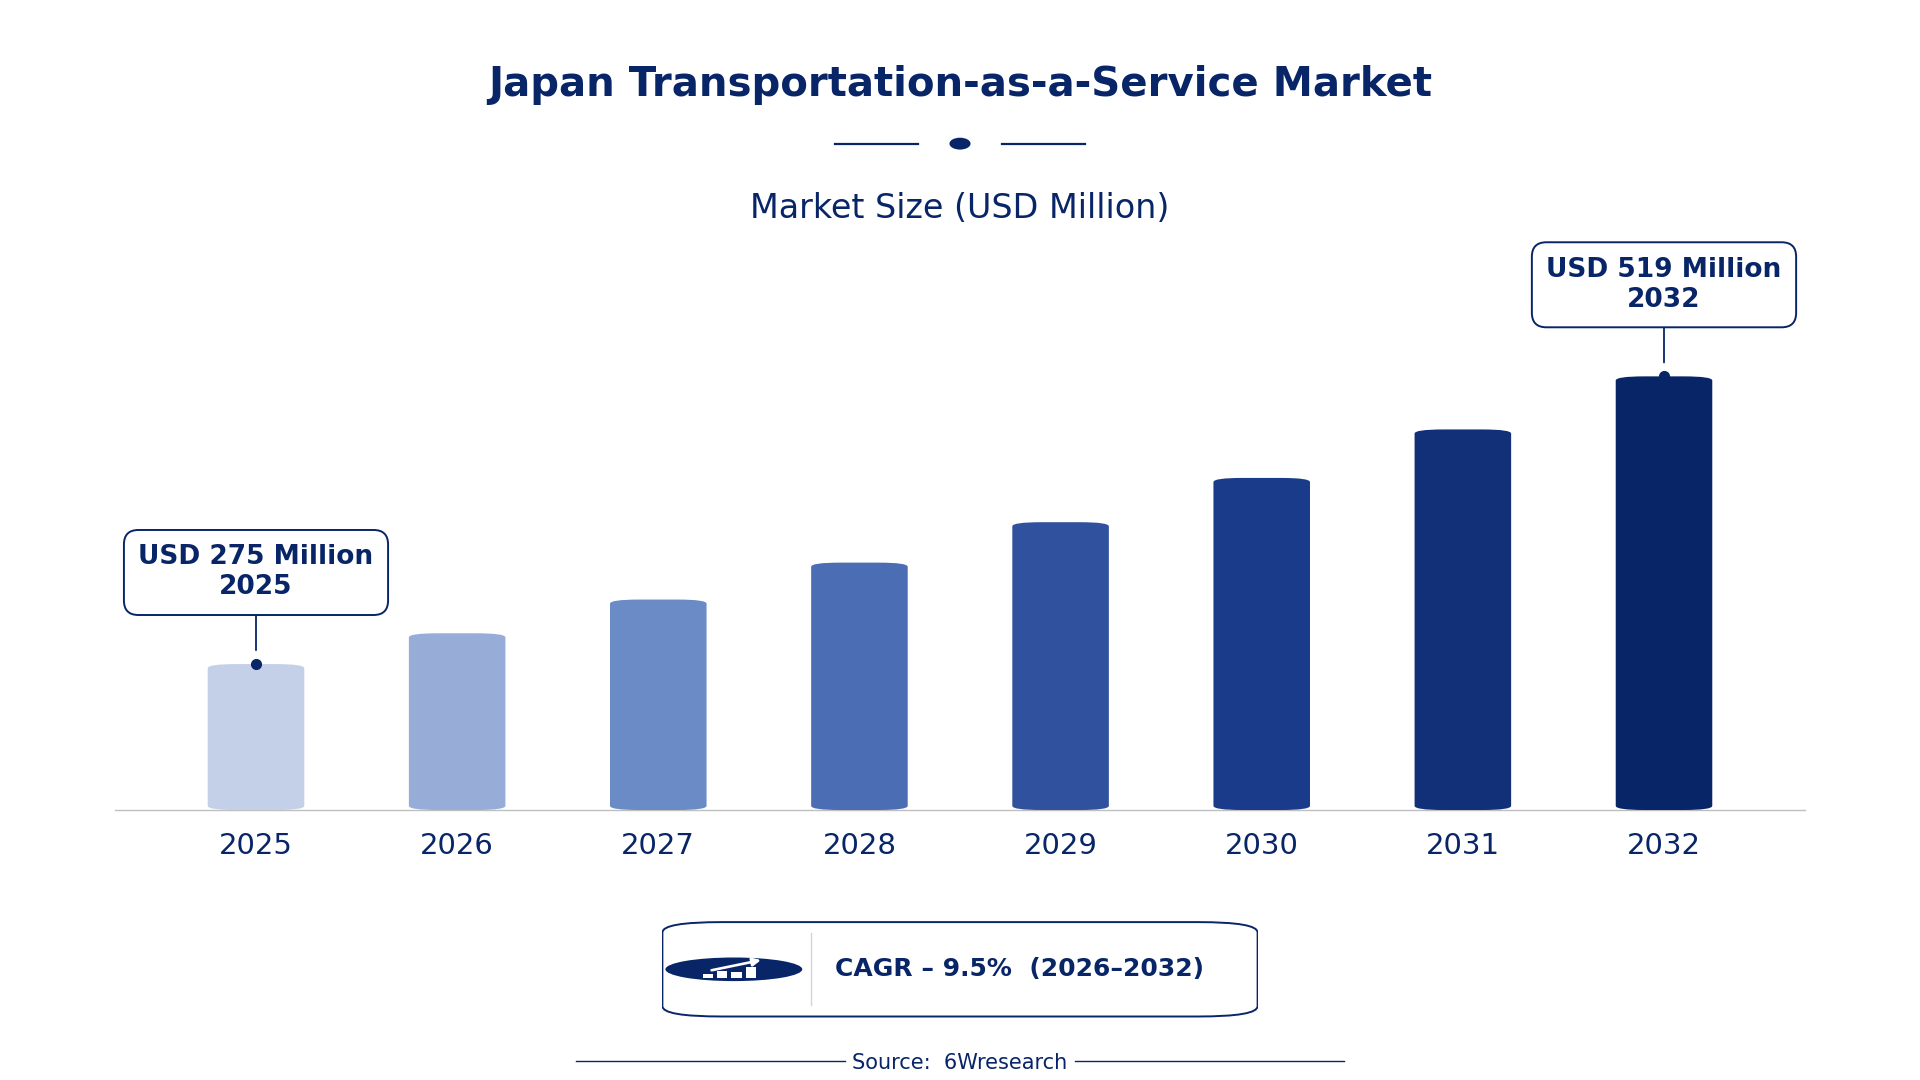
According to 6Wresearch internal database and industry insights, the Japan Transportation-as-a-Service Market was valued at USD 275 Million in 2025 and is projected to reach USD 519 Million by 2032, growing at a CAGR of approximately 9.5% during 2026–2032.
Japan Transportation-as-a-Service Market Highlights
| Report Metric | Details |
| Report Name | Japan Transportation-as-a-Service Market (2026-2032) |
| Market Size 2025 | USD 275 Million |
| Market Size 2032 | USD 519 Million |
| Absolute Growth 2025–2032 | USD 244 Million |
| CAGR 2026–2032 | 9.5% |
| Peak Annual Growth | 10.6% in 2028 |
| Forecast Period | 2026–2032 |
| Historical Data | 2022–2025 |
| Base Year | 2025 |
| Leading Service Type, 2025 | Ride Hailing (46% share) |
| Leading Vehicle Type, 2025 | Cars/SUVs (45% share) |
| Leading User Model, 2025 | Subscription/On-Demand (38% share) |
| Leading End User, 2025 | Urban Commuters (46% share) |
| Fastest-Growing Service Type | Micro-Mobility Services (12.5% CAGR) |
| Fastest-Growing Vehicle Type | eScooters/eBikes (13.4% CAGR) |
| Fastest-Growing End User | Students/Professionals (12.2% CAGR) |
| Growing Sector | Urban Mobility |
| Key End Users | Urban Commuters, Students/Professionals, City Residents |
Japan Transportation-as-a-Service Market Year-wise Growth Rate and Key Drivers (2022–2032)
This graph illustrates the annual growth rates of the market from 2022 to 2032, highlighting a steady upward trajectory and projected market expansion over the forecast period.
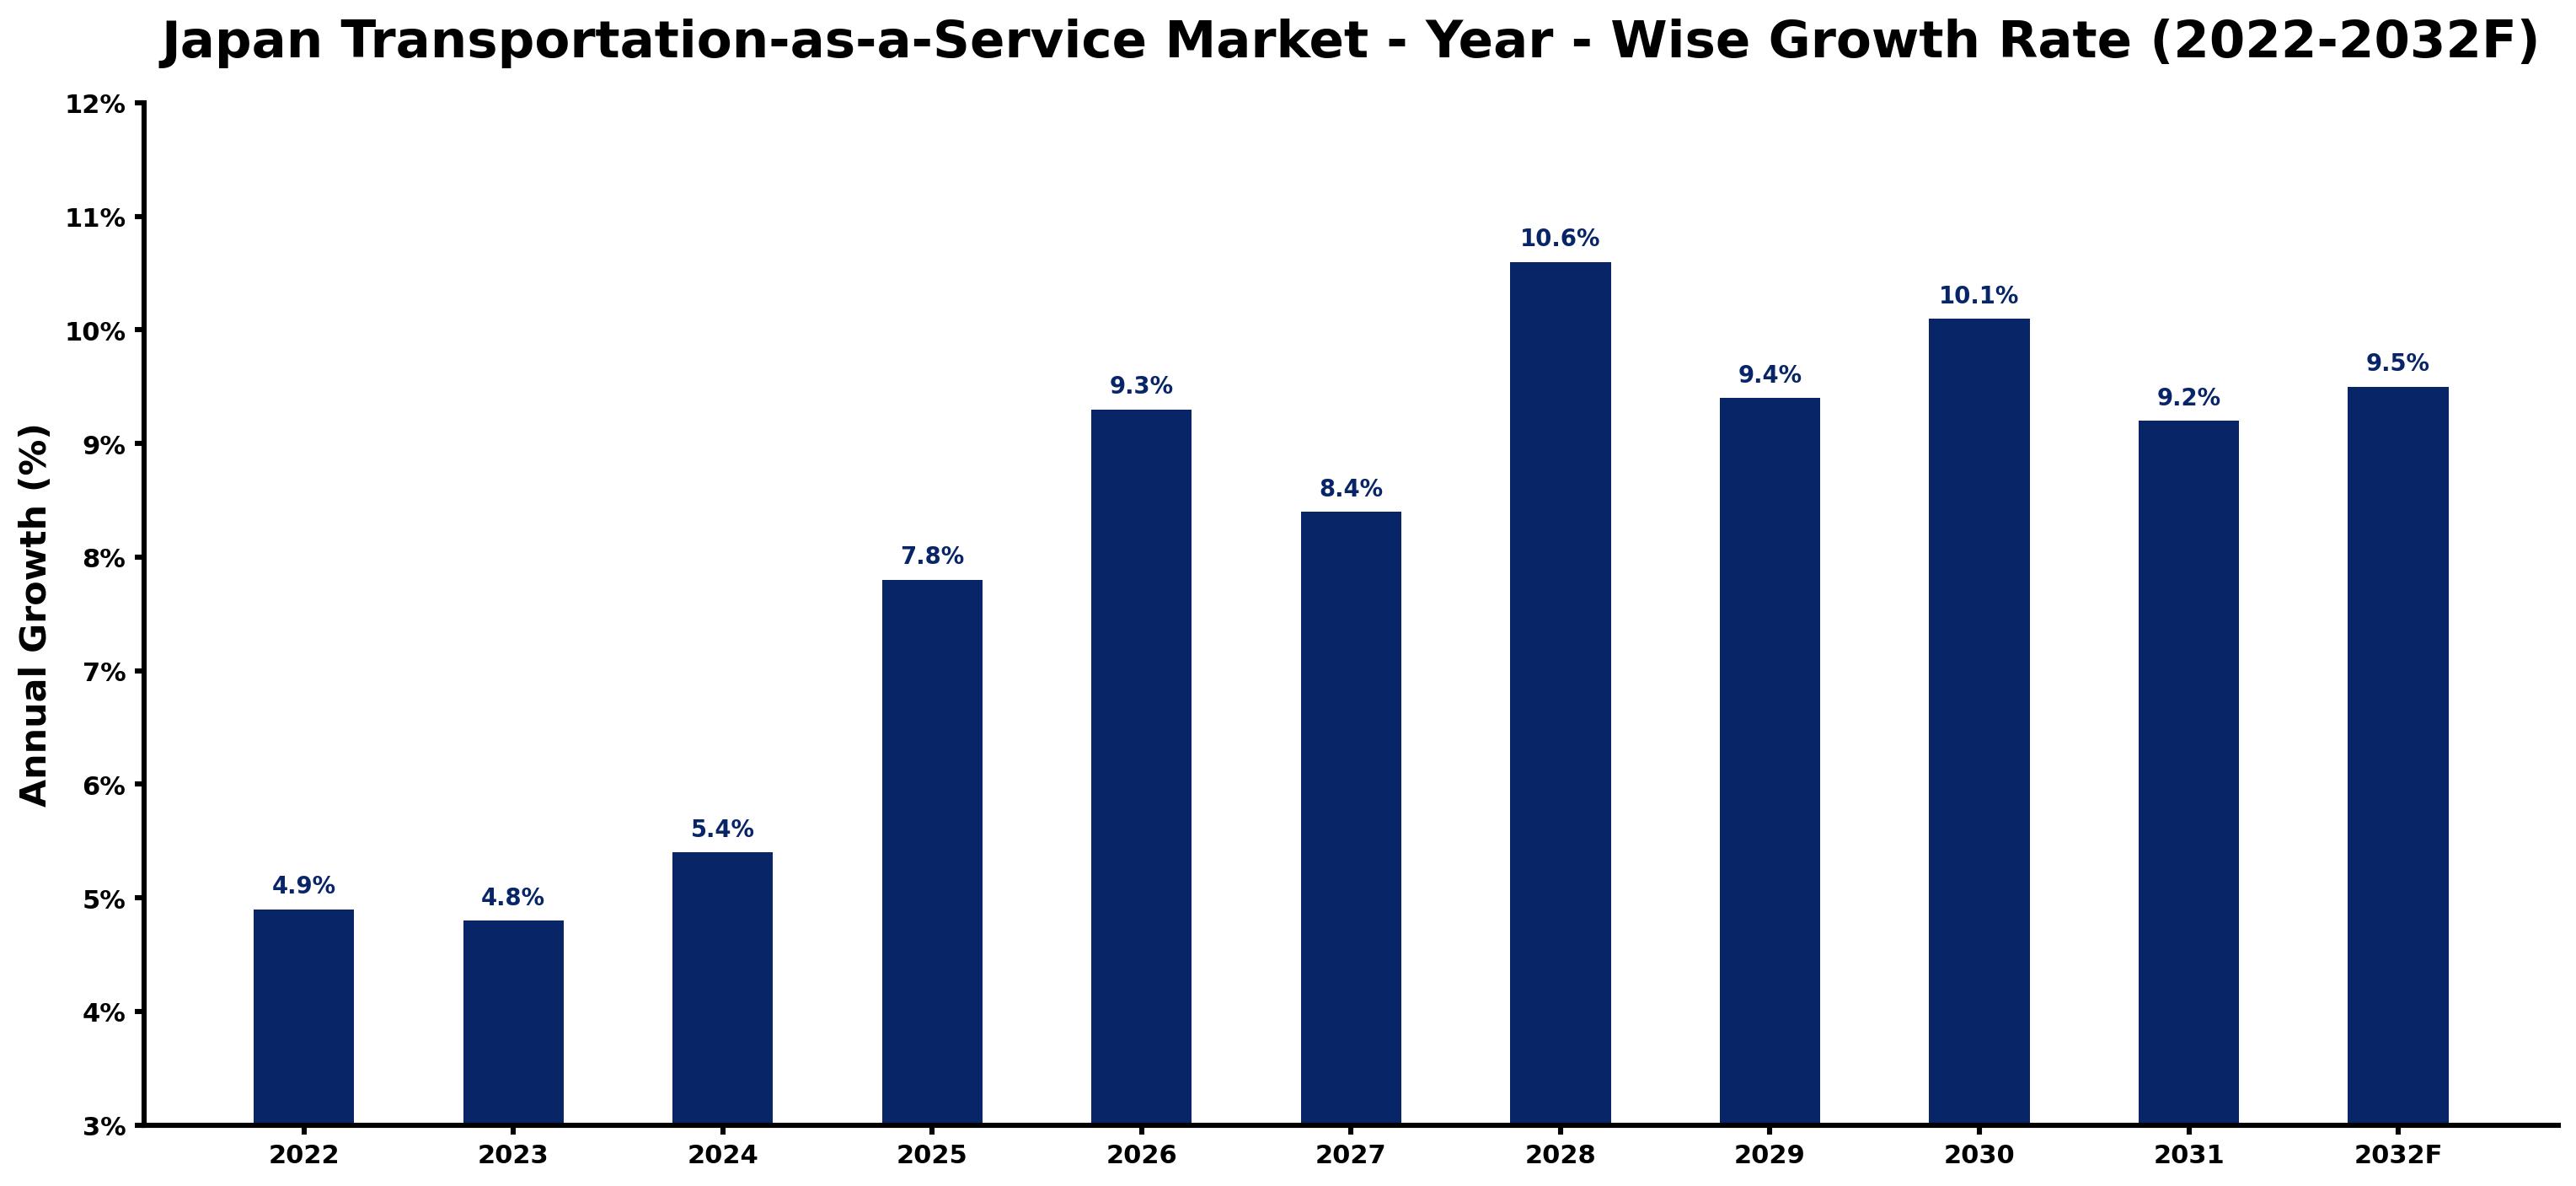
Each row of the following table gives one year's estimated growth and the event or demand shift that explains it.
| Year | Estimated Annual Growth (%) | Market Rationale |
| 2022 | 4.9 | The market experienced steady growth as urban populations continued to rise. |
| 2023 | 4.8 | Growth slowed slightly due to increased competition among service providers. |
| 2024 | 5.4 | Demand picked up as new micro-mobility options became available. |
| 2025 | 7.8 | Growth accelerated with the introduction of innovative ride-hailing services. |
| 2026 | 9.3 | Investment in digital platforms drove faster adoption of TaaS solutions. |
| 2027 | 8.4 | Growth slowed as market saturation began to affect new user acquisition. |
| 2028 | 10.6 | The peak growth year saw a surge in eco-friendly transport initiatives. |
| 2029 | 9.4 | Growth decelerated as regulatory challenges emerged for new entrants. |
| 2030 | 10.1 | Demand rose as urban commuters increasingly sought sustainable options. |
| 2031 | 9.2 | Growth slowed due to rising operational costs impacting service providers. |
| 2032 | 9.5 | The market rebounded with new investments in technology and infrastructure. |
Note: Market size estimations and growth projections presented in this report are based on 6Wresearch's proprietary forecasting methodology, utilizing the latest available industry data, government publications, and primary research inputs.
Japan Transportation-as-a-Service Market Synopsis
Transportation-as-a-Service (TaaS) offers on-demand solutions through digital platforms, including ride-hailing, car-sharing, and micro-mobility options. In Japan, the market is expanding as urban commuters seek efficient transport alternatives, with a population of approximately 92 million in urban areas. The launch of the Smart Mobility Strategy in 2023 and the rise of micro-mobility services are driving new demand, positioning TaaS as a key component of urban transport solutions.
Market Dynamics Impact Analysis (2026–2032)
| Factor | Type | Impact | Primary Segment Affected |
| Urban population growth fuels demand for efficient transport solutions. | Driver | High | Ride Hailing |
| Investment in micro-mobility options creates new service opportunities. | Driver | High | Micro-Mobility Services |
| Increasing urbanisation leads to higher demand for flexible transport. | Opportunity | High | Car Sharing |
| Rising interest in eco-friendly transport solutions opens new markets. | Opportunity | Medium | eScooters/eBikes |
| Regulatory hurdles limit the expansion of new TaaS providers. | Restraint | High | Ride Hailing |
| High operational costs constrain profitability for service operators. | Restraint | Medium | Car Sharing |
| Limited infrastructure for micro-mobility affects service reliability. | Challenge | High | Micro-Mobility Services |
| Competition among providers leads to price wars and reduced margins. | Challenge | Medium | Ride Hailing |
Evaluation of Drivers in Japan Transportation-as-a-Service Market (2026–2032)
Demand rests on the following drivers, each shown with the segment it touches most.
| Drivers | Primary Segment Affected | Why It Matters (Evidence) |
| Urban population growth drives demand for TaaS solutions. | Ride Hailing | With over 9 million registered vehicles in Tokyo, urban commuters seek alternatives. |
| Investment in digital platforms boosts service accessibility. | Micro-Mobility Services | The number of TaaS apps has increased by 30% since 2020, expanding options. |
| Rising environmental awareness boosts demand for eco-friendly transport. | eScooters/eBikes | Government initiatives promote green transport solutions to reduce carbon emissions. |
| Increased commute times push users towards convenient transport options. | Car Sharing | The average commute time in Tokyo exceeds 30 minutes, driving TaaS adoption. |
| Technological advancements improve service efficiency and user experience. | Subscription/On-Demand | New applications attract more urban commuters, improving user engagement. |
What keeps demand rising is urban population growth, with around 92 million residents in urban areas creating a need for efficient transport solutions. The average commute time in Tokyo exceeds 30 minutes, prompting users to seek convenient options like ride-hailing and car-sharing. Investment in digital platforms has resulted in a 30% increase in TaaS apps since 2020, improving accessibility for users. The promotion of eco-friendly transport solutions supports the adoption of e-scooters and other micro-mobility services, further expanding the market. Consequently, urban commuters increasingly rely on TaaS for their daily travel needs.
Evaluation of Restraints in Japan Transportation-as-a-Service Market
Below are the constraints most often cited by buyers and suppliers, with the segment each affects.
| Market Restraint | Primary Segment Affected | Why It Matters (Evidence) |
| Regulatory challenges hinder the entry of new TaaS providers. | Ride Hailing | Ride-hailing services must comply with regulations that limit flexibility. |
| High operational costs impact service providers' profitability. | Car Sharing | The average monthly cost for ride-hailing in Tokyo is approximately ¥15,000, affecting pricing strategies. |
| Limited infrastructure for micro-mobility affects service reliability. | Micro-Mobility Services | Insufficient charging and parking facilities challenge the growing demand for last-mile connectivity. |
| Market saturation slows new user acquisition for existing services. | Subscription/On-Demand | As competition increases, attracting new users becomes more challenging for providers. |
| Consumer preferences shift towards ownership, limiting TaaS growth. | Vehicle Leasing | The average age of cars in Japan is 10.4 years, influencing leasing trends. |
Japan Transportation-as-a-Service Market Challenges
Regulatory hurdles hinder producers' innovation in TaaS, as the Ministry of Land, Infrastructure, Transport and Tourism enforces strict guidelines that can delay new service launches by several months. Competition is fierce among over 200 car-sharing services, leading to price wars that squeeze profit margins for providers and may compromise service quality. High operational costs impact buyers, with the average monthly ride-hailing cost in Tokyo at approximately ¥15,000, making TaaS less affordable for many urban commuters. A shortage of skilled workers in technology limits suppliers' capacity to implement advanced solutions, which can reduce user satisfaction and retention rates.
Trends in the Japan Transportation-as-a-Service Market
Below are the shifts with the largest effect on the Japan Transportation-as-a-Service Market.
- Shift from Ownership to Shared Mobility: Since 2022, Japanese consumers are increasingly favouring shared mobility solutions over personal vehicle ownership. With over 200 car-sharing services operating, this shift reflects changing attitudes towards transportation in urban areas.
- Rise of Eco-Friendly Transport Solutions: In 2023, the government launched the Green Mobility Program, promoting sustainable transport options. This initiative encourages the adoption of e-scooters and other eco-friendly services, with 1.5 million registered e-scooters in Japan.
- Transition from Traditional to App-Based Services: The number of TaaS apps available in Japan has increased by 30% since 2020, reflecting a shift towards digital platforms. Urban commuters are now more inclined to use app-based services for convenience.
- Emergence of Micro-Mobility Services: Micro-mobility services gained traction in urban areas like Osaka and Yokohama, with a growing demand for last-mile connectivity. This trend is supported by the increasing number of e-scooters, which reached 1.5 million in 2022.
Investment Opportunities in the Japan Transportation-as-a-Service Market
Several openings in the Japan Transportation-as-a-Service Market merit attention from investors.
- Urban Commuters Seeking Flexible Transport: With a growing urban population of approximately 92 million, there is an opportunity to supply flexible TaaS solutions. Urban commuters are increasingly looking for alternatives to traditional transport methods.
- Increasing Demand for Eco-Friendly Options: The government's push for carbon neutrality by 2030 creates a need for sustainable transport solutions. This is an ideal time to invest in e-scooters and other green alternatives.
- Expansion of Micro-Mobility Services: As micro-mobility services gain popularity, there is an opportunity to supply e-scooters and related infrastructure. Urban areas like Osaka and Yokohama are prime locations for such investments.
- Investment in Digital Platforms: The rise in TaaS apps presents a chance to develop and supply innovative digital platforms. Collaborating with local tech firms can facilitate market entry and enhance user engagement.
Government Initiatives in the Japan Transportation-as-a-Service Market
The GX Promotion Act (2023) provides a legal framework for promoting green transport solutions, building on existing laws such as the Passenger Vehicle Transportation Service Law. This measure aims to improve the regulatory environment for TaaS providers, ensuring safety and accessibility for users while promoting eco-friendly practices.
In 2023, the government allocated JPY 150 trillion for the GX Basic Policy, aimed at decarbonisation efforts. The Ministry of Land, Infrastructure, Transport and Tourism oversees TaaS regulations, ensuring compliance and promoting sustainable practices.
Future Insight of the Japan Transportation-as-a-Service Market
By 2032, the Smart Mobility Strategy will drive a transformation in TaaS, prompting suppliers to adopt more efficient technologies. The number of registered e-scooters is expected to rise to 3 million, expanding options for urban residents. The government’s commitment to reducing carbon emissions will encourage buyers to favour eco-friendly transport solutions. As urban populations grow, the demand for convenient TaaS options will compel providers to invest in improved service delivery and innovative platforms.
Market Segmentation Analysis
Japan Transportation-as-a-Service Market report covers a detailed analysis of the following market segments:
By Service Type – Ride Hailing Leads, Micro-Mobility Services Expected to Grow Fastest
According to Saurav Kr Singh, Senior Research Analyst at 6Wresearch, in 2025, Ride Hailing led the service type split with a 46% share. Ride-hailing holds the largest share due to its widespread use for urban transportation needs, especially in Tokyo where the average monthly cost for these services is approximately ¥15,000. This segment benefits from regulatory backing under the Passenger Vehicle Transportation Service Law, ensuring a stable operational environment. Micro-Mobility Services are projected to grow fastest, at a CAGR of 12.5% during 2026–2032. Micro-mobility services are experiencing rapid growth as they address the increasing demand for last-mile connectivity in urban areas like Osaka and Yokohama. The government's Smart Mobility Strategy launched in 2023 is expected to further accelerate this trend, promoting broader TaaS adoption. Suppliers should consider expanding micro-mobility offerings to meet the increasing demand in urban centres.
By Vehicle Type – Cars/SUVs Lead, eScooters/eBikes Expected to Grow Fastest
With 45% of vehicle type revenue in 2025, Cars/SUVs was the largest category. Cars and SUVs dominate the market primarily due to their extensive use in personal ownership, with over 9 million registered vehicles in Tokyo significantly driving this trend. This established base supports the demand for TaaS solutions that effectively integrate personal vehicle usage. The quickest growth will come from eScooters/eBikes, forecast to expand at a CAGR of 13.4% between 2026 and 2032. eScooters and eBikes are rapidly gaining traction as eco-friendly transport options, driven by heightened awareness of carbon emissions and supportive government initiatives. The registration of 1.5 million e-scooters in 2022 highlights the shift towards sustainable transport solutions. Suppliers need to innovate in the eScooter and eBike segment to align with the growing eco-conscious consumer base.
By User Model – Subscription/On-Demand Leads and Records the Fastest Growth
Subscription/On-Demand took 38% of user model revenue in 2025, more than any other category. The Subscription/On-Demand model is the most prevalent as it provides users with the flexibility they seek, particularly in densely populated areas where commuting needs vary. This model is especially favoured by urban commuters looking for reliable transport solutions that adapt to their schedules. Subscription/On-Demand is also forecast to expand faster than any other category, at a CAGR of 12.4% over 2026–2032. The Subscription/On-Demand model is also the fastest-growing due to its capacity to adapt to changing user preferences and the convenience it offers. As urban populations continue to rise, this model is expected to expand further, reinforcing its market leadership. Suppliers should enhance their Subscription/On-Demand offerings to align with the evolving preferences of urban users.
By End User – Urban Commuters Lead, Students/Professionals Expected to Grow Fastest
Urban Commuters accounted for 46% of the market by end user in 2025. Urban commuters represent the largest user base for TaaS services, driven by the need for convenient transportation solutions in densely populated areas like Tokyo. With an average commute time exceeding 30 minutes, this segment is crucial for the growth of TaaS. Over 2026–2032, Students/Professionals are expected to post the fastest growth, at a CAGR of 12.2%. Students and professionals are emerging as the fastest-growing user group, actively seeking affordable transport options to navigate urban environments. The estimated 3 million students in urban areas highlights the potential for tailored services catering to this demographic. Suppliers must tailor their services to meet the specific needs of students and professionals to capture this expanding market.
Key Attractiveness of the Report
- 10 Years of Market Numbers
- Historical Data Starting from 2022 to 2025
- Base Year 2025
- Forecast Data until 2032
- Key Performance Indicators Impacting the Market
- Major Upcoming Developments and Projects
Key Highlights of the Report:
- Japan Transportation-as-a-Service Market Outlook
- Market Size of Japan Transportation-as-a-Service Market, 2025
- Forecast of Japan Transportation-as-a-Service Market, 2032
- Historical Data and Forecast of Japan Transportation-as-a-Service Revenues & Volume for the Period 2022-2032F
- Japan Transportation-as-a-Service Market Trend Evolution
- Japan Transportation-as-a-Service Market Drivers and Challenges
- Japan Transportation-as-a-Service Price Trends
- Japan Transportation-as-a-Service Porter's Five Forces
- Japan Transportation-as-a-Service Industry Life Cycle
- Historical Data and Forecast of Japan Transportation-as-a-Service Market Revenues & Volume By Service Type for the Period 2022-2032F
- Historical Data and Forecast of Japan Transportation-as-a-Service Market Revenues & Volume By Ride Hailing for the Period 2022-2032F
- Historical Data and Forecast of Japan Transportation-as-a-Service Market Revenues & Volume By Vehicle Leasing for the Period 2022-2032F
- Historical Data and Forecast of Japan Transportation-as-a-Service Market Revenues & Volume By Car Sharing for the Period 2022-2032F
- Historical Data and Forecast of Japan Transportation-as-a-Service Market Revenues & Volume By Micro-Mobility Services for the Period 2022-2032F
- Historical Data and Forecast of Japan Transportation-as-a-Service Market Revenues & Volume By Vehicle Type for the Period 2022-2032F
- Historical Data and Forecast of Japan Transportation-as-a-Service Market Revenues & Volume By Cars/SUVs for the Period 2022-2032F
- Historical Data and Forecast of Japan Transportation-as-a-Service Market Revenues & Volume By Commercial Vehicles for the Period 2022-2032F
- Historical Data and Forecast of Japan Transportation-as-a-Service Market Revenues & Volume By Hatchbacks for the Period 2022-2032F
- Historical Data and Forecast of Japan Transportation-as-a-Service Market Revenues & Volume By eScooters/eBikes for the Period 2022-2032F
- Historical Data and Forecast of Japan Transportation-as-a-Service Market Revenues & Volume By User Model for the Period 2022-2032F
- Historical Data and Forecast of Japan Transportation-as-a-Service Market Revenues & Volume By Subscription/On-Demand for the Period 2022-2032F
- Historical Data and Forecast of Japan Transportation-as-a-Service Market Revenues & Volume By Pay-as-you-go for the Period 2022-2032F
- Historical Data and Forecast of Japan Transportation-as-a-Service Market Revenues & Volume By App-Based Access for the Period 2022-2032F
- Historical Data and Forecast of Japan Transportation-as-a-Service Market Revenues & Volume By Usage-Based Pricing for the Period 2022-2032F
- Historical Data and Forecast of Japan Transportation-as-a-Service Market Revenues & Volume By End User for the Period 2022-2032F
- Historical Data and Forecast of Japan Transportation-as-a-Service Market Revenues & Volume By Urban Commuters for the Period 2022-2032F
- Historical Data and Forecast of Japan Transportation-as-a-Service Market Revenues & Volume By SMEs for the Period 2022-2032F
- Historical Data and Forecast of Japan Transportation-as-a-Service Market Revenues & Volume By Students/Professionals for the Period 2022-2032F
- Historical Data and Forecast of Japan Transportation-as-a-Service Market Revenues & Volume By City Residents for the Period 2022-2032F
- Japan Transportation-as-a-Service Import Export Trade Statistics
- Market Opportunity Assessment By Service Type
- Market Opportunity Assessment By Vehicle Type
- Market Opportunity Assessment By User Model
- Market Opportunity Assessment By End User
- Japan Transportation-as-a-Service Top Companies Market Share
- Japan Transportation-as-a-Service Competitive Benchmarking By Technical and Operational Parameters
- Japan Transportation-as-a-Service Company Profiles
- Japan Transportation-as-a-Service Key Strategic Recommendations
Market Covered
The following segment groups are covered in the report.
By Service Type
- Ride Hailing
- Vehicle Leasing
- Car Sharing
- Micro-Mobility Services
By Vehicle Type
- Cars/SUVs
- Commercial Vehicles
- Hatchbacks
- eScooters/eBikes
By User Model
- Subscription/On-Demand
- Pay-as-you-go
- App-Based Access
- Usage-Based Pricing
By End User
- Urban Commuters
- SMEs
- Students/Professionals
- City Residents































