Japan Urban Mapping Market Size & Growth Rate
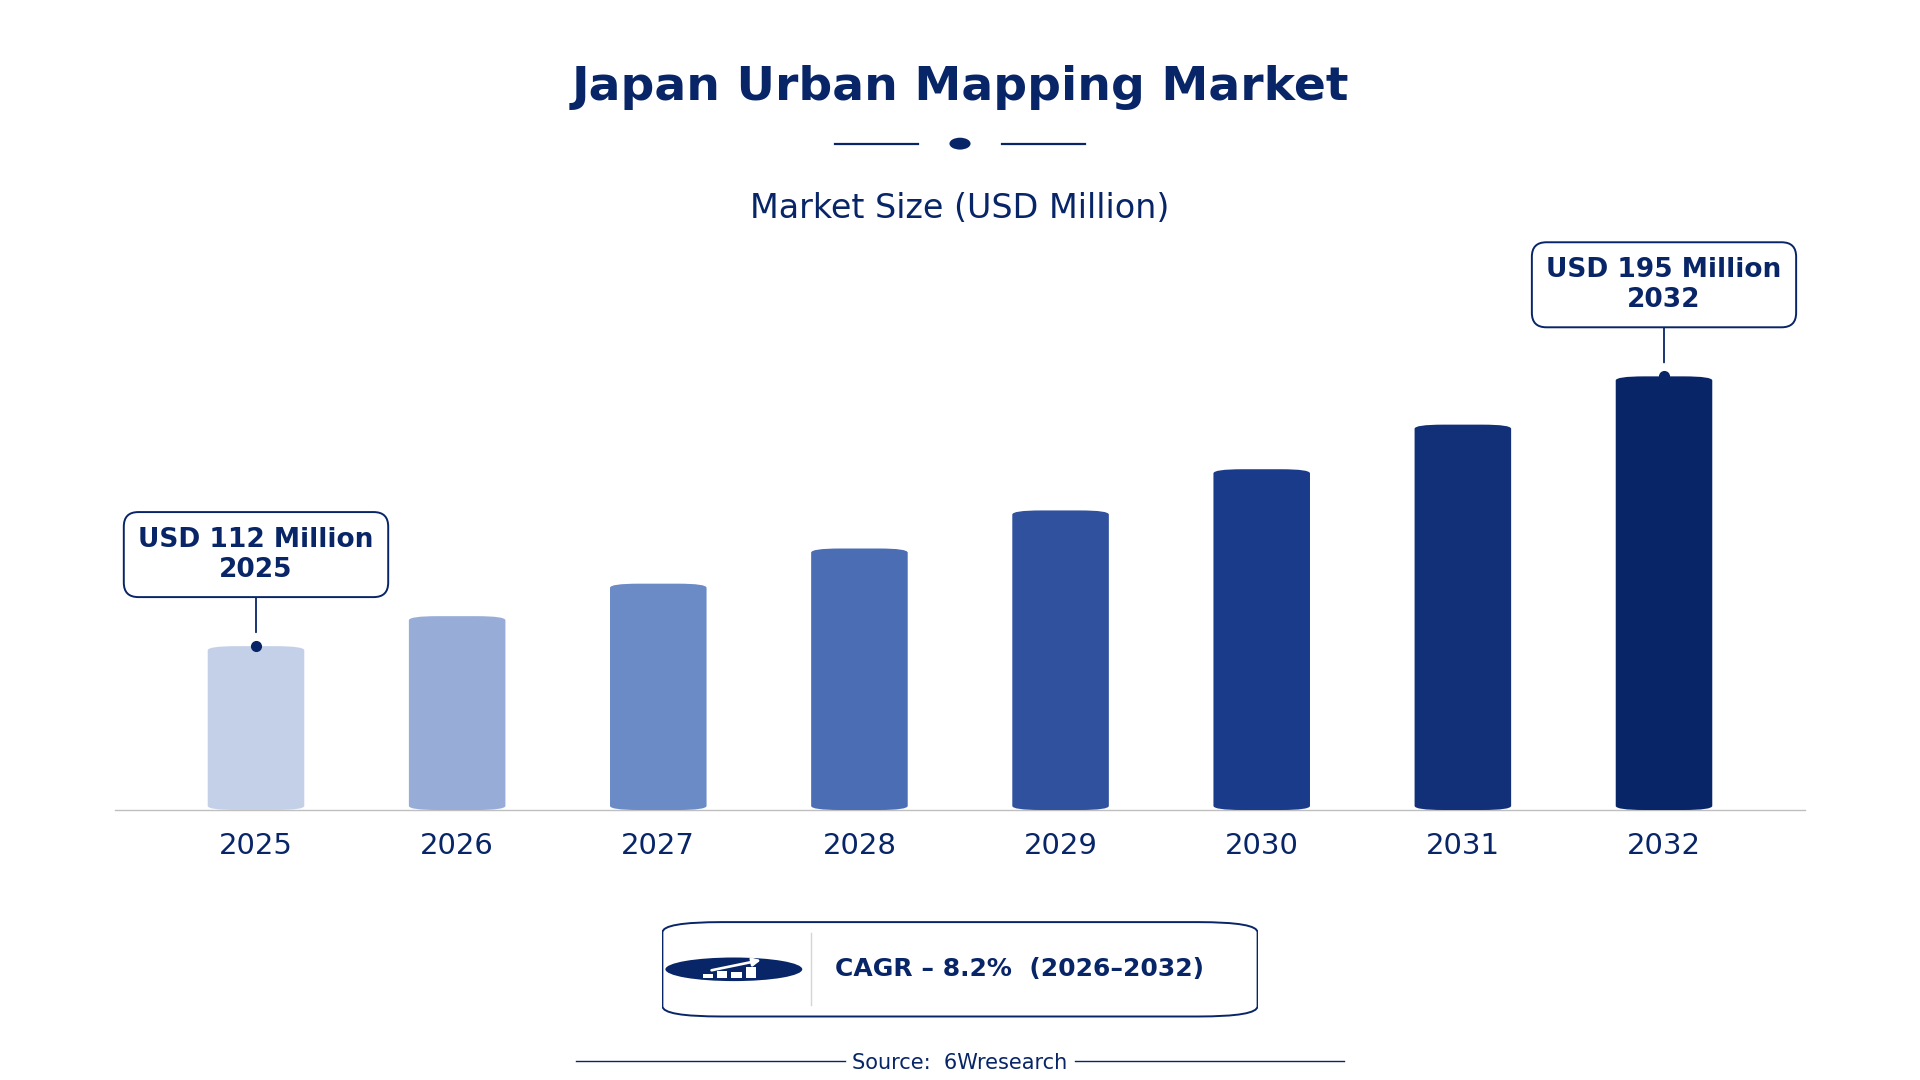
According to 6Wresearch internal database and industry insights, the Japan Urban Mapping Market was valued at USD 112 Million in 2025 and is projected to reach USD 195 Million by 2032, growing at a CAGR of approximately 8.2% during 2026–2032.
Japan Urban Mapping Market Highlights
| Report Metric | Details |
| Report Name | Japan Urban Mapping Market (2026-2032) |
| Market Size 2025 | USD 112 Million |
| Market Size 2032 | USD 195 Million |
| Absolute Growth 2025–2032 | USD 83 Million |
| CAGR 2026–2032 | 8.2% |
| Peak Annual Growth | 9.3% in 2028 |
| Forecast Period | 2026–2032 |
| Historical Data | 2022–2025 |
| Base Year | 2025 |
| Leading Mapping Type, 2025 | 3D Urban Mapping (52% share) |
| Leading Data Source, 2025 | Satellite Imagery (35% share) |
| Leading Output Format, 2025 | GIS Visualizations (35% share) |
| Leading End User, 2025 | Urban Planners (42% share) |
| Fastest-Growing Mapping Type | Real-Time Mapping (11.7% CAGR) |
| Fastest-Growing Data Source | IoT Sensors (12.5% CAGR) |
| Fastest-Growing Output Format | Live Feeds (11.8% CAGR) |
| Fastest-Growing End User | Smart City Projects (10.9% CAGR) |
| Growing Sector | Urban Planning |
| Key End Users | Urban Planners, Construction Firms, Public Works, Smart City Projects |
Japan Urban Mapping Market Year-wise Growth Rate and Key Drivers (2022–2032)
This graph illustrates the annual growth rates of the market from 2022 to 2032, highlighting a steady upward trajectory and projected market expansion over the forecast period.
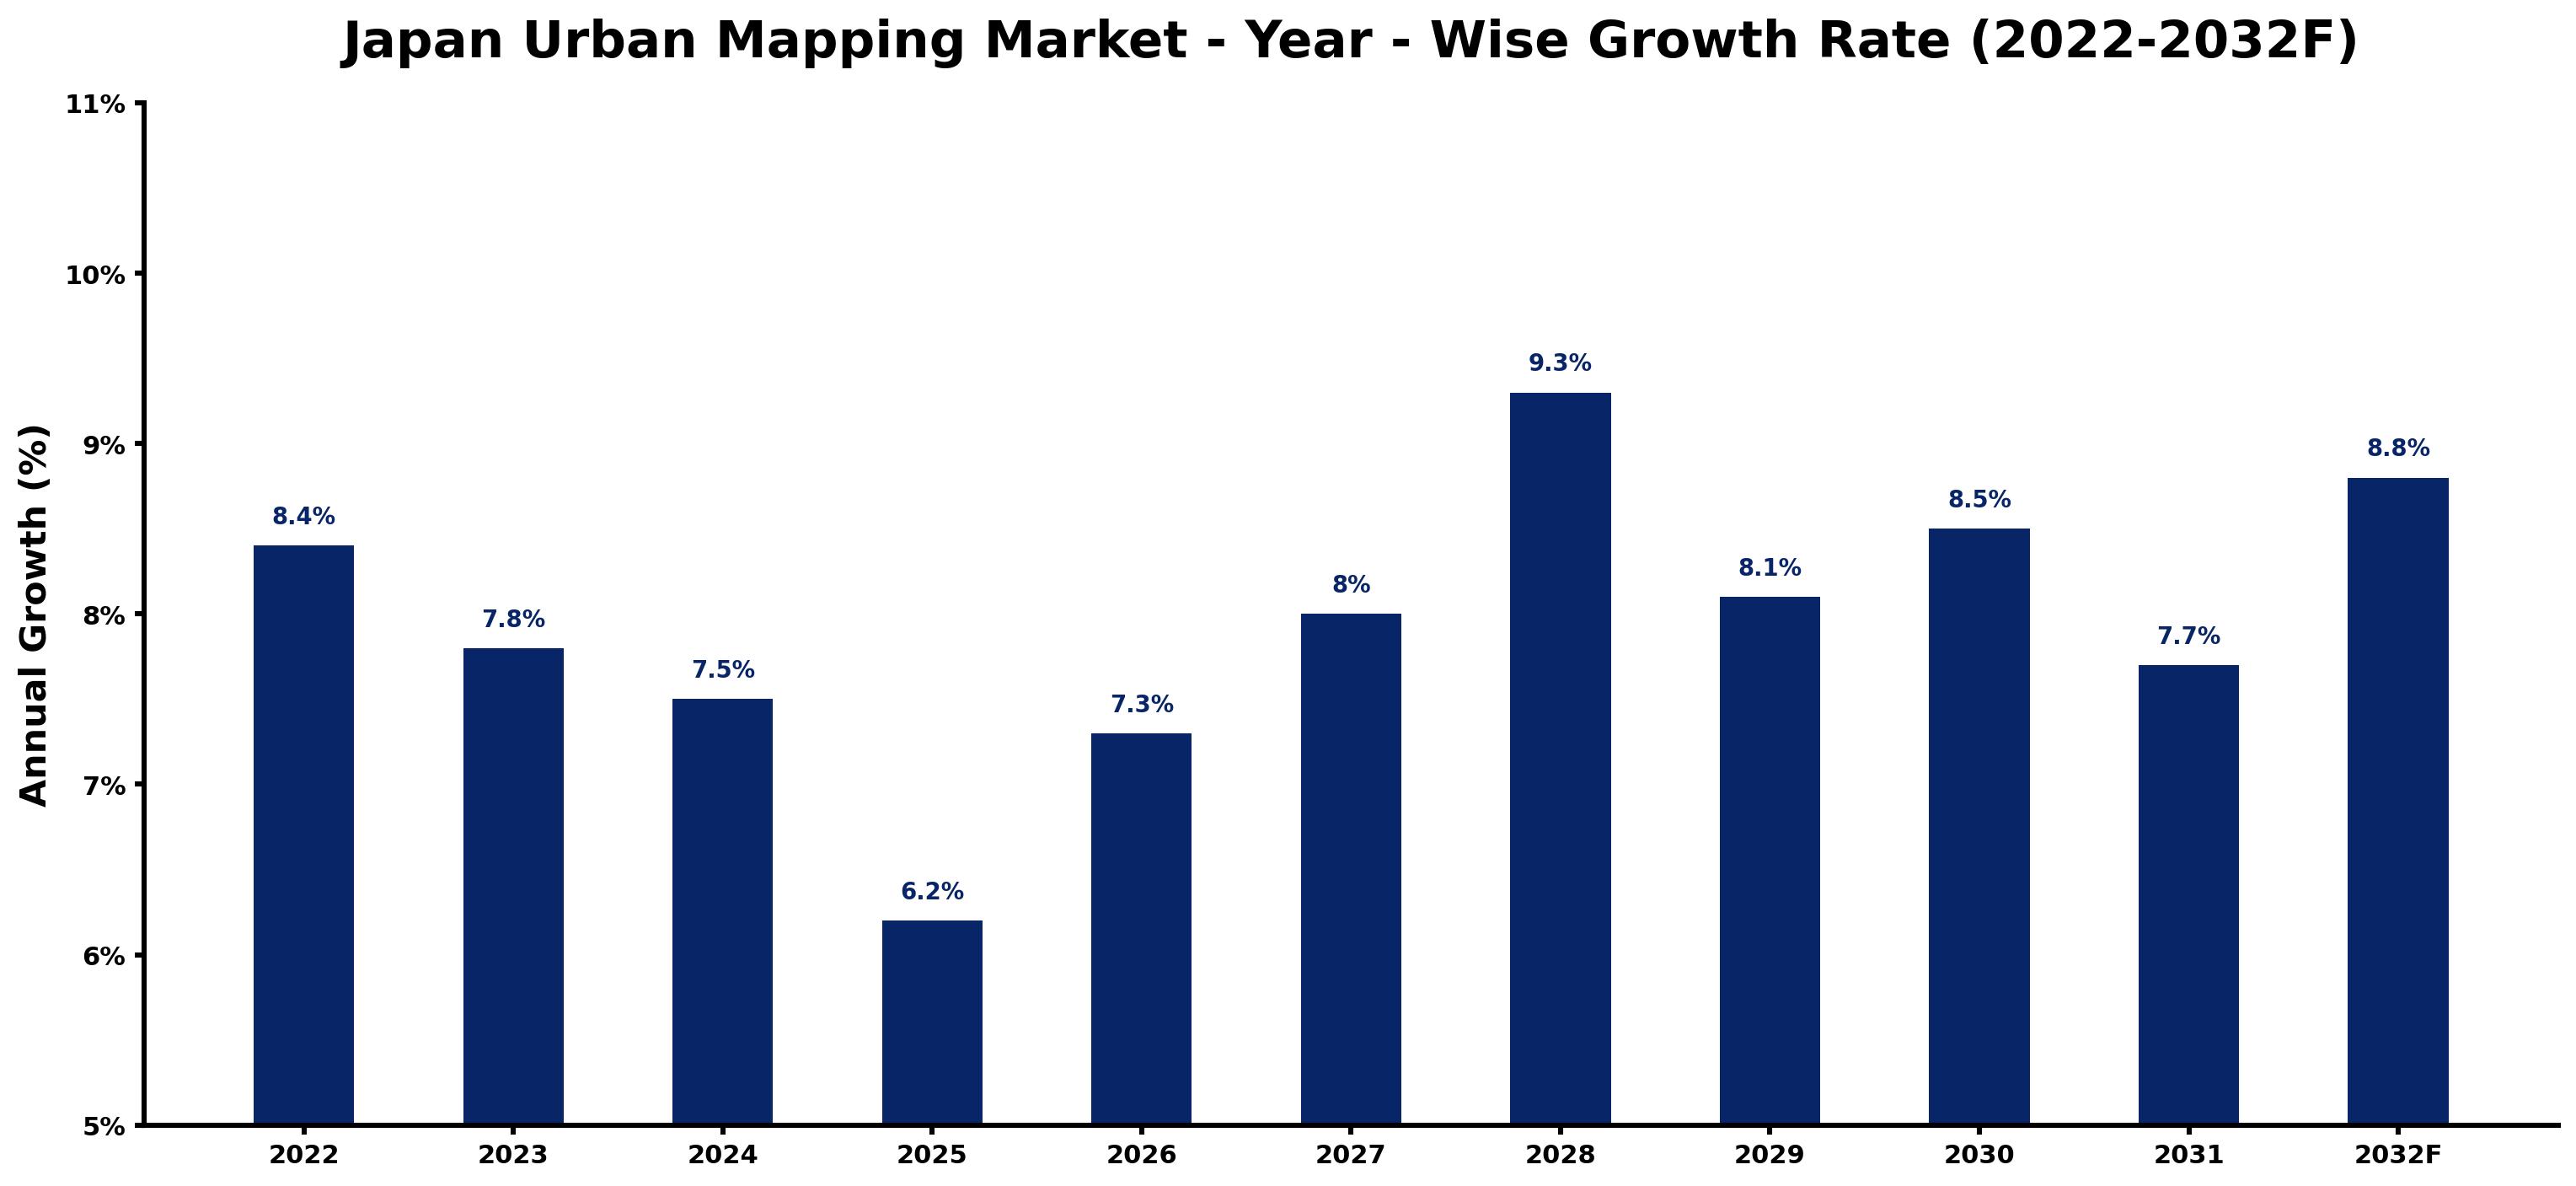
Annual growth estimates for each year appear below with the principal reason behind them, explaining the shifts that set the pace of the market.
| Year | Estimated Annual Growth (%) | Market Rationale |
| 2022 | 8.4 | The market experienced solid growth due to increased urban development projects. |
| 2023 | 7.8 | Demand slowed slightly as urban planners adjusted to new technologies. |
| 2024 | 7.5 | Growth continued to decelerate as market saturation began to set in. |
| 2025 | 6.2 | Demand for urban mapping remained stable amid ongoing infrastructure projects. |
| 2026 | 7.3 | Investment in smart city initiatives is expected to drive renewed growth. |
| 2027 | 8.0 | Urbanisation rates will further boost mapping technology adoption. |
| 2028 | 9.3 | The peak growth year is anticipated as urban planners embrace advanced tools. |
| 2029 | 8.1 | Growth will moderate as the market reaches a more mature phase. |
| 2030 | 8.5 | Demand is projected to rise again as new technologies emerge. |
| 2031 | 7.7 | Urban planners will continue to seek effective mapping solutions. |
| 2032 | 8.8 | The market is expected to grow as smart city projects expand. |
Note: Market size estimations and growth projections presented in this report are based on 6Wresearch's proprietary forecasting methodology, utilizing the latest available industry data, government publications, and primary research inputs.
Japan Urban Mapping Market Synopsis
Urban mapping employs advanced technologies such as GIS, drones, and LIDAR to produce detailed representations of urban environments. The Japan Urban Mapping Market is growing, propelled by over 100 smart city projects and rising urbanisation, with urban planners and construction firms as primary sources of demand. Investment in urban mapping technologies is increasing, bolstered by government funding and infrastructure development, creating ample opportunities for growth.
Market Dynamics Impact Analysis (2026–2032)
| Factor | Type | Impact | Primary Segment Affected |
| Increased investment in smart city projects | Driver | High | Real-Time Mapping |
| Growing urbanisation and infrastructure development | Driver | High | 3D Urban Mapping |
| Rising demand for real-time data in traffic management | Opportunity | High | Real-Time Mapping |
| Need for precise urban planning solutions | Opportunity | Medium | Infrastructure Mapping |
| High costs associated with advanced mapping technologies | Restraint | High | Utility Mapping |
| Limited awareness of urban mapping benefits among smaller firms | Restraint | Medium | 3D Urban Mapping |
| Technological integration challenges in existing systems | Challenge | High | GIS Visualizations |
| Competition from emerging mapping technologies | Challenge | Medium | Drones |
Evaluation of Drivers in Japan Urban Mapping Market (2026–2032)
Key forces behind demand, with the segment each one moves most, are listed below.
| Drivers | Primary Segment Affected | Why It Matters (Evidence) |
| Investment in smart city initiatives | Real-Time Mapping | In 2023, Japan has over 100 smart city projects underway, driving demand for real-time mapping technologies. |
| Urbanisation and infrastructure projects | 3D Urban Mapping | Japan's population of approximately 125 million increases the need for effective urban planning solutions. |
| Adoption of LIDAR technology | Infrastructure Mapping | LIDAR technology is widely used for precise measurements, improving infrastructure planning. |
| Growing use of drones in mapping | Utility Mapping | Drones are increasingly used for efficiency, improving data collection in urban environments. |
| Integration of GIS visualizations in planning | GIS Visualizations | Public works departments rely on GIS visualizations for effective project planning and execution. |
Urbanisation increases the need for effective urban planning solutions, particularly in the Tokyo metropolitan area. The adoption of LIDAR technology improves infrastructure mapping accuracy, while drones improve efficiency in data collection. Public works departments increasingly rely on GIS visualizations for project planning, further boosting demand. As urban planners seek effective solutions, the market is expected to expand significantly.
Evaluation of Restraints in Japan Urban Mapping Market
The key brakes on demand, and where they bite hardest, are shown below.
| Market Restraint | Primary Segment Affected | Why It Matters (Evidence) |
| High costs associated with advanced mapping technologies | Utility Mapping | The costs of implementing advanced mapping technologies can deter smaller firms from investing, limiting market growth. |
| Limited awareness of urban mapping benefits | 3D Urban Mapping | Many smaller construction firms lack knowledge about the advantages of urban mapping, hindering adoption. |
| Integration challenges with existing technologies | GIS Visualizations | Integrating new mapping technologies with existing systems can be complex and costly for urban planners. |
| Competition from emerging mapping technologies | Drones | New mapping technologies may offer more efficient solutions, posing a challenge to traditional methods. |
| Regulatory hurdles in urban planning | Real-Time Mapping | Strict regulations can slow down the implementation of new mapping technologies in urban projects. |
Japan Urban Mapping Market Challenges
Urban planners in Japan face challenges with outdated data, leading to project delays that can extend timelines by 20% and inflate costs for buyers. Skills shortages in advanced mapping technologies impede public works departments, resulting in inefficiencies that may prolong project completion by several months. Many buyers encounter obstacles in technology adoption, as only 30% of urban mapping projects adhere to current GIS standards, limiting the effectiveness of infrastructure assessments. High integration costs for new technologies can deter investment, causing missed opportunities for urban development across the country.
Trends in the Japan Urban Mapping Market
Several trends are reshaping the Japan Urban Mapping Market; the most important are set out below.
- Shift towards Real-Time Mapping Technologies: Urban planners are increasingly embracing real-time mapping technologies for traffic management, exemplified by Tokyo's integration of these systems. This trend arises from the growing demand for efficient urban monitoring.
- Transition from Traditional Mapping to 3D Visualisations: The demand for 3D urban mapping is on the rise as urban planners pursue detailed visualisations for development projects. This shift is underscored by the Tokyo government's focus on advanced mapping solutions.
- Increased Use of Drones for Urban Mapping: Drones are becoming standard tools in urban mapping, enhancing efficiency and data accuracy. This evolution is evident in the increasing number of aerial surveys conducted across major Japanese cities.
- Emergence of IoT Sensors in Urban Management: The integration of IoT sensors in urban mapping is gaining momentum, with pilot projects in cities like Osaka. This trend facilitates real-time data collection for improved urban management.
Investment Opportunities in the Japan Urban Mapping Market
Several openings in the Japan Urban Mapping Market merit attention from investors.
- Rising Demand for Smart City Solutions: With over 100 smart city projects underway, there is an opportunity for investment in real-time mapping technologies to support urban planning efforts in Japan.
- Gap in Utility Mapping Solutions: The need for efficient utility mapping solutions is clear, with a growing number of urban planners seeking advanced technologies. This presents an opportunity for suppliers to fill this gap.
- Investment in Infrastructure Mapping: As urban infrastructure projects expand, there is a pressing need for precise mapping solutions. Construction firms are actively seeking advanced technologies to improve their planning processes.
- Entry into the GIS Visualisation Market: The increasing reliance on GIS visualisations by public works departments creates an opportunity for companies to enter this market through partnerships or local collaborations.
Government Initiatives in the Japan Urban Mapping Market
The Building Energy Efficiency Act, amended in 2022, requires that all new buildings meet energy standards from April 2025, which adds requirements for urban mapping compliance. This law complements existing regulations by ensuring that urban planners integrate energy efficiency into their mapping practices.
In 2023, JPY 150 trillion was allocated for public-private decarbonisation investment, administered by the Ministry of Land, Infrastructure, Transport and Tourism. This funding supports urban mapping projects, facilitating better planning and implementation of sustainable urban initiatives.
Future Insight of the Japan Urban Mapping Market
By 2032, government initiatives will accelerate the integration of advanced urban mapping technologies, supporting over 100 smart city projects. Buyers will benefit from improved data accuracy as LIDAR and drone technologies become standard in urban planning. Increased funding for infrastructure mapping will enhance traffic management systems, promoting better urban mobility. Collaboration between public works departments and research institutions will drive innovation, leading to more efficient urban infrastructure development.
Market Segmentation Analysis
Japan Urban Mapping Market report covers a detailed analysis of the following market segments:
By Mapping Type – 3D Urban Mapping Leads, Real-Time Mapping Expected to Grow Fastest
According to Saurav Kr Singh, Senior Research Analyst at 6Wresearch, in 2025, 3D Urban Mapping led the mapping type split with a 52% share. 3D Urban Mapping holds the largest share due to its crucial role in urban planning and visualisation, particularly in densely populated areas like Tokyo. Urban planners depend on this technology to create effective city layouts and enhance infrastructure designs, ensuring efficient space utilisation. Over 2026–2032, Real-Time Mapping is expected to post the fastest growth, at a CAGR of 11.7%. Real-Time Mapping is experiencing rapid growth as cities implement this technology for traffic management, with Tokyo leading smart city projects. The urgent need for immediate data to track urban changes drives this segment's expansion. This suggests that suppliers should focus on advancing real-time mapping technologies to meet the increasing demands of urban planners.
By Data Source – Satellite Imagery Leads, IoT Sensors Expected to Grow Fastest
Satellite Imagery took 35% of data source revenue in 2025, more than any other category. Satellite Imagery dominates the market as it offers extensive coverage for urban analysis, enabling planners to assess large areas efficiently. This technology is particularly useful for monitoring urban sprawl in regions like the Tokyo metropolitan area. IoT Sensors are projected to grow fastest, at a CAGR of 12.5% during 2026–2032. IoT Sensors are rapidly gaining traction as they facilitate real-time data collection for urban management, with pilot projects being implemented across major cities. The increasing reliance on connected devices for urban solutions is propelling this growth. Buyers will benefit from integrating IoT Sensors into their urban mapping strategies to improve data accuracy and responsiveness.
By Output Format – GIS Visualizations Lead, Live Feeds Expected to Grow Fastest
With 35% of output format revenue in 2025, GIS Visualizations was the largest category. GIS Visualizations are the leading output format as they provide essential insights for urban planning and analysis, making them indispensable for urban planners. Their ability to represent complex data visually aids in decision-making processes. The quickest growth will come from Live Feeds, forecast to expand at a CAGR of 11.8% between 2026 and 2032. Live Feeds are becoming the fastest-growing output format due to their utility in real-time data monitoring, which is critical for managing urban environments effectively. The shift towards immediate data access is driving this trend. Suppliers should prioritise developing live feed technologies to cater to the increasing demand for real-time urban monitoring solutions.
By End User – Urban Planners Lead, Smart City Projects Expected to Grow Fastest
Urban Planners held 42% of the Japan Urban Mapping Market by end user in 2025. Urban Planners represent the largest user group as they are the primary consumers of urban mapping data for city development. Their ongoing projects in areas like Tokyo highlight the necessity for accurate and detailed mapping information. Smart City Projects are set to record the highest CAGR in this split, 10.9% over 2026–2032. Smart City Projects are the fastest-growing segment as cities invest heavily in initiatives that incorporate advanced mapping technologies. The push for sustainable and efficient urban environments is accelerating this growth. Suppliers must align their offerings with the needs of smart city projects to capitalise on this expanding market.
Key Attractiveness of the Report
- 10 Years of Market Numbers
- Historical Data Starting from 2022 to 2025
- Base Year 2025
- Forecast Data until 2032
- Key Performance Indicators Impacting the Market
- Major Upcoming Developments and Projects
Key Highlights of the Report:
- Japan Urban Mapping Market Outlook
- Market Size of Japan Urban Mapping Market, 2025
- Forecast of Japan Urban Mapping Market, 2032
- Historical Data and Forecast of Japan Urban Mapping Revenues & Volume for the Period 2022-2032F
- Japan Urban Mapping Market Trend Evolution
- Japan Urban Mapping Market Drivers and Challenges
- Japan Urban Mapping Price Trends
- Japan Urban Mapping Porter's Five Forces
- Japan Urban Mapping Industry Life Cycle
- Historical Data and Forecast of Japan Urban Mapping Market Revenues & Volume By Mapping Type for the Period 2022-2032F
- Historical Data and Forecast of Japan Urban Mapping Market Revenues & Volume By 3D Urban Mapping for the Period 2022-2032F
- Historical Data and Forecast of Japan Urban Mapping Market Revenues & Volume By Real-Time Mapping for the Period 2022-2032F
- Historical Data and Forecast of Japan Urban Mapping Market Revenues & Volume By Infrastructure Mapping for the Period 2022-2032F
- Historical Data and Forecast of Japan Urban Mapping Market Revenues & Volume By Utility Mapping for the Period 2022-2032F
- Historical Data and Forecast of Japan Urban Mapping Market Revenues & Volume By Data Source for the Period 2022-2032F
- Historical Data and Forecast of Japan Urban Mapping Market Revenues & Volume By Satellite Imagery for the Period 2022-2032F
- Historical Data and Forecast of Japan Urban Mapping Market Revenues & Volume By IoT Sensors, Drones for the Period 2022-2032F
- Historical Data and Forecast of Japan Urban Mapping Market Revenues & Volume By LIDAR + GPS for the Period 2022-2032F
- Historical Data and Forecast of Japan Urban Mapping Market Revenues & Volume By Underground Scans for the Period 2022-2032F
- Historical Data and Forecast of Japan Urban Mapping Market Revenues & Volume By Output Format for the Period 2022-2032F
- Historical Data and Forecast of Japan Urban Mapping Market Revenues & Volume By GIS Visualizations for the Period 2022-2032F
- Historical Data and Forecast of Japan Urban Mapping Market Revenues & Volume By Live Feeds for the Period 2022-2032F
- Historical Data and Forecast of Japan Urban Mapping Market Revenues & Volume By Topographic Maps for the Period 2022-2032F
- Historical Data and Forecast of Japan Urban Mapping Market Revenues & Volume By CAD/GIS Integrations for the Period 2022-2032F
- Historical Data and Forecast of Japan Urban Mapping Market Revenues & Volume By End User for the Period 2022-2032F
- Historical Data and Forecast of Japan Urban Mapping Market Revenues & Volume By Urban Planners for the Period 2022-2032F
- Historical Data and Forecast of Japan Urban Mapping Market Revenues & Volume By Smart City Projects for the Period 2022-2032F
- Historical Data and Forecast of Japan Urban Mapping Market Revenues & Volume By Construction Firms for the Period 2022-2032F
- Historical Data and Forecast of Japan Urban Mapping Market Revenues & Volume By Public Works for the Period 2022-2032F
- Japan Urban Mapping Import Export Trade Statistics
- Market Opportunity Assessment By Mapping Type
- Market Opportunity Assessment By Data Source
- Market Opportunity Assessment By Output Format
- Market Opportunity Assessment By End User
- Japan Urban Mapping Top Companies Market Share
- Japan Urban Mapping Competitive Benchmarking By Technical and Operational Parameters
- Japan Urban Mapping Company Profiles
- Japan Urban Mapping Key Strategic Recommendations
Market Covered
The report covers the following segments.
By Mapping Type
- 3D Urban Mapping
- Real-Time Mapping
- Infrastructure Mapping
- Utility Mapping
By Data Source
- Satellite Imagery
- IoT Sensors
- Drones
- LIDAR + GPS
- Underground Scans
By Output Format
- GIS Visualizations
- Live Feeds
- Topographic Maps
- CAD/GIS Integrations
By End User
- Urban Planners
- Smart City Projects
- Construction Firms
- Public Works































