Japan Urban Mobility Market Size & Growth Rate
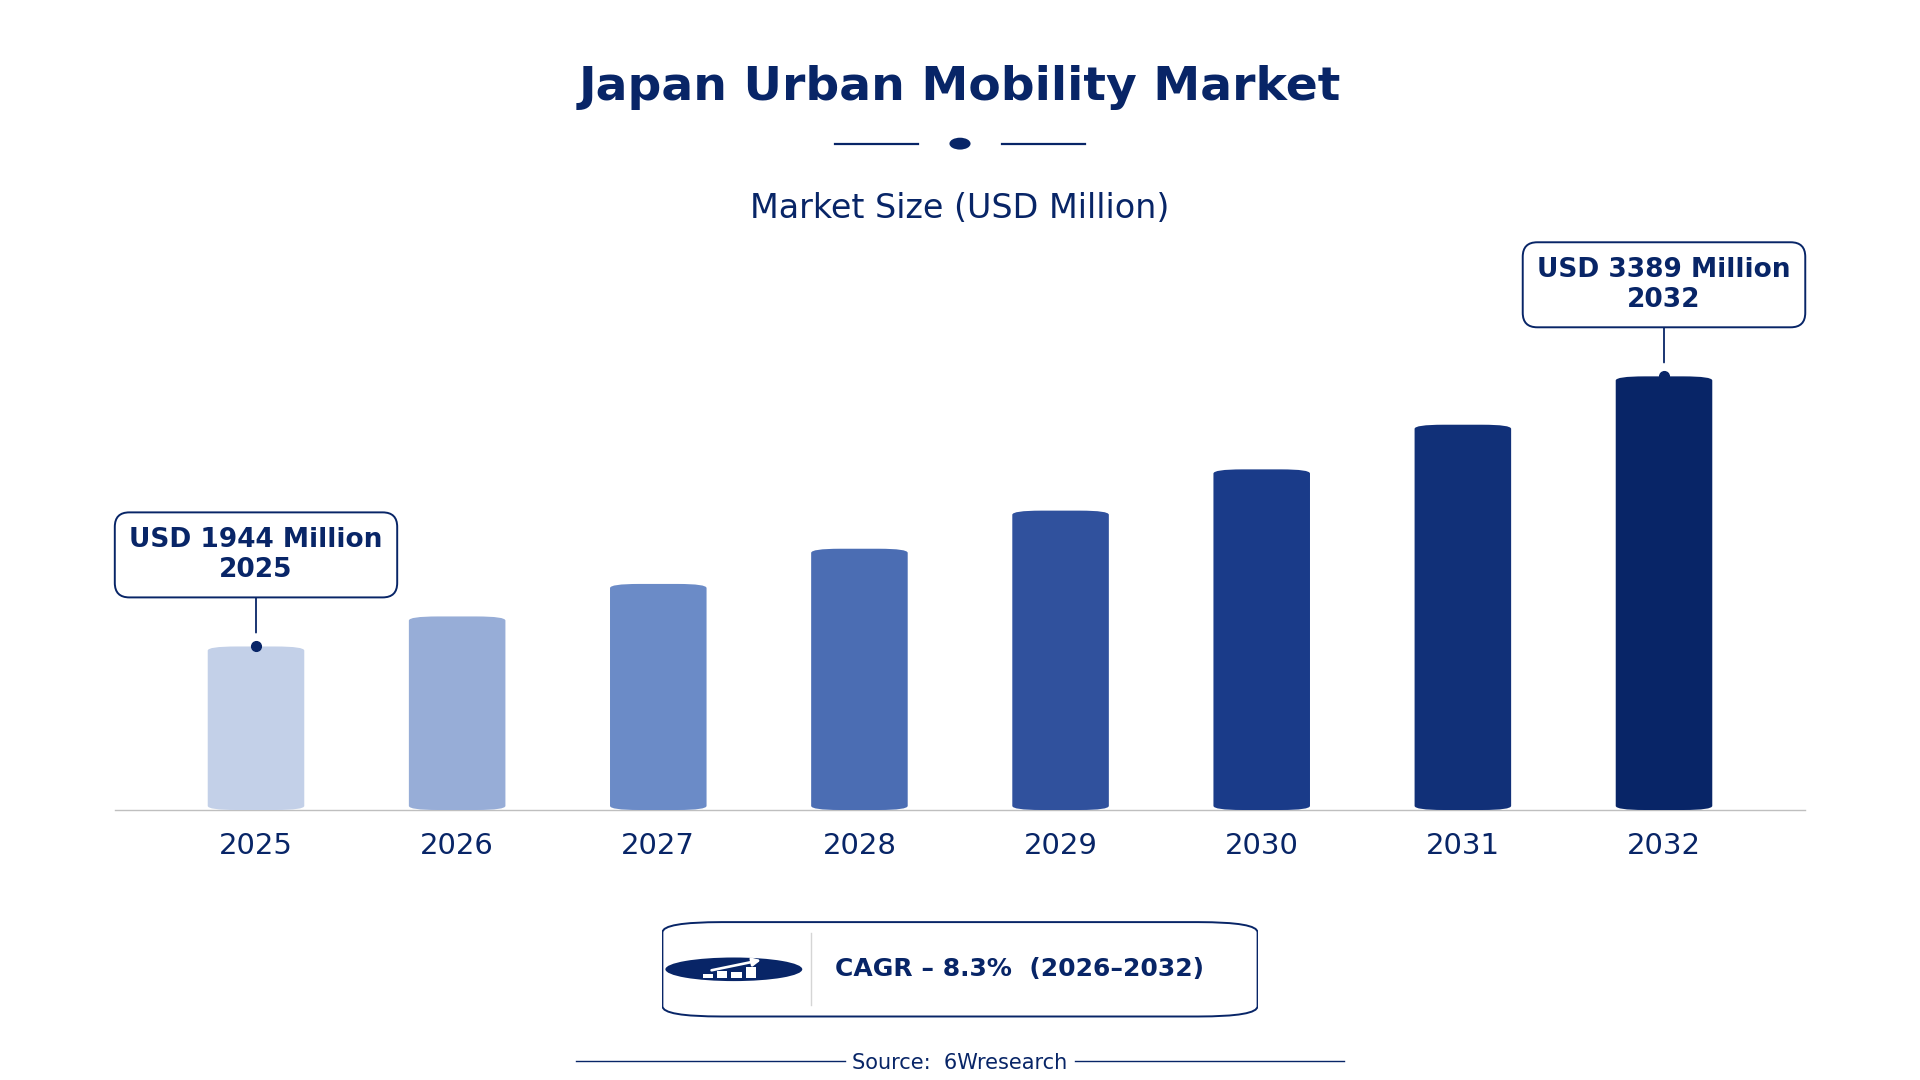
According to 6Wresearch internal database and industry insights, the Japan Urban Mobility Market was valued at USD 1,944 Million in 2025 and is projected to reach USD 3,389 Million by 2032, growing at a CAGR of approximately 8.3% during 2026–2032.
Japan Urban Mobility Market Highlights
| Report Metric | Details |
| Report Name | Japan Urban Mobility Market (2026-2032) |
| Market Size 2025 | USD 1,944 Million |
| Market Size 2032 | USD 3,389 Million |
| Absolute Growth 2025–2032 | USD 1,445 Million |
| CAGR 2026–2032 | 8.3% |
| Peak Annual Growth | 10.0% in 2032 |
| Forecast Period | 2026–2032 |
| Historical Data | 2022–2025 |
| Base Year | 2025 |
| Leading Mode of Transport, 2025 | Public Transit (42% share) |
| Leading Vehicle Type, 2025 | Buses (45% share) |
| Leading Energy Source, 2025 | Electric (54% share) |
| Leading End User, 2025 | Urban Commuters (50% share) |
| Fastest-Growing Mode of Transport | Shared Mobility (10.6% CAGR) |
| Fastest-Growing Vehicle Type | e-Bikes (12.5% CAGR) |
| Fastest-Growing End User | Working Professionals (10.8% CAGR) |
| Growing Sector | Urban mobility solutions |
| Key End Users | Urban commuters, municipal transport agencies, working professionals, students |
Japan Urban Mobility Market Year-wise Growth Rate and Key Drivers (2022–2032)
This graph illustrates the annual growth rates of the market from 2022 to 2032, highlighting a steady upward trajectory and projected market expansion over the forecast period.
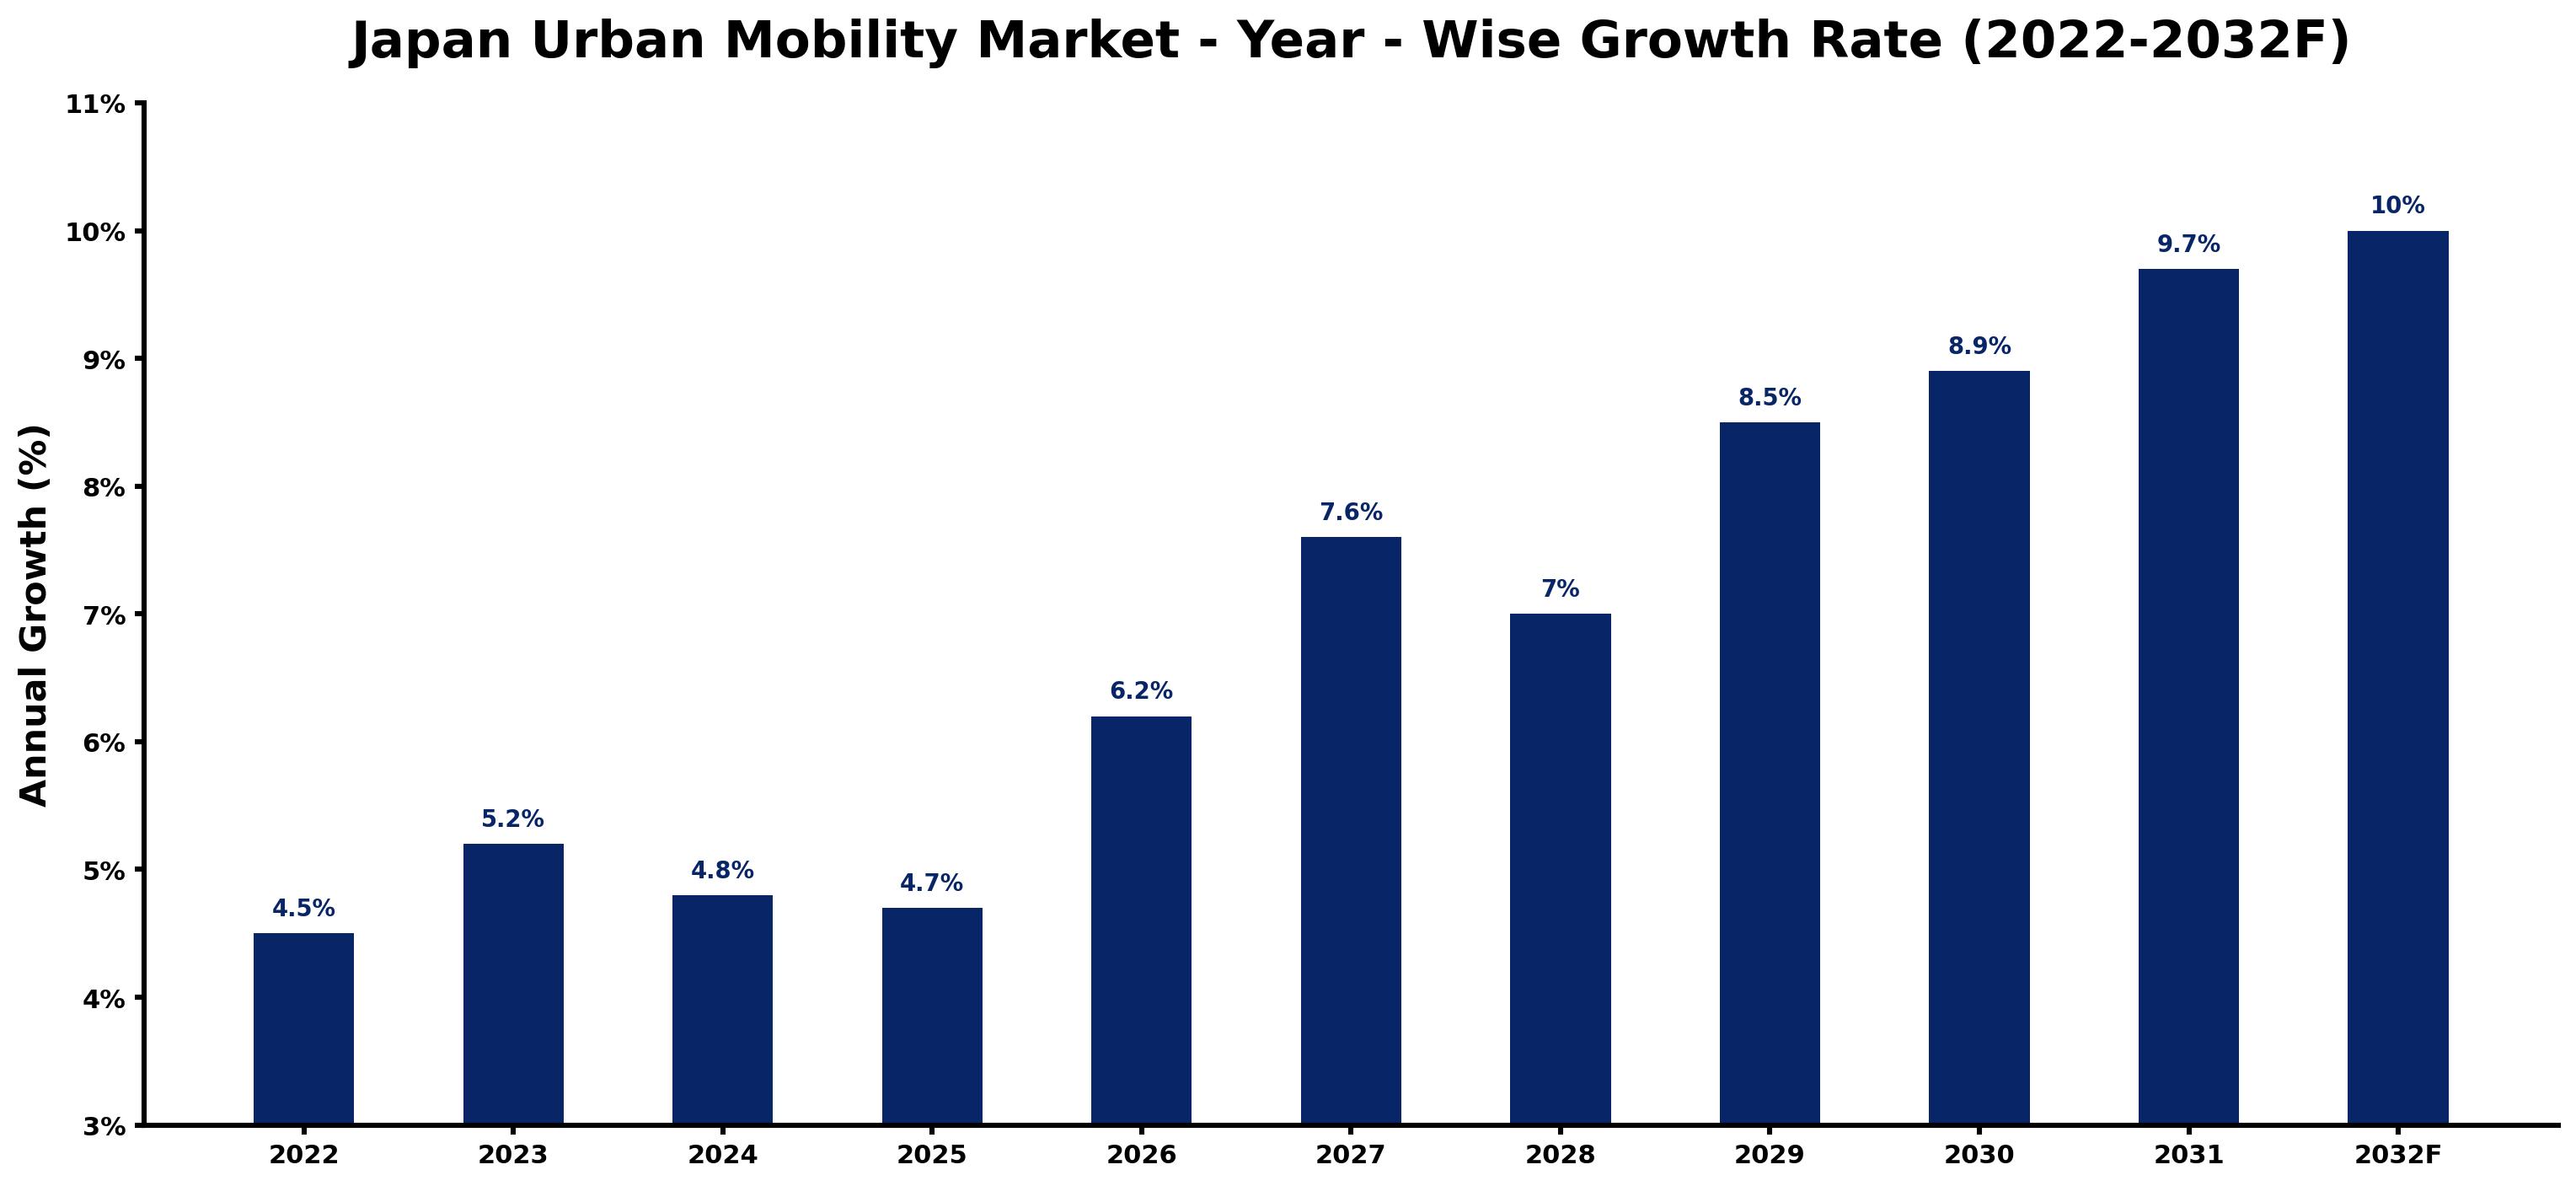
The table below sets out the estimated growth rate for each year and the main factor behind it.
| Year | Estimated Annual Growth (%) | Market Rationale |
| 2022 | 4.5 | Public transit usage was high, reflecting strong urban mobility needs. |
| 2023 | 5.2 | Shared mobility services gained traction, boosting overall market growth. |
| 2024 | 4.8 | Growth slowed as the market adjusted to increased competition. |
| 2025 | 4.7 | Demand remained steady, driven by urban commuting and public transit. |
| 2026 | 6.2 | Rising interest in electric vehicles is expected to spur market expansion. |
| 2027 | 7.6 | Investment in infrastructure will improve accessibility, driving demand. |
| 2028 | 7.0 | Market growth is projected to moderate as consumer preferences stabilise. |
| 2029 | 8.5 | Increased adoption of shared mobility solutions will accelerate growth. |
| 2030 | 8.9 | Urban commuters increasingly favour public transit over personal vehicles. |
| 2031 | 9.7 | Technological advancements in mobility solutions will drive demand higher. |
| 2032 | 10.0 | The peak growth year reflects shifts towards electric mobility. |
Note: Market size estimations and growth projections presented in this report are based on 6Wresearch's proprietary forecasting methodology, utilizing the latest available industry data, government publications, and primary research inputs.
Japan Urban Mobility Market Synopsis
Urban mobility in Japan encompasses diverse transport modes aimed at improving efficiency in urban areas, including electric vehicles and shared mobility solutions. The Japan Urban Mobility Market is growing due to high public transit usage, with over 9 million daily users in Tokyo, and a 30% increase in shared mobility services since 2022.
Market Dynamics Impact Analysis (2026–2032)
| Factor | Type | Impact | Primary Segment Affected |
| High daily public transit usage in urban areas drives demand for efficient transport solutions. | Driver | High | Public Transit |
| Growing adoption of electric vehicles reflects a shift towards sustainable transport. | Driver | High | Electric |
| Increasing urban population creates a larger customer base for mobility services. | Opportunity | High | Shared Mobility |
| The push for integrated transport solutions opens avenues for new service providers. | Opportunity | High | Public Transit |
| Competition among shared mobility services may lead to price wars, affecting profitability. | Restraint | Medium | Shared Mobility |
| Infrastructure limitations in some regions can hinder service expansion and efficiency. | Restraint | Medium | Public Transit |
| High initial investment costs for electric vehicle infrastructure can deter new entrants. | Challenge | High | Electric |
| Rapid technological changes may outpace existing service providers' capabilities. | Challenge | High | Public Transit |
Evaluation of Drivers in Japan Urban Mobility Market (2026–2032)
The factors lifting demand, and the evidence behind each, are summarised below.
| Drivers | Primary Segment Affected | Why It Matters (Evidence) |
| High public transit usage in Tokyo | Public Transit | Over 9 million daily users in Tokyo create consistent demand for public transport services. |
| Increase in electric vehicle sales | Electric | Electric vehicles accounted for 20% of new car sales in 2023, reflecting a shift in consumer preferences. |
| Growth in shared mobility services | Shared Mobility | Japan has over 1,000 shared mobility services, increasing by 30% since 2022. |
| Government initiatives promoting sustainable transport | Public Transit | The 'Smart Mobility Challenge' launched in 2023 aims to enhance urban transport solutions. |
| Rising urban population | Urban Commuters | Tokyo's population of approximately 14 million drives demand for efficient urban mobility. |
Behind the steady rise in orders sits the increasing daily public transit usage in Tokyo, with over 9 million users. Electric vehicles accounted for 20% of new car sales in 2023, as consumers shift towards sustainable options. The surge in shared mobility services, increasing by 30% since 2022, reflects changing preferences among urban residents. The 'Smart Mobility Challenge' launched in 2023 promotes innovation in urban transport, driving demand. Tokyo's population of approximately 14 million creates a substantial customer base for mobility solutions, supporting overall market growth.
Evaluation of Restraints in Japan Urban Mobility Market
Several factors work against faster growth; the main ones are summarised below.
| Market Restraint | Primary Segment Affected | Why It Matters (Evidence) |
| Intense competition among shared mobility services | Shared Mobility | This competition can lead to price wars, impacting profitability for service providers. |
| Limited infrastructure in certain areas | Public Transit | Infrastructure challenges can hinder the efficiency and expansion of public transport services. |
| High costs of electric vehicle infrastructure | Electric | The initial investment for charging stations and maintenance can deter new market entrants. |
| Technological advancements outpacing service providers | Public Transit | Rapid changes in technology may leave some providers unable to keep up with market demands. |
| Regulatory hurdles for new mobility solutions | Shared Mobility | Compliance with safety and operational standards can delay the launch of new services. |
Japan Urban Mobility Market Challenges
Urban commuters in Japan face rising costs due to increased fares, which have surged by 15% since 2022, straining their daily budgets. Producers of urban transport solutions encounter supply chain disruptions, particularly in sourcing components for electric vehicles, leading to delays in product launches that impact market competitiveness. New regulations from the Ministry of Land, Infrastructure, Transport and Tourism require shared mobility services to obtain additional certifications, delaying service rollouts by several months and limiting options for users. A skills gap exists in the workforce, with reports indicating a 25% shortage of qualified personnel needed for advanced urban technologies by 2025, hindering innovation.
Trends in the Japan Urban Mobility Market
Four trends stand out in the Japan Urban Mobility Market.
- Shift towards Electric Vehicles in Urban Areas: Tokyo is increasingly adopting electric vehicles, with 20% of new car sales in 2023 being electric. This trend reflects a broader commitment to sustainability in urban transport.
- Growth of Shared Mobility Services: Shared mobility services have surged by 30% since 2022, driven by urban residents seeking convenience. This shift is reshaping how people navigate cities, improving accessibility.
- Integration of Mobility as a Service: The 'Mobility as a Service' initiative aims for integrated transport solutions by 2025. This approach is expected to streamline urban mobility, making it more efficient for users.
- Increased Focus on Sustainable Transport Solutions: The Battery Industry Strategy aims for 150 GWh of domestic battery manufacturing capacity by 2030. This ambitious goal highlights Japan's commitment to reducing carbon emissions in urban areas.
Investment Opportunities in the Japan Urban Mobility Market
The openings below show where demand in the Japan Urban Mobility Market is visible and how suppliers can enter.
- Urban Commuters seeking efficient transport solutions: With over 60% of urban commuters preferring public transit, there is an opportunity to improve services. Investing in integrated transport solutions can capture this demand.
- Growing demand for electric vehicle infrastructure: Electric vehicles accounted for 20% of new car sales in 2023, indicating a gap in charging infrastructure. Suppliers can focus on developing charging stations in urban areas.
- Partnerships with local governments: Collaborating with municipal transport agencies can facilitate the rollout of new mobility solutions. This approach can utilise existing infrastructure and improve service delivery.
- Investment in shared mobility platforms: The increase in shared mobility services presents an opportunity to invest in technology platforms. Developing user-friendly apps can attract more urban residents to these services.
Government Initiatives in the Japan Urban Mobility Market
The Hydrogen Society Promotion Act, enacted in 2024, complements existing regulations by providing price-gap support for low-carbon hydrogen supply chains. This measure encourages investment in sustainable energy sources, which is important for the urban mobility sector. The act aims to support the hydrogen economy, with a target of backing 50 projects by 2030.
The Ministry of Land, Infrastructure, Transport and Tourism oversees urban mobility regulations, ensuring compliance with safety standards. The 'Smart Mobility Challenge' supports projects, providing funding for initiatives that improve urban transport efficiency, with a budget of 5 billion yen allocated for 2023.
Future Insight of the Japan Urban Mobility Market
By 2032, the shift towards electric public transport will drive suppliers to advance battery technology and charging infrastructure, improving service availability. The 'Mobility as a Service' initiative will integrate various transport modes, simplifying travel for urban commuters. Shared mobility services are expected to expand significantly, with projections indicating a 50% increase in usage by 2030. The 'Smart Mobility Challenge' will stimulate new startups focused on sustainable transport solutions, reshaping urban transport operations and improving accessibility.
Market Segmentation Analysis
Japan Urban Mobility Market report covers a detailed analysis of the following market segments:
By Mode of Transport – Public Transit Leads, Shared Mobility Expected to Grow Fastest
According to Saurav Kr Singh, Senior Research Analyst at 6Wresearch, Public Transit took 42% of mode of transport revenue in 2025, more than any other category. Public transit is crucial for urban commuting, evidenced by over 9 million daily users in Tokyo. The extensive network, supported by government initiatives, ensures accessibility and efficiency for commuters. Over 2026–2032, Shared Mobility is expected to post the fastest growth, at a CAGR of 10.6%. The increase in shared mobility services, which have grown by 30% since 2022, reflects urban residents' demand for flexible transport options. This trend indicates that shared mobility will increasingly complement traditional public transit. Suppliers should focus on integrating shared mobility solutions to align with urban commuters' preferences.
By Vehicle Type – Buses Lead, e-Bikes Expected to Grow Fastest
With 45% of vehicle type revenue in 2025, Buses was the largest category. Buses are essential to public transport in cities, operating on more than 1,000 routes across Japan's urban areas. Their role in daily commuting reinforces their leading position in the vehicle type segment. e-Bikes are set to record the highest CAGR in this split, 12.5% over 2026–2032. The rapid rise in e-bike adoption is attributed to their popularity for eco-friendly commuting, showing a shift towards sustainable transport. This trend suggests a growing consumer preference for greener alternatives in urban mobility. Buyers may view e-bikes as an effective choice to enhance their commuting experience while lowering their environmental impact.
By Energy Source – Electric Leads and Records the Fastest Growth
Electric accounted for 54% of the market by energy source in 2025. Electric energy is the dominant source for new mobility solutions, aligning with the government's 'Green Mobility Strategy' aiming for 100% electric public transport by 2030. This commitment underscores the importance of electric energy in shaping the future of urban mobility. The same category is also set to grow fastest, at a CAGR of 9.9% during 2026–2032. The electric energy segment's growth is reinforced by its leadership position, as it continues to meet the increasing demand for sustainable transport solutions. This trend will likely expand as more innovations emerge in electric mobility. Suppliers must prioritise electric solutions to align with regulatory goals and consumer demand for sustainable transport.
By End User – Urban Commuters Lead, Working Professionals Expected to Grow Fastest
In 2025, Urban Commuters led the end user split with a 50% share. Urban commuters represent the primary user base for urban mobility solutions, underscoring the need for efficient transport in densely populated areas. Their preferences significantly influence market trends and offerings. The quickest growth will come from Working Professionals, forecast to expand at a CAGR of 10.8% between 2026 and 2032. Working professionals are a major demographic for ride-hailing and public transit, driven by their need for reliable transport during peak hours. This trend highlights the increasing dependence on urban mobility services among this group. Suppliers should tailor their services to meet the unique needs of working professionals to effectively engage this expanding market segment.
Key Attractiveness of the Report
- 10 Years of Market Numbers
- Historical Data Starting from 2022 to 2025
- Base Year 2025
- Forecast Data until 2032
- Key Performance Indicators Impacting the Market
- Major Upcoming Developments and Projects
Key Highlights of the Report:
- Japan Urban Mobility Market Outlook
- Market Size of Japan Urban Mobility Market, 2025
- Forecast of Japan Urban Mobility Market, 2032
- Historical Data and Forecast of Japan Urban Mobility Revenues & Volume for the Period 2022-2032F
- Japan Urban Mobility Market Trend Evolution
- Japan Urban Mobility Market Drivers and Challenges
- Japan Urban Mobility Price Trends
- Japan Urban Mobility Porter's Five Forces
- Japan Urban Mobility Industry Life Cycle
- Historical Data and Forecast of Japan Urban Mobility Market Revenues & Volume By Mode of Transport for the Period 2022-2032F
- Historical Data and Forecast of Japan Urban Mobility Market Revenues & Volume By Shared Mobility for the Period 2022-2032F
- Historical Data and Forecast of Japan Urban Mobility Market Revenues & Volume By Public Transit for the Period 2022-2032F
- Historical Data and Forecast of Japan Urban Mobility Market Revenues & Volume By Ride-Hailing for the Period 2022-2032F
- Historical Data and Forecast of Japan Urban Mobility Market Revenues & Volume By Personal Mobility for the Period 2022-2032F
- Historical Data and Forecast of Japan Urban Mobility Market Revenues & Volume By Vehicle Type for the Period 2022-2032F
- Historical Data and Forecast of Japan Urban Mobility Market Revenues & Volume By e-Scooters, e-Bikes for the Period 2022-2032F
- Historical Data and Forecast of Japan Urban Mobility Market Revenues & Volume By Buses, Metro for the Period 2022-2032F
- Historical Data and Forecast of Japan Urban Mobility Market Revenues & Volume By Cars, Vans for the Period 2022-2032F
- Historical Data and Forecast of Japan Urban Mobility Market Revenues & Volume By Hoverboards, Foldable EVs for the Period 2022-2032F
- Historical Data and Forecast of Japan Urban Mobility Market Revenues & Volume By Energy Source for the Period 2022-2032F
- Historical Data and Forecast of Japan Urban Mobility Market Revenues & Volume By Electric for the Period 2022-2032F
- Historical Data and Forecast of Japan Urban Mobility Market Revenues & Volume By Hybrid/Fuel Cell for the Period 2022-2032F
- Historical Data and Forecast of Japan Urban Mobility Market Revenues & Volume By Electric/Diesel for the Period 2022-2032F
- Historical Data and Forecast of Japan Urban Mobility Market Revenues & Volume By Rechargeable Battery for the Period 2022-2032F
- Historical Data and Forecast of Japan Urban Mobility Market Revenues & Volume By End User for the Period 2022-2032F
- Historical Data and Forecast of Japan Urban Mobility Market Revenues & Volume By Urban Commuters for the Period 2022-2032F
- Historical Data and Forecast of Japan Urban Mobility Market Revenues & Volume By Municipal Transport for the Period 2022-2032F
- Historical Data and Forecast of Japan Urban Mobility Market Revenues & Volume By Working Professionals for the Period 2022-2032F
- Historical Data and Forecast of Japan Urban Mobility Market Revenues & Volume By Students for the Period 2022-2032F
- Japan Urban Mobility Import Export Trade Statistics
- Market Opportunity Assessment By Mode of Transport
- Market Opportunity Assessment By Vehicle Type
- Market Opportunity Assessment By Energy Source
- Market Opportunity Assessment By End User
- Japan Urban Mobility Top Companies Market Share
- Japan Urban Mobility Competitive Benchmarking By Technical and Operational Parameters
- Japan Urban Mobility Company Profiles
- Japan Urban Mobility Key Strategic Recommendations
Market Covered
The following segment groups are covered in the report.
By Mode of Transport
- Shared Mobility
- Public Transit
- Ride-Hailing
- Personal Mobility
By Vehicle Type
- e-Scooters
- e-Bikes
- Buses
- Metro
- Cars
- Vans
- Hoverboards
- Foldable EVs
By Energy Source
- Electric
- Hybrid/Fuel Cell
- Electric/Diesel
- Rechargeable Battery
By End User
- Urban Commuters
- Municipal Transport
- Working Professionals
- Students































