Japan Urban Simulation Market Size & Growth Rate
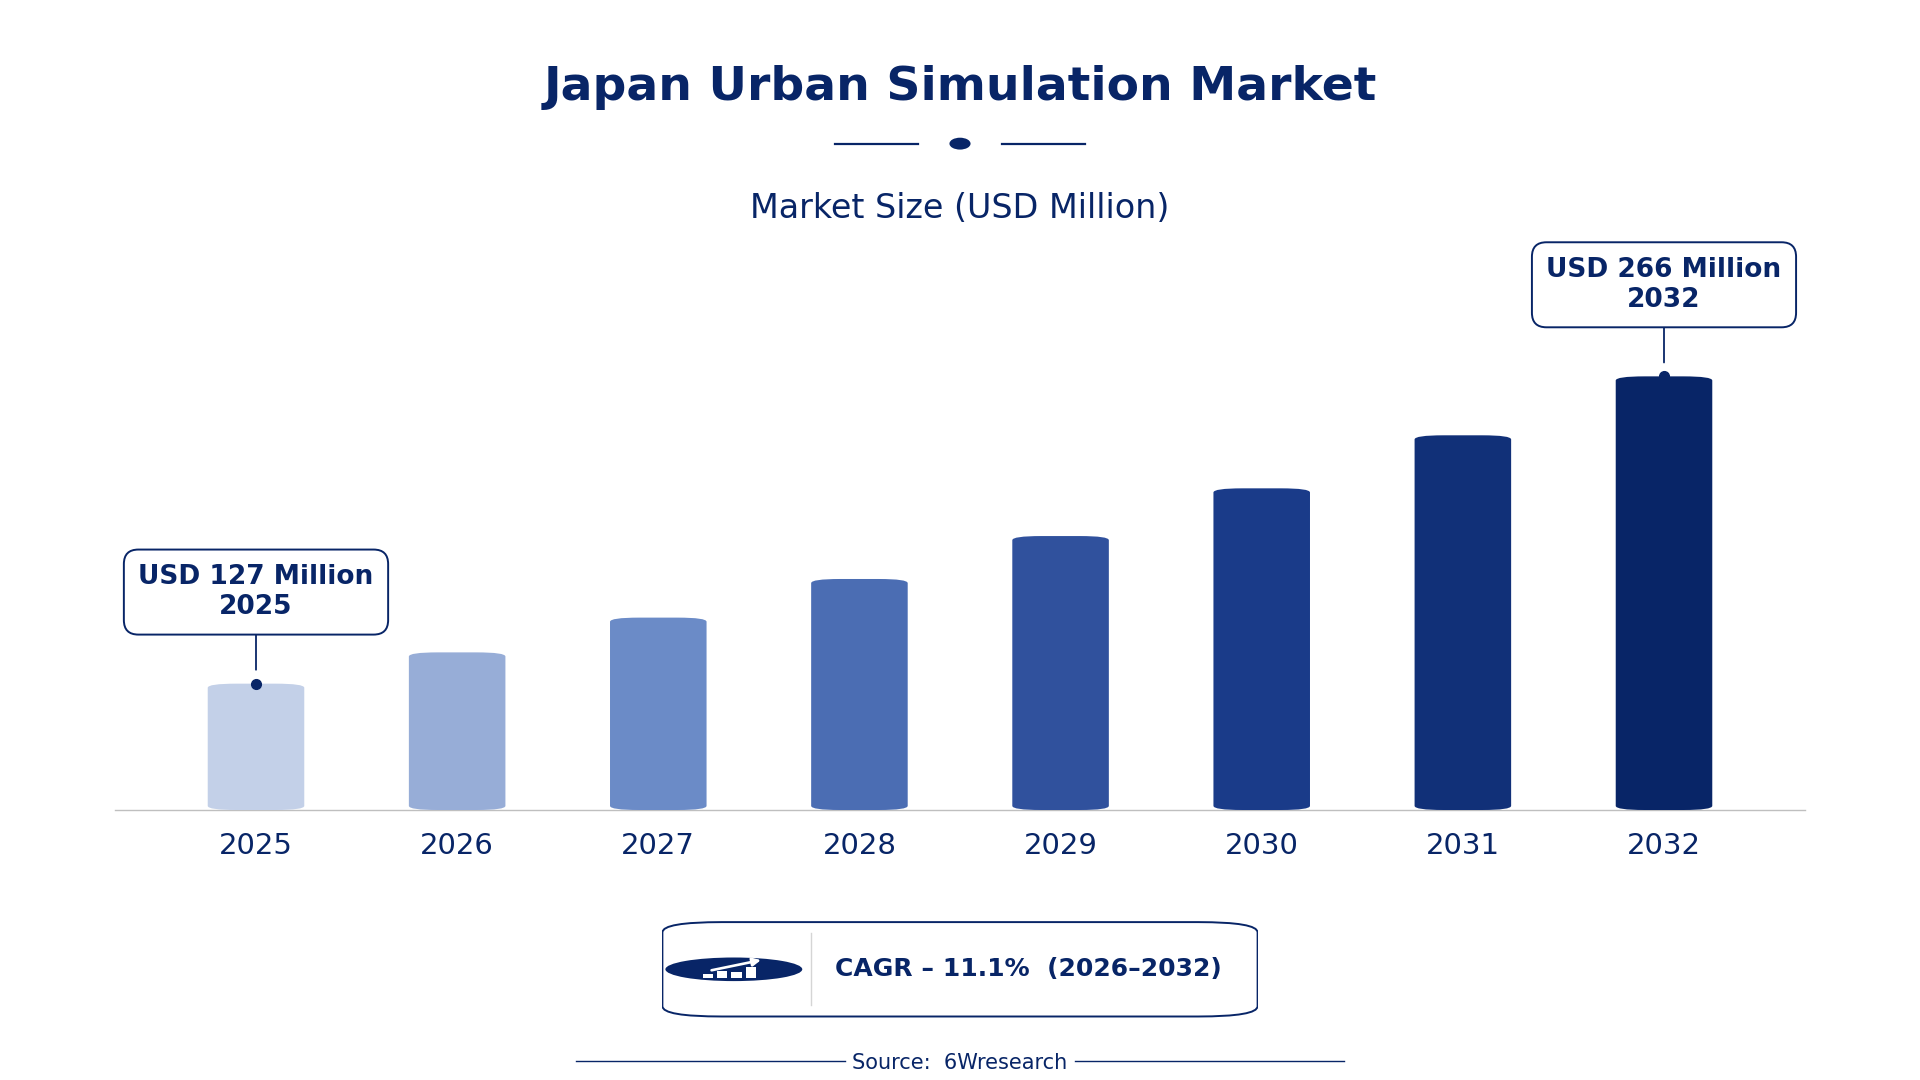
According to 6Wresearch internal database and industry insights, the Japan Urban Simulation Market was valued at USD 127 Million in 2025 and is projected to reach USD 266 Million by 2032, growing at a CAGR of approximately 11.1% during 2026–2032.
Japan Urban Simulation Market Highlights
| Report Metric | Details |
| Report Name | Japan Urban Simulation Market (2026-2032) |
| Market Size 2025 | USD 127 Million |
| Market Size 2032 | USD 266 Million |
| Absolute Growth 2025–2032 | USD 139 Million |
| CAGR 2026–2032 | 11.1% |
| Peak Annual Growth | 12.1% in 2026 |
| Forecast Period | 2026–2032 |
| Historical Data | 2022–2025 |
| Base Year | 2025 |
| Leading Simulation Type, 2025 | Traffic Flow Modeling (51% share) |
| Leading Software Platform, 2025 | Simulation Suites (SUMO) (50% share) |
| Leading Simulation Objective, 2025 | Congestion Mitigation (33% share) |
| Leading End User, 2025 | City Traffic Depts. (48% share) |
| Fastest-Growing Simulation Type | Infrastructure Stress (16.0% CAGR) |
| Fastest-Growing Software Platform | Civil CAD/FEA Tools (16.3% CAGR) |
| Fastest-Growing Simulation Objective | Stress & Load Planning (15.2% CAGR) |
| Fastest-Growing End User | Engineers (14.0% CAGR) |
| Growing Sector | Urban Planning |
| Key End Users | City Traffic Departments, Urban Developers, Public Safety Units, Engineers |
Japan Urban Simulation Market Year-wise Growth Rate and Key Drivers (2022–2032)
This graph illustrates the annual growth rates of the market from 2022 to 2032, highlighting a steady upward trajectory and projected market expansion over the forecast period.
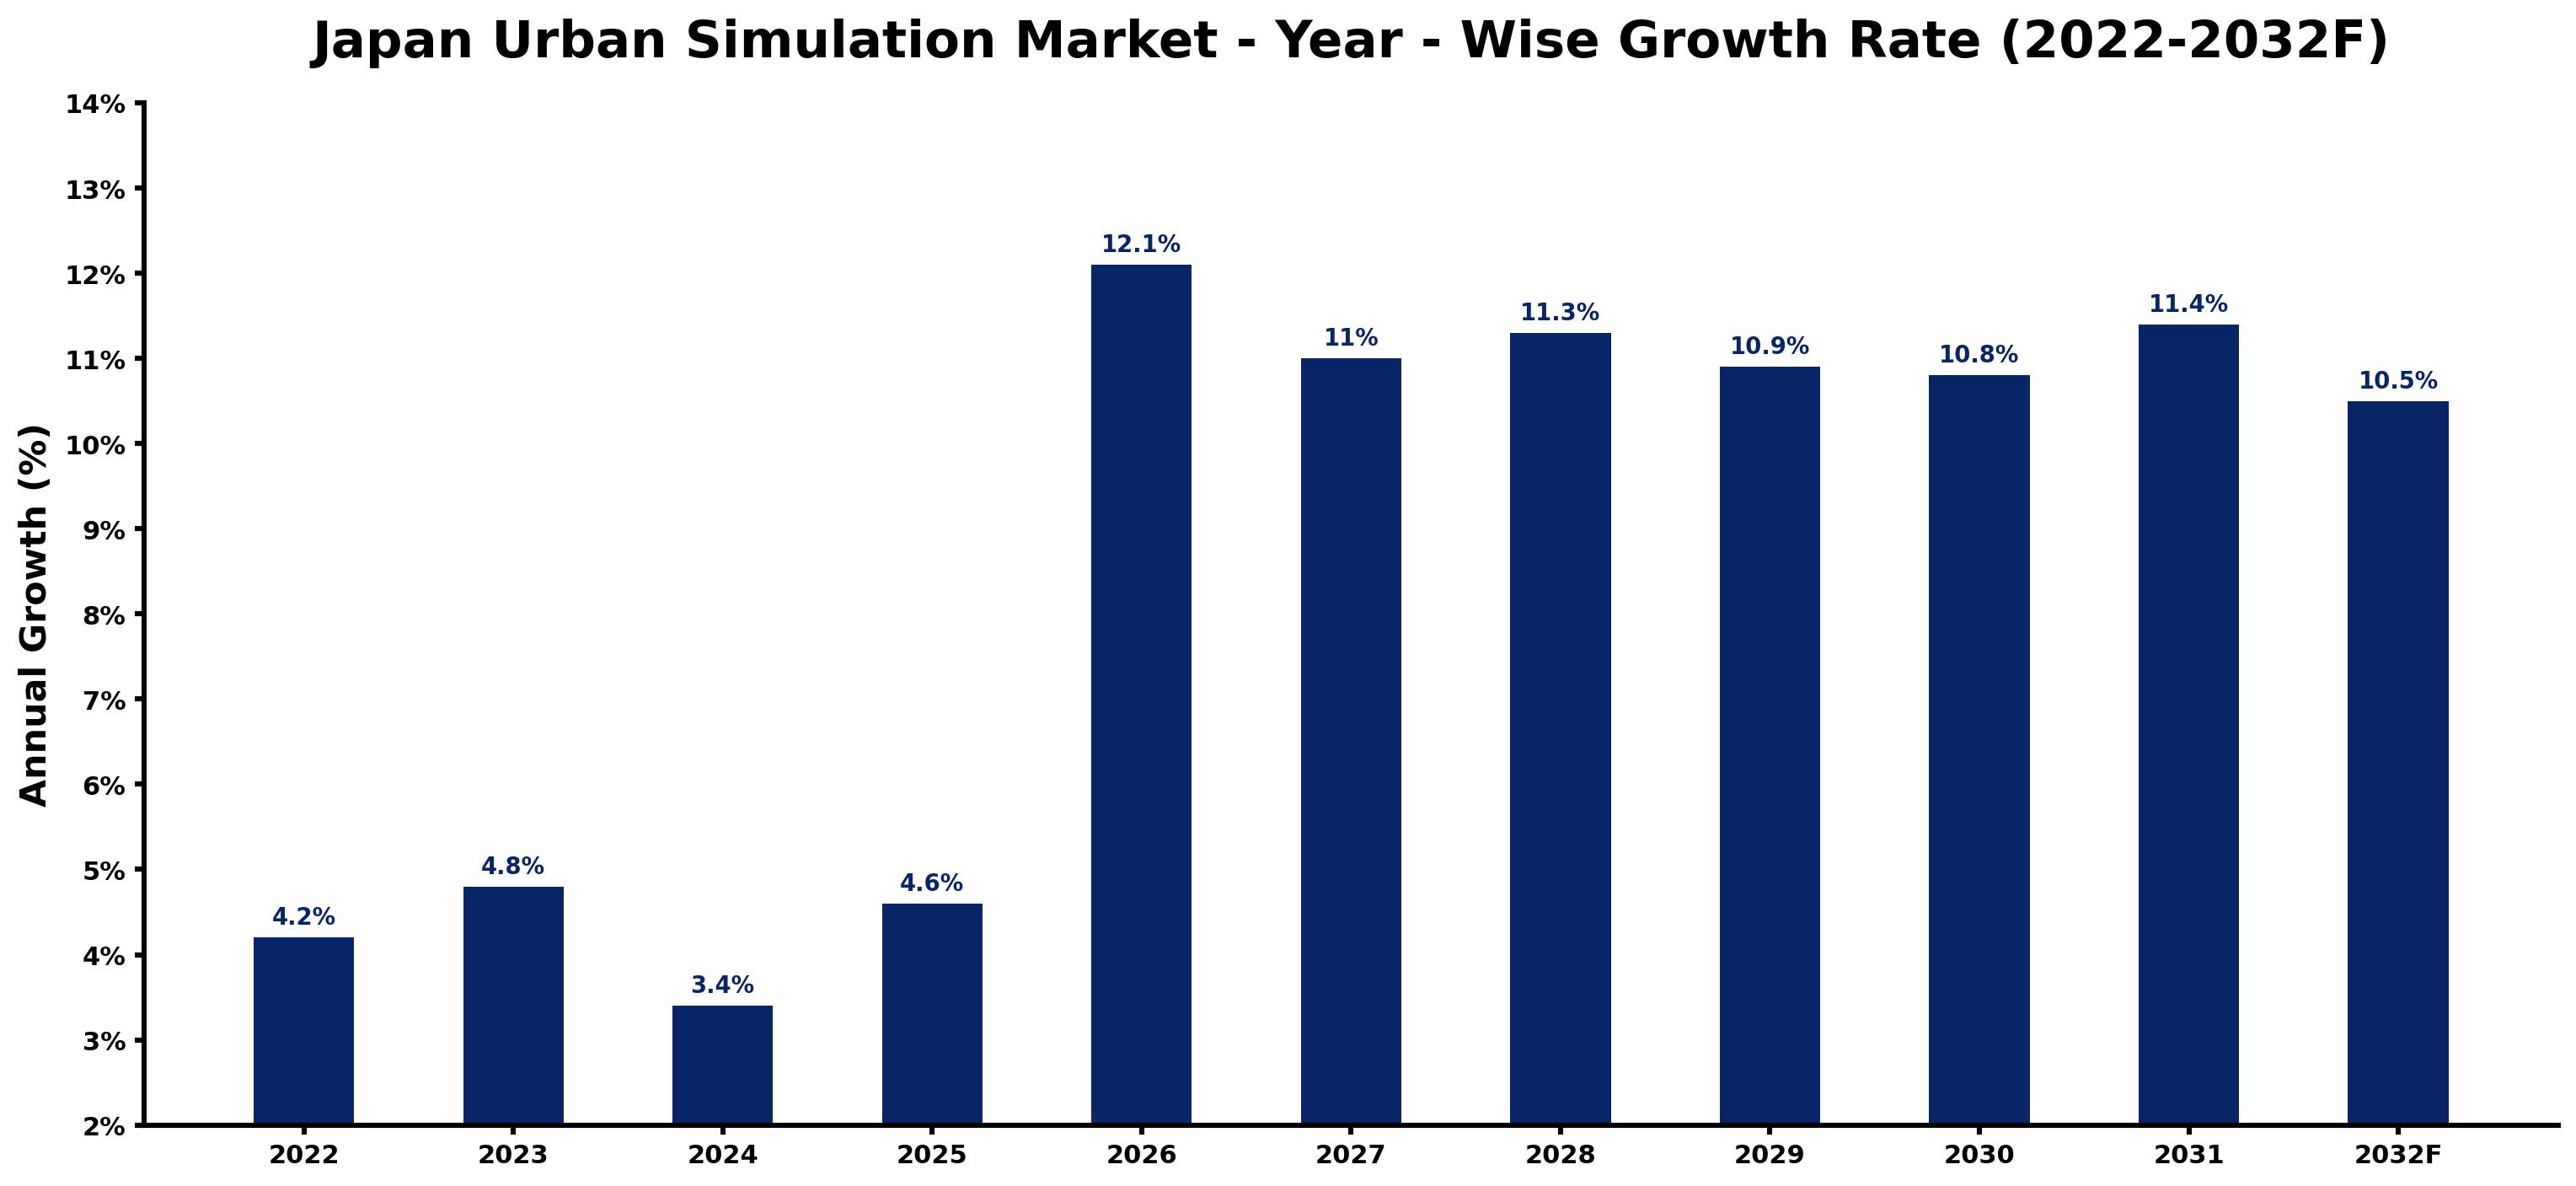
The yearly estimates that follow link every growth rate to its principal driver, so readers can see why the pace changed in each period.
| Year | Estimated Annual Growth (%) | Market Rationale |
| 2022 | 4.2 | The market experienced steady growth due to ongoing urban development projects. |
| 2023 | 4.8 | Investment in urban simulation technologies accelerated as cities prepared for major events. |
| 2024 | 3.4 | Growth slowed as some projects faced delays and budget constraints. |
| 2025 | 4.6 | Increased focus on smart city initiatives spurred demand for simulation tools. |
| 2026 | 12.1 | The peak growth year is expected to see substantial investments in disaster preparedness and urban planning. |
| 2027 | 11.0 | Demand will continue to rise, although at a slower pace as projects mature. |
| 2028 | 11.3 | Investment in infrastructure resilience will drive further growth in urban simulation. |
| 2029 | 10.9 | Growth will slow as market saturation begins to affect new project launches. |
| 2030 | 10.8 | Demand is projected to stabilise as urban simulation becomes standard practice in planning. |
| 2031 | 11.4 | Increased funding for smart city projects will revitalise growth in urban simulation. |
| 2032 | 10.5 | The market will continue to grow as cities adapt to changing urban dynamics. |
Note: Market size estimations and growth projections presented in this report are based on 6Wresearch's proprietary forecasting methodology, utilizing the latest available industry data, government publications, and primary research inputs.
Japan Urban Simulation Market Synopsis
Urban simulation utilises advanced modeling technologies to replicate various aspects of urban environments, focusing on traffic flow and infrastructure stress. It is essential for urban planning, emergency preparedness, and sustainability assessments. The Japan Urban Simulation Market is expanding due to rising investments in smart city initiatives, with city governments and urban developers driving demand. In 2023, the Tokyo Metropolitan Government allocated ¥5 billion for smart city projects, highlighting the commitment to improve urban resilience through simulation technologies.
Market Dynamics Impact Analysis (2026–2032)
| Factor | Type | Impact | Primary Segment Affected |
| Growing investment in smart city initiatives drives demand for urban simulation tools. | Driver | High | Traffic Flow Modeling |
| Increasing urbanisation necessitates advanced planning tools for infrastructure management. | Driver | High | Infrastructure Stress |
| The need for effective emergency preparedness creates opportunities for simulation technologies. | Opportunity | High | Evacuation Drills |
| Urban developers are seeking innovative solutions to enhance project planning. | Opportunity | Medium | Green Space Planning |
| Budget constraints can limit the adoption of advanced simulation technologies. | Restraint | High | Civil CAD/FEA Tools |
| Market saturation may slow the introduction of new simulation solutions. | Restraint | Medium | VR-Enabled Urban Models |
| Limited skilled workforce can hinder the implementation of advanced simulation tools. | Challenge | High | Simulation Suites (SUMO) |
| Technological integration challenges may delay project timelines. | Challenge | High | Emergency Route Testing |
Evaluation of Drivers in Japan Urban Simulation Market (2026–2032)
Key forces behind demand, with the segment each one moves most, are listed below.
| Drivers | Primary Segment Affected | Why It Matters (Evidence) |
| Increased funding for urban infrastructure projects boosts demand for simulation tools. | Traffic Flow Modeling | In 2023, the Tokyo Metropolitan Government allocated ¥5 billion for smart city initiatives, leading to more traffic simulations. |
| Rising urbanisation rates necessitate effective infrastructure stress assessments. | Infrastructure Stress | Japan's population of approximately 125 million requires advanced tools to manage urban density. |
| Growing awareness of disaster preparedness drives demand for evacuation simulations. | Evacuation Drills | The Ministry of Land, Infrastructure, Transport and Tourism promotes urban simulation for emergency scenarios. |
| Urban developers seek tools for sustainable project planning and approvals. | Green Space Planning | Simulation tools are essential for urban renewal projects, particularly in cities like Yokohama. |
| The Tokyo 2020 Olympics legacy projects highlighted the importance of urban simulation. | Civil CAD/FEA Tools | These tools are integral for assessing infrastructure durability in major urban centres. |
A wider customer base explains much of the growth, as increased funding for urban infrastructure projects boosts demand for simulation tools. Urbanisation rates necessitate effective assessments of infrastructure stress, particularly in densely populated areas. Growing awareness of disaster preparedness drives demand for evacuation simulations, with city traffic departments actively seeking tools to improve their emergency response capabilities. Engineers are increasingly pursuing simulation technologies for sustainable project planning, especially in urban renewal efforts.
Evaluation of Restraints in Japan Urban Simulation Market
Below are the constraints most often cited by buyers and suppliers, with the segment each affects.
| Market Restraint | Primary Segment Affected | Why It Matters (Evidence) |
| Budget constraints can limit the adoption of advanced simulation technologies. | Civil CAD/FEA Tools | Many city governments face financial limitations that affect technology investments. |
| Market saturation may slow the introduction of new simulation solutions. | VR-Enabled Urban Models | As more projects utilise existing technologies, demand for new solutions decreases. |
| Limited skilled workforce can hinder the implementation of advanced simulation tools. | Simulation Suites (SUMO) | A shortage of trained professionals affects the deployment of sophisticated systems. |
| Technological integration challenges may delay project timelines. | Emergency Route Testing | Complexities in integrating new technologies with existing systems can cause setbacks. |
| Regulatory hurdles can slow down the approval process for new simulation projects. | Infrastructure Stress | Compliance with local regulations can delay project initiation and execution. |
Japan Urban Simulation Market Challenges
Tokyo's traffic flow modeling faces cost issues, as the Tokyo Metropolitan Government's ¥5 billion allocation for smart city initiatives limits funding for essential urban simulation projects, delaying progress for city governments. Regulatory hurdles emerge from stringent compliance requirements imposed by local authorities, resulting in project delays of up to six months for urban planners. Technological challenges arise when many urban simulation tools lack compatibility with existing infrastructure, leading to increased costs of approximately 20% for developers needing to acquire additional software. Supply chain limitations occur as demand for advanced simulation technologies outstrips local production capacity, extending timelines for buyers.
Trends in the Japan Urban Simulation Market
Four trends stand out in the Japan Urban Simulation Market.
- Shift from Traditional to Smart Urban Planning: Japan is transitioning from conventional planning methods to smart urban simulation technologies. The Tokyo Urban Planning Council has adopted urban simulation tools for emergency preparedness, supported by a ¥5 billion investment in smart city initiatives.
- Emergence of Advanced Simulation Tools: The year 2023 marked a notable increase in the adoption of advanced simulation tools. The Urban Renaissance Agency in Japan is funding urban simulation projects, projected to improve urban planning capabilities across major cities.
- Growing Focus on Disaster Preparedness: Since 2023, urban simulation for disaster preparedness has gained prominence. The Ministry of Land, Infrastructure, Transport and Tourism has been promoting simulation tools, resulting in a surge in evacuation drill simulations across urban centres.
- Integration of AI in Urban Simulation: The integration of AI analytics in urban simulation is becoming prevalent. In Osaka, VR-enabled urban models are increasingly adopted, improving visualization and planning capabilities for urban developers.
Investment Opportunities in the Japan Urban Simulation Market
The following opportunities in the Japan Urban Simulation Market pair current demand with a clear way in.
- Gap in Advanced Simulation Adoption: With a projected market size of USD 266 million by 2032, there is a notable gap in advanced simulation adoption. Urban developers in Tokyo are seeking solutions, creating opportunities for technology providers to enter through partnerships.
- Investment in Smart City Projects: The Tokyo Metropolitan Government's ¥5 billion allocation for smart city initiatives presents a timely opportunity. Suppliers can engage with city traffic departments to provide simulation tools that improve urban planning.
- Demand for Sustainable Urban Solutions: As cities focus on sustainability, the demand for simulation tools is rising. Urban developers in Yokohama are looking for solutions that integrate sustainability metrics into their planning processes.
- Emerging Need for Emergency Preparedness Tools: With increasing urbanisation, the need for effective emergency preparedness tools is growing. Public safety units are actively seeking simulation technologies to improve their training and response capabilities.
Government Initiatives in the Japan Urban Simulation Market
The Industrial Safety and Health Act of 1972 mandates employers to ensure safety in workplaces, which affects urban simulation by requiring developers to integrate safety assessments into their projects. This law has led to increased demand for simulation tools that help identify and mitigate risks, ensuring compliance with safety standards across urban developments. Additionally, the GX Basic Policy adopted in 2023 aims for about JPY 150 trillion of public-private decarbonisation investment over the next decade, promoting the use of urban simulation technologies to improve sustainability in urban planning.
The Consumer Affairs Agency oversees compliance with regulations that ensure marketing claims for simulation tools are accurate and not misleading. In 2023, the agency approved several urban simulation projects, allocating funds to support initiatives that improve urban resilience and disaster preparedness, thus encouraging the adoption of advanced simulation technologies.
Future Insight of the Japan Urban Simulation Market
Investment in Japan's urban simulation market will increase significantly by 2032, driven by a new government programme aimed at enhancing urban resilience through simulation technologies. This shift will create robust demand for advanced modeling tools, particularly among city governments. The application of ISO 37120 standards will standardise sustainable development metrics, improving project efficiency. Enhanced adoption of immersive technologies will revolutionise urban planning processes, facilitating more interactive stakeholder engagement and informed decision-making.
Market Segmentation Analysis
Japan Urban Simulation Market report covers a detailed analysis of the following market segments:
By Simulation Type – Traffic Flow Modeling Leads, Infrastructure Stress Expected to Grow Fastest
According to Saurav Kr Singh, Senior Research Analyst at 6Wresearch, the largest simulation type category in 2025 was Traffic Flow Modeling, at 51% of revenue. Traffic flow modeling commands the largest share due to its essential function in managing urban congestion, particularly in Tokyo where significant investments are directed towards optimising traffic systems. The Tokyo Metropolitan Government's commitment to smart city initiatives highlights the critical need for effective traffic management solutions. The quickest growth will come from Infrastructure Stress, forecast to expand at a CAGR of 16.0% between 2026 and 2032. Infrastructure stress modeling is rapidly expanding in response to the increasing demand for assessing the durability of urban infrastructure, especially in disaster-prone regions. The government's recent programme to enhance urban resilience illustrates the urgency for such evaluations. Suppliers must focus on developing advanced infrastructure stress models to meet the growing demand.
By Software Platform – Simulation Suites (SUMO) Leads, Civil CAD/FEA Tools Expected to Grow Fastest
Simulation Suites (SUMO) accounted for 50% of the market by software platform in 2025. Simulation suites like SUMO dominate the market as they are extensively used for traffic simulations across major Japanese cities, providing crucial data for urban planning efforts. Their integration into urban traffic management systems reinforces their importance for city traffic departments. Civil CAD/FEA Tools are set to record the highest CAGR in this split, 16.3% over 2026–2032. Civil CAD/FEA tools are experiencing rapid growth as they are vital for engineering assessments, particularly with the rising focus on infrastructure resilience. Their increasing adoption aligns with urban developers' needs for precise modelling capabilities in complex projects. Buyers should consider investing in advanced civil CAD tools to enhance their engineering assessments and project outcomes.
By Simulation Objective – Congestion Mitigation Leads, Stress & Load Planning Expected to Grow Fastest
With 33% of simulation objective revenue in 2025, Congestion Mitigation was the largest category. Congestion mitigation is the leading objective as it directly aims at reducing traffic congestion, which is a pressing issue in densely populated areas like Tokyo. The focus on this objective is reinforced by city traffic departments prioritising effective traffic management solutions. Over 2026–2032, Stress & Load Planning is expected to post the fastest growth, at a CAGR of 15.2%. Stress and load planning is the fastest-growing objective due to the increasing focus on infrastructure resilience in urban areas. The emphasis on this objective is further supported by recent government initiatives aimed at improving urban infrastructure. Suppliers must align their offerings with the growing focus on stress and load planning to capture emerging opportunities.
By End User – City Traffic Depts. Leads, Engineers Expected to Grow Fastest
City Traffic Depts. took 48% of end user revenue in 2025, more than any other category. City traffic departments represent the largest user group of urban simulation tools, primarily for traffic management, solidifying their leading position in the market. Their continuous requirement for effective congestion solutions guarantees a steady demand for simulation technologies. Engineers are projected to grow fastest, at a CAGR of 14.0% during 2026–2032. Engineers are witnessing the fastest growth as they increasingly utilise simulations for design and planning, driven by the need for effective solutions in urban development. This trend is expected to continue as urban projects become more complex and extensive. Suppliers should concentrate on providing tailored solutions for engineers to capitalise on this expanding user base.
Key Attractiveness of the Report
- 10 Years of Market Numbers
- Historical Data Starting from 2022 to 2025
- Base Year 2025
- Forecast Data until 2032
- Key Performance Indicators Impacting the Market
- Major Upcoming Developments and Projects
Key Highlights of the Report:
- Japan Urban Simulation Market Outlook
- Market Size of Japan Urban Simulation Market, 2025
- Forecast of Japan Urban Simulation Market, 2032
- Historical Data and Forecast of Japan Urban Simulation Revenues & Volume for the Period 2022-2032F
- Japan Urban Simulation Market Trend Evolution
- Japan Urban Simulation Market Drivers and Challenges
- Japan Urban Simulation Price Trends
- Japan Urban Simulation Porter's Five Forces
- Japan Urban Simulation Industry Life Cycle
- Historical Data and Forecast of Japan Urban Simulation Market Revenues & Volume By Simulation Type for the Period 2022-2032F
- Historical Data and Forecast of Japan Urban Simulation Market Revenues & Volume By Traffic Flow Modeling for the Period 2022-2032F
- Historical Data and Forecast of Japan Urban Simulation Market Revenues & Volume By Infrastructure Stress for the Period 2022-2032F
- Historical Data and Forecast of Japan Urban Simulation Market Revenues & Volume By Evacuation Drills for the Period 2022-2032F
- Historical Data and Forecast of Japan Urban Simulation Market Revenues & Volume By Green Space Planning for the Period 2022-2032F
- Historical Data and Forecast of Japan Urban Simulation Market Revenues & Volume By Software Platform for the Period 2022-2032F
- Historical Data and Forecast of Japan Urban Simulation Market Revenues & Volume By Simulation Suites (SUMO) for the Period 2022-2032F
- Historical Data and Forecast of Japan Urban Simulation Market Revenues & Volume By Civil CAD/FEA Tools for the Period 2022-2032F
- Historical Data and Forecast of Japan Urban Simulation Market Revenues & Volume By VR-Enabled Urban Models for the Period 2022-2032F
- Historical Data and Forecast of Japan Urban Simulation Market Revenues & Volume By Satellite + AI Analytics for the Period 2022-2032F
- Historical Data and Forecast of Japan Urban Simulation Market Revenues & Volume By Simulation Objective for the Period 2022-2032F
- Historical Data and Forecast of Japan Urban Simulation Market Revenues & Volume By Congestion Mitigation for the Period 2022-2032F
- Historical Data and Forecast of Japan Urban Simulation Market Revenues & Volume By Stress & Load Planning for the Period 2022-2032F
- Historical Data and Forecast of Japan Urban Simulation Market Revenues & Volume By Emergency Route Testing for the Period 2022-2032F
- Historical Data and Forecast of Japan Urban Simulation Market Revenues & Volume By Sustainability Simulation for the Period 2022-2032F
- Historical Data and Forecast of Japan Urban Simulation Market Revenues & Volume By End User for the Period 2022-2032F
- Historical Data and Forecast of Japan Urban Simulation Market Revenues & Volume By City Traffic Depts. for the Period 2022-2032F
- Historical Data and Forecast of Japan Urban Simulation Market Revenues & Volume By Engineers for the Period 2022-2032F
- Historical Data and Forecast of Japan Urban Simulation Market Revenues & Volume By Public Safety Units for the Period 2022-2032F
- Historical Data and Forecast of Japan Urban Simulation Market Revenues & Volume By Urban Developers for the Period 2022-2032F
- Japan Urban Simulation Import Export Trade Statistics
- Market Opportunity Assessment By Simulation Type
- Market Opportunity Assessment By Software Platform
- Market Opportunity Assessment By Simulation Objective
- Market Opportunity Assessment By End User
- Japan Urban Simulation Top Companies Market Share
- Japan Urban Simulation Competitive Benchmarking By Technical and Operational Parameters
- Japan Urban Simulation Company Profiles
- Japan Urban Simulation Key Strategic Recommendations
Market Covered
The report covers the following segments.
By Simulation Type
- Traffic Flow Modeling
- Infrastructure Stress
- Evacuation Drills
- Green Space Planning
By Software Platform
- Simulation Suites (SUMO)
- Civil CAD/FEA Tools
- VR-Enabled Urban Models
- Satellite + AI Analytics
By Simulation Objective
- Congestion Mitigation
- Stress & Load Planning
- Emergency Route Testing
- Sustainability Simulation
By End User
- City Traffic Depts.
- Engineers
- Public Safety Units
- Urban Developers































