Japan Visualization Software Market Size & Growth Rate
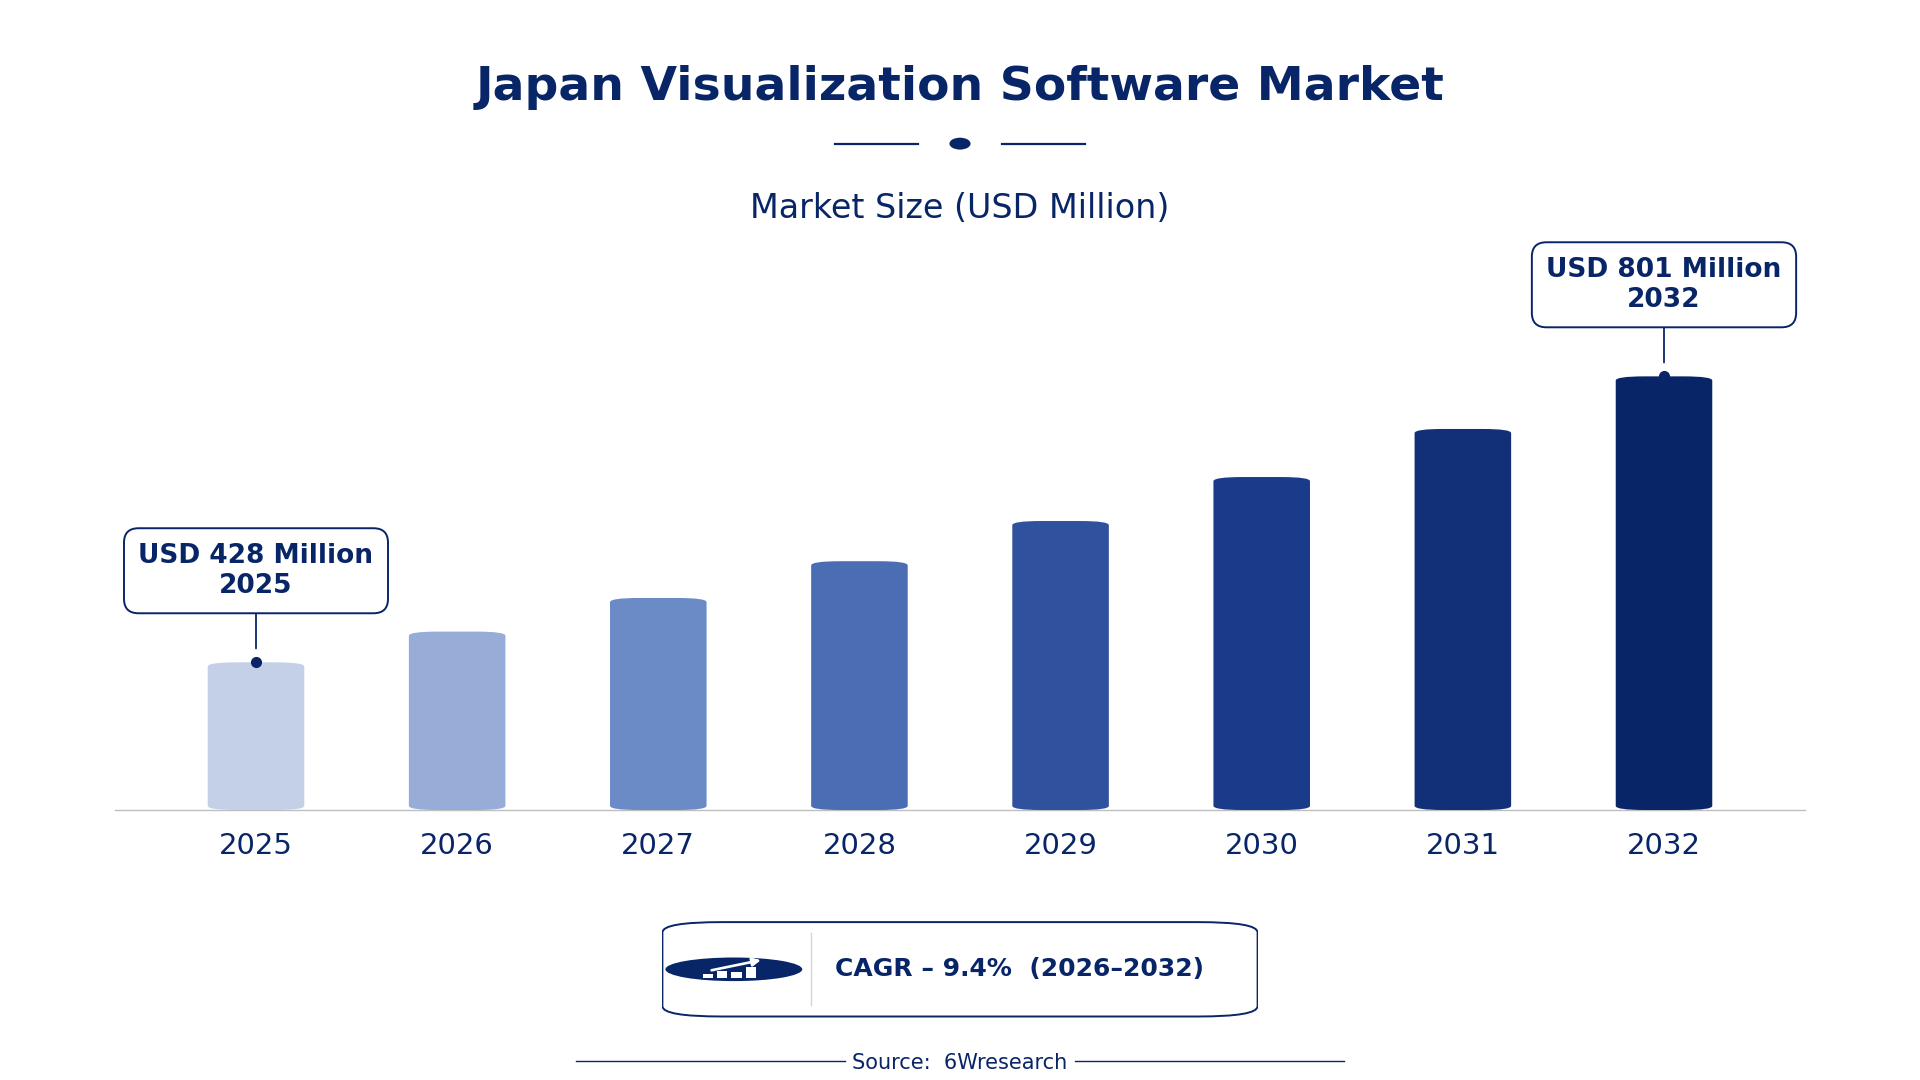
According to 6Wresearch internal database and industry insights, the Japan Visualization Software Market was valued at USD 428 Million in 2025 and is projected to reach USD 801 Million by 2032, growing at a CAGR of approximately 9.4% during 2026–2032.
Japan Visualization Software Market Highlights
| Report Metric | Details |
| Report Name | Japan Visualization Software Market (2026-2032) |
| Market Size 2025 | USD 428 Million |
| Market Size 2032 | USD 801 Million |
| Absolute Growth 2025–2032 | USD 373 Million |
| CAGR 2026–2032 | 9.4% |
| Peak Annual Growth | 10.2% in 2032 |
| Forecast Period | 2026–2032 |
| Historical Data | 2022–2025 |
| Base Year | 2025 |
| Leading Software Type, 2025 | Business Intelligence (37% share) |
| Leading Data Type Supported, 2025 | Real-time Analytics (48% share) |
| Leading Pricing Model, 2025 | Subscription (42% share) |
| Leading Platform Support, 2025 | Cross-platform (36% share) |
| Fastest-Growing Software Type | Scientific Viz Tool (14.6% CAGR) |
| Fastest-Growing Data Type Supported | Research Datasets (13.9% CAGR) |
| Fastest-Growing Pricing Model | One-time License (12.6% CAGR) |
| Fastest-Growing Platform Support | Windows/Linux (14.1% CAGR) |
| Growing Sector | Healthcare |
| Key End Users | Healthcare providers, educational institutions, businesses, research organisations |
Japan Visualization Software Market Year-wise Growth Rate and Key Drivers (2022–2032)
This graph illustrates the annual growth rates of the market from 2022 to 2032, highlighting a steady upward trajectory and projected market expansion over the forecast period.
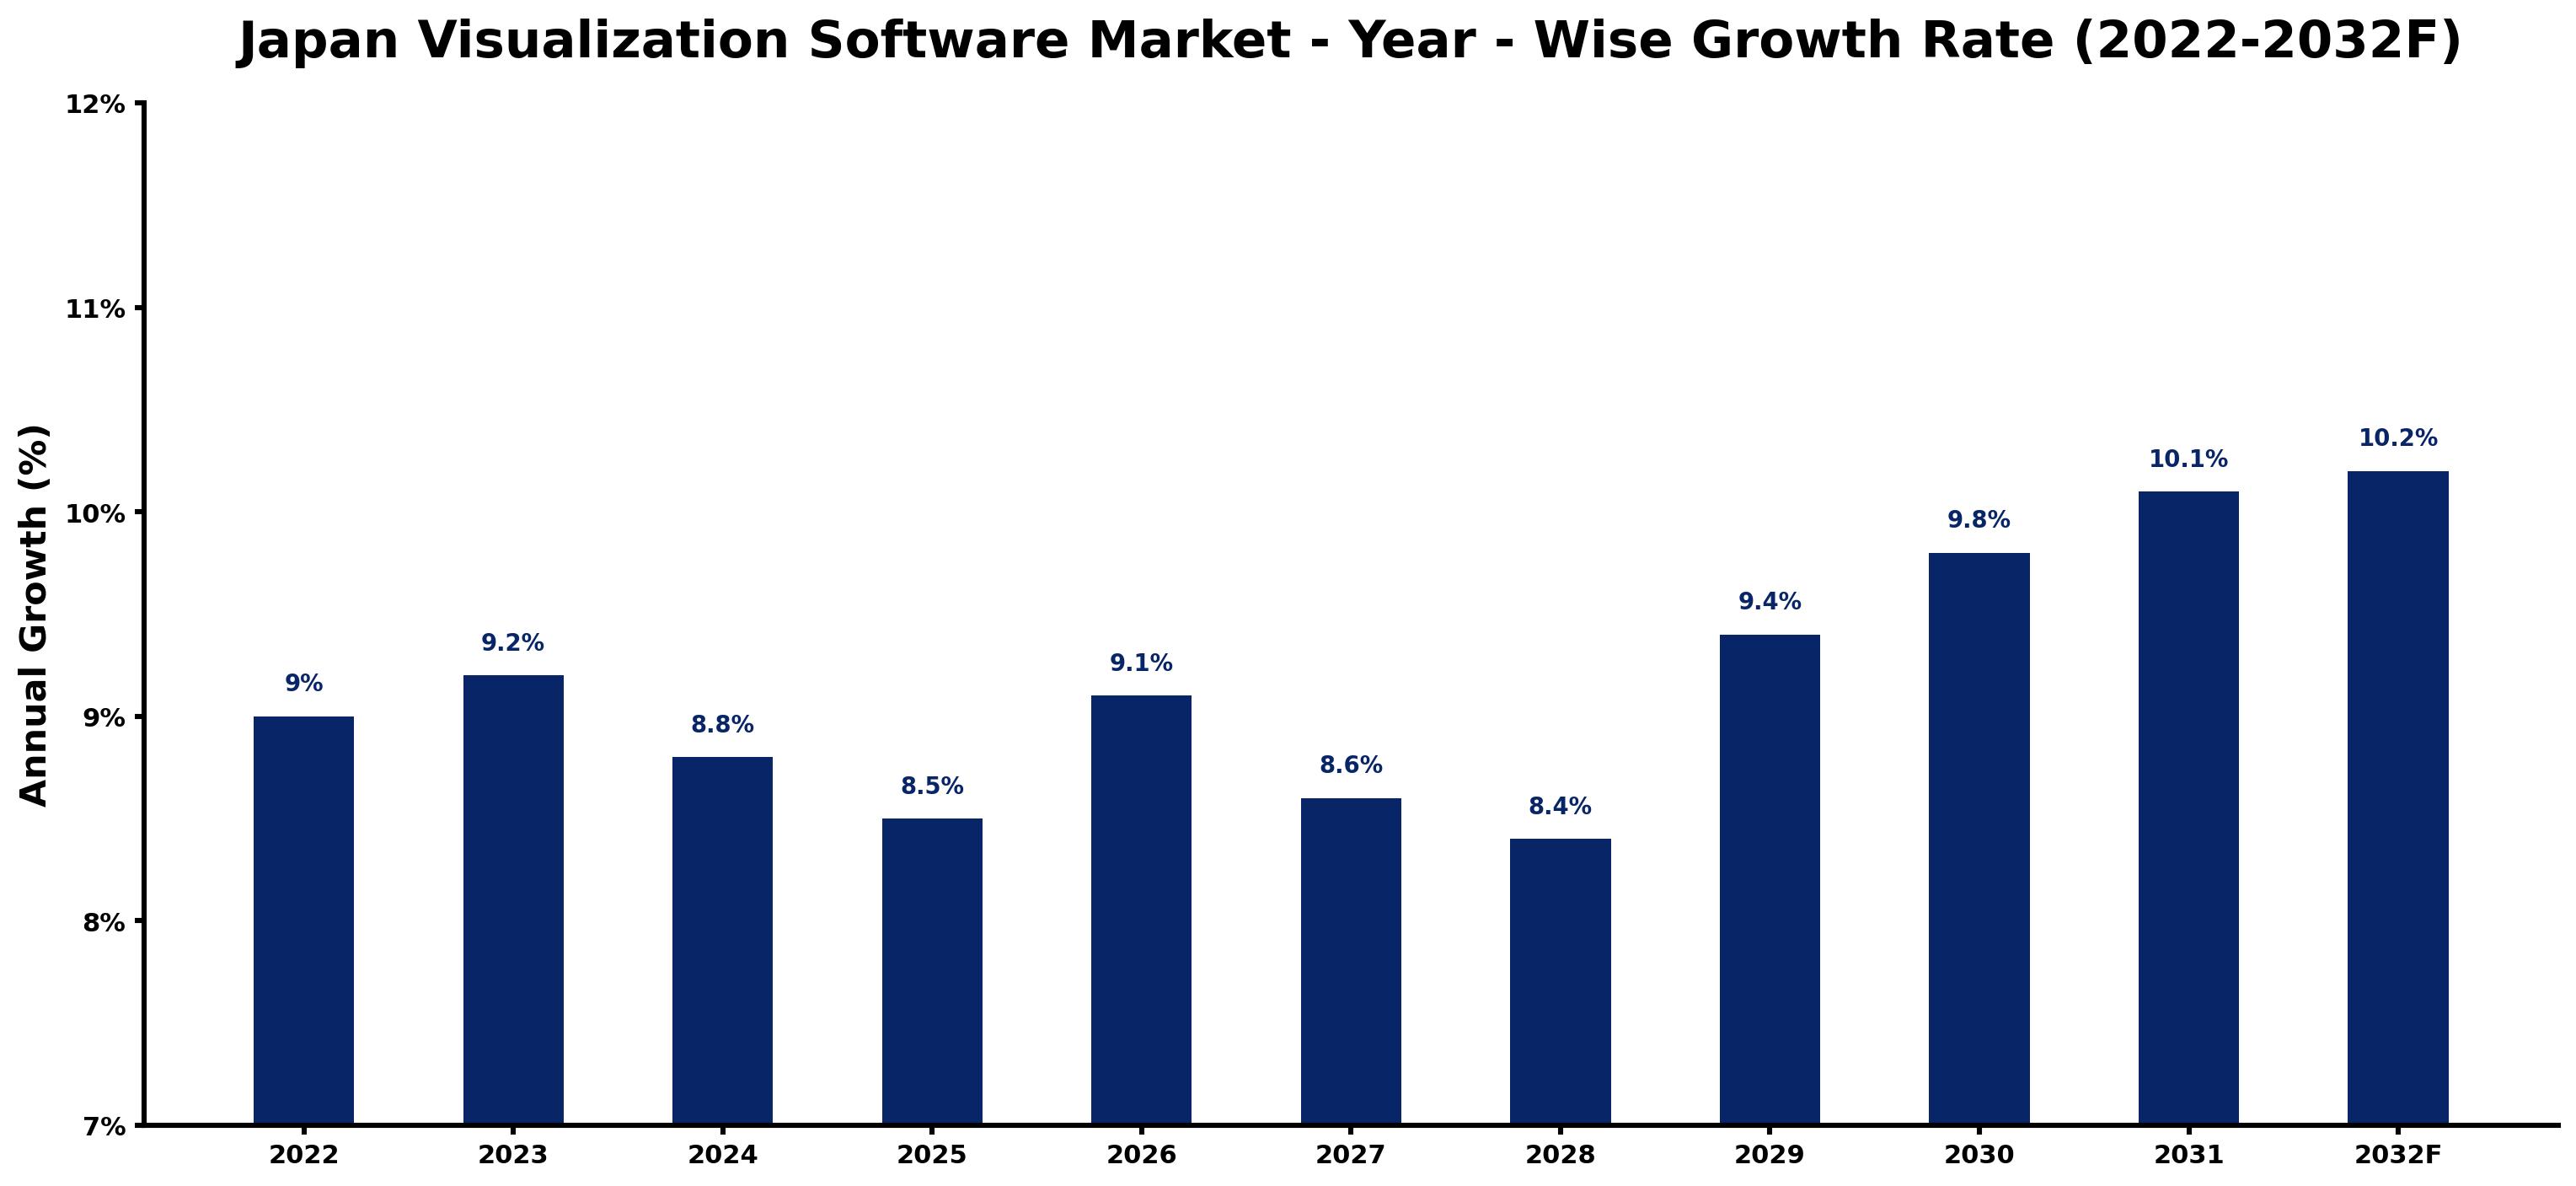
The yearly estimates that follow link every growth rate to its principal driver, so readers can see why the pace changed in each period.
| Year | Estimated Annual Growth (%) | Market Rationale |
| 2022 | 9.0 | The market experienced solid growth, driven by increased data demands across sectors. |
| 2023 | 9.2 | Growth accelerated as businesses invested more in data visualization tools for analytics. |
| 2024 | 8.8 | Growth slowed slightly due to market saturation in certain segments. |
| 2025 | 8.5 | A further slowdown occurred as competition intensified among software providers. |
| 2026 | 9.1 | Demand is expected to rebound as companies focus on data-driven decision-making capabilities. |
| 2027 | 8.6 | Growth is projected to decelerate as the market adjusts to evolving technological trends. |
| 2028 | 8.4 | A continued slowdown is anticipated as market maturity sets in. |
| 2029 | 9.4 | Demand is expected to surge as new applications for visualization emerge in various industries. |
| 2030 | 9.8 | Growth is projected to continue as investment in AI technologies expands. |
| 2031 | 10.1 | The market is expected to experience strong growth as healthcare increasingly adopts visualization tools. |
| 2032 | 10.2 | A peak growth rate is anticipated due to widespread adoption across all sectors. |
Note: Market size estimations and growth projections presented in this report are based on 6Wresearch's proprietary forecasting methodology, utilizing the latest available industry data, government publications, and primary research inputs.
Japan Visualization Software Market Synopsis
Visualization software enables users to create visual representations of data, essential for business intelligence, scientific research, and medical imaging. The Japan Visualization Software Market is expanding, driven by the healthcare sector's increasing reliance on medical imaging tools, which accounted for over 30% of usage in 2022. The Tokyo region, representing 40% of demand, is a hub for software development, while a national investment of 1 trillion yen in AI and data analytics further propels market growth.
Market Dynamics Impact Analysis (2026–2032)
| Factor | Type | Impact | Primary Segment Affected |
| Increased demand for business intelligence tools | Driver | High | Business Intelligence |
| Growing reliance on medical imaging software | Driver | High | Medical Imaging |
| Rising demand for real-time analytics capabilities | Opportunity | High | Real-time Analytics |
| Expansion of cloud-based solutions in enterprises | Opportunity | High | SaaS |
| Intense competition among software providers | Restraint | Medium | Business Intelligence |
| Market saturation in certain software segments | Restraint | Medium | 3D Data Viz |
| Limited awareness of advanced visualization tools | Challenge | Medium | Scientific Viz Tool |
| High costs associated with software development | Challenge | Medium | Medical Imaging |
Evaluation of Drivers in Japan Visualization Software Market (2026–2032)
Key forces behind demand, with the segment each one moves most, are listed below.
| Drivers | Primary Segment Affected | Why It Matters (Evidence) |
| Increased investment in data analytics | Business Intelligence | Over 60% of businesses in Japan use business intelligence software, driving demand for advanced tools. |
| Growing healthcare sector adoption | Medical Imaging | The healthcare sector utilized over 30% of medical imaging software in 2022, boosting market growth. |
| Rising need for immediate data-driven decisions | Real-time Analytics | The demand for real-time analytics is increasing as businesses seek operational efficiency, enhancing productivity. |
| Cloud adoption for scalability | SaaS | The Cloud Computing Association of Japan promotes cloud-based solutions, increasing software accessibility across sectors. |
| Focus on data literacy programs | Scientific Viz Tool | The Ministry of Education promotes data literacy, encouraging the use of scientific visualization tools in schools. |
Orders keep climbing as the demand for visualization tools rises in Japan. In 2023, the healthcare sector accounted for over 30% of medical imaging software usage, prompting hospitals to invest in advanced visualization technologies. The Tokyo region, representing 40% of demand, drives software development, while more than 60% of businesses utilise business intelligence tools to improve decision-making. Investment in AI and data analytics reached 1 trillion yen in 2023, further stimulating demand for real-time analytics capabilities. The push for data literacy is encouraging educational institutions to adopt scientific visualization tools, expanding user bases.
Evaluation of Restraints in Japan Visualization Software Market
These restraints slow adoption and weigh on supplier margins.
| Market Restraint | Primary Segment Affected | Why It Matters (Evidence) |
| High competition leading to price wars | Business Intelligence | Intense competition among providers has resulted in price reductions, impacting profitability by up to 15%. |
| Limited market awareness of advanced tools | Scientific Viz Tool | Many potential users remain unaware of the benefits of advanced scientific visualization technologies, limiting adoption. |
| Market saturation in specific software areas | 3D Data Viz | Saturation has led to diminished growth opportunities in the 3D data visualization segment, affecting new entrants. |
| High development costs for custom solutions | Medical Imaging | Developing tailored medical imaging software incurs substantial costs, limiting market entry for smaller firms. |
| Slow adoption of new technologies | Real-time Analytics | Some sectors are hesitant to adopt real-time analytics due to perceived complexity, hindering growth. |
Japan Visualization Software Market Challenges
Buyers in the healthcare sector face a skills gap in data visualization, as many professionals lack the necessary training, which delays project timelines and increases costs by up to 20%. Rising operational costs burden suppliers, with Japan's national minimum wage increasing to JPY 1,055 per hour, leading to higher software development expenses. Technology adoption remains limited, as only 60% of businesses are currently using visualization tools, restricting innovation and efficiency for producers. Increased competition from new entrants pressures established firms to lower prices, potentially reducing profit margins by 15% for suppliers.
Trends in the Japan Visualization Software Market
The following changes are redrawing the Japan Visualization Software Market.
- Rise in Cloud-Based Solutions: In 2023, cloud-based visualization software adoption reached over 40% among enterprises, allowing for greater scalability and accessibility. This trend benefits businesses in various sectors, enhancing their operational capabilities.
- Increase in Real-Time Analytics Adoption: The demand for real-time analytics tools is rising, particularly in the Tokyo region, where businesses are increasingly relying on immediate data insights. This trend is expected to grow as companies seek competitive advantages in their operations.
- Focus on Data Literacy Initiatives: The Ministry of Education's initiatives to improve data literacy are transforming educational institutions in Japan, with over 1,000 participants attending the annual Data Visualization Summit. This focus on education is driving software adoption across various sectors.
- Growth in Medical Imaging Applications: The healthcare sector is increasingly adopting advanced medical imaging software, with projections indicating it will account for 25% of the visualization software market by 2025. This growth is driven by the need for improved diagnostics and patient care.
Investment Opportunities in the Japan Visualization Software Market
The opportunities below stand out in the Japan Visualization Software Market for new entrants and existing suppliers.
- Demand for Advanced Medical Imaging Tools: Healthcare providers are seeking advanced medical imaging software, with the sector expected to account for 25% of the market by 2025. Collaborating with local hospitals can facilitate entry into this growing segment.
- Need for Data Visualization in Education: Educational institutions are investing in data visualization tools to improve learning outcomes, with over 30% of the market potential. Partnering with universities can open new opportunities for suppliers.
- Growing Demand for Real-Time Analytics Solutions: The demand for real-time analytics tools is projected to grow, with 1 trillion yen invested in AI and data analytics in 2023. Suppliers can enter through partnerships with tech firms to meet this need.
- Opportunities in Cloud-Based Solutions: With the Cloud Computing Association promoting cloud-based solutions, there is a significant opportunity for suppliers to provide scalable visualization software. Engaging with local tech startups can ease market entry.
Government Initiatives in the Japan Visualization Software Market
The AI Promotion Act (2025) establishes a national framework for AI research and development, impacting visualization software producers by establishing standards for quality and innovation. This act encourages investment in advanced technologies, benefiting software developers and users alike, with a focus on enhancing capabilities across sectors.
The Digital Agency, established in September 2021, leads government digital transformation efforts and promotes common system standards. This agency assists businesses in adopting visualization software, ensuring compliance with national standards and improving digital capabilities, thereby facilitating better integration of technology in various sectors.
Future Insight of the Japan Visualization Software Market
The launch of enhanced digital transformation programs for SMEs will drive significant advancements in software capabilities by 2032. Investment in AI and data analytics is set to continue, reaching 1 trillion yen in 2023, which will lead to improved visualization tools. The Japan Data Science Society will support the establishment of quality standards, ensuring reliability in software offerings. By 2025, the healthcare sector is expected to account for 25% of the visualization software market, reflecting a growing emphasis on data-driven decision-making across multiple sectors.
Market Segmentation Analysis
Japan Visualization Software Market report covers a detailed analysis of the following market segments:
By Software Type – Business Intelligence Leads, Scientific Viz Tool Expected to Grow Fastest
According to Saurav Kr Singh, Senior Research Analyst at 6Wresearch, with 37% of software type revenue in 2025, Business Intelligence was the largest category. Business intelligence tools dominate the market due to their extensive application in data analysis and reporting across various sectors. Notably, over 60% of businesses in Japan rely on these tools for making informed decisions based on data insights. The quickest growth will come from Scientific Viz Tool, forecast to expand at a CAGR of 14.6% between 2026 and 2032. The scientific visualization tool segment is experiencing rapid growth as researchers increasingly seek advanced capabilities for visualising complex datasets. This demand is exemplified by the Tokyo Institute of Technology's commitment to utilising these tools in their research activities. Suppliers should prioritise the development of features in scientific visualization tools to capture the growing research market.
By Data Type Supported – Real-time Analytics Leads, Research Datasets Expected to Grow Fastest
In 2025, Real-time Analytics led the data type supported split with a 48% share. Real-time analytics holds the largest share as it is crucial for businesses that require immediate insights for effective decision-making. This is especially relevant in sectors like finance and retail, where timely data can significantly impact operations. Research Datasets are projected to grow fastest, at a CAGR of 13.9% during 2026–2032. Research datasets are growing quickly as academic institutions and researchers strive to leverage data for scientific advancements. The efforts of the Japan Data Science Society highlight the increasing importance of these datasets in research environments. Buyers will benefit from solutions that offer robust support for real-time analytics to enhance operational efficiency.
By Pricing Model – Subscription Leads, One-time License Expected to Grow Fastest
Subscription accounted for 42% of the market by pricing model in 2025. The subscription model leads the market as it provides businesses with continuous access to software updates and support, making it a preferred choice. This model aligns well with the ongoing need for businesses to stay current with evolving software capabilities. Over 2026–2032, One-time License is expected to post the fastest growth, at a CAGR of 12.6%. The one-time license model is gaining traction for specific software purchases, particularly among smaller firms that prefer a single payment. This trend reflects a shift towards more flexible purchasing options for niche applications. Suppliers should consider offering flexible pricing structures to cater to diverse customer preferences.
By Platform Support – Cross-platform Leads, Windows/Linux Expected to Grow Fastest
Cross-platform held 36% of the Japan Visualization Software Market by platform support in 2025. Cross-platform support is essential as it ensures that software can be accessed on various operating systems, which is critical for user adoption. This broad accessibility is particularly important in a diverse market like Japan, where different platforms are prevalent. Windows/Linux is set to record the highest CAGR in this split, 14.1% over 2026–2032. Windows/Linux support is rapidly growing due to the popularity of these operating systems among both businesses and individual users. This trend is driven by the high concentration of software development companies in the Tokyo metropolitan area. Suppliers must ensure compatibility with multiple platforms to capture a wider customer base.
Key Attractiveness of the Report
- 10 Years of Market Numbers
- Historical Data Starting from 2022 to 2025
- Base Year 2025
- Forecast Data until 2032
- Key Performance Indicators Impacting the Market
- Major Upcoming Developments and Projects
Key Highlights of the Report:
- Japan Visualization Software Market Outlook
- Market Size of Japan Visualization Software Market, 2025
- Forecast of Japan Visualization Software Market, 2032
- Historical Data and Forecast of Japan Visualization Software Revenues & Volume for the Period 2022-2032F
- Japan Visualization Software Market Trend Evolution
- Japan Visualization Software Market Drivers and Challenges
- Japan Visualization Software Price Trends
- Japan Visualization Software Porter's Five Forces
- Japan Visualization Software Industry Life Cycle
- Historical Data and Forecast of Japan Visualization Software Market Revenues & Volume By Software Type for the Period 2022-2032F
- Historical Data and Forecast of Japan Visualization Software Market Revenues & Volume By Business Intelligence for the Period 2022-2032F
- Historical Data and Forecast of Japan Visualization Software Market Revenues & Volume By Scientific Viz Tool for the Period 2022-2032F
- Historical Data and Forecast of Japan Visualization Software Market Revenues & Volume By Medical Imaging for the Period 2022-2032F
- Historical Data and Forecast of Japan Visualization Software Market Revenues & Volume By 3D Data Viz for the Period 2022-2032F
- Historical Data and Forecast of Japan Visualization Software Market Revenues & Volume By Data Type Supported for the Period 2022-2032F
- Historical Data and Forecast of Japan Visualization Software Market Revenues & Volume By Real-time Analytics for the Period 2022-2032F
- Historical Data and Forecast of Japan Visualization Software Market Revenues & Volume By Research Datasets for the Period 2022-2032F
- Historical Data and Forecast of Japan Visualization Software Market Revenues & Volume By Radiographic Data for the Period 2022-2032F
- Historical Data and Forecast of Japan Visualization Software Market Revenues & Volume By Spatial Data for the Period 2022-2032F
- Historical Data and Forecast of Japan Visualization Software Market Revenues & Volume By Pricing Model for the Period 2022-2032F
- Historical Data and Forecast of Japan Visualization Software Market Revenues & Volume By Subscription for the Period 2022-2032F
- Historical Data and Forecast of Japan Visualization Software Market Revenues & Volume By One-time License for the Period 2022-2032F
- Historical Data and Forecast of Japan Visualization Software Market Revenues & Volume By Freemium for the Period 2022-2032F
- Historical Data and Forecast of Japan Visualization Software Market Revenues & Volume By SaaS for the Period 2022-2032F
- Historical Data and Forecast of Japan Visualization Software Market Revenues & Volume By Platform Support for the Period 2022-2032F
- Historical Data and Forecast of Japan Visualization Software Market Revenues & Volume By Cross-platform for the Period 2022-2032F
- Historical Data and Forecast of Japan Visualization Software Market Revenues & Volume By Windows/Linux for the Period 2022-2032F
- Historical Data and Forecast of Japan Visualization Software Market Revenues & Volume By Desktop for the Period 2022-2032F
- Historical Data and Forecast of Japan Visualization Software Market Revenues & Volume By Cloud for the Period 2022-2032F
- Japan Visualization Software Import Export Trade Statistics
- Market Opportunity Assessment By Software Type
- Market Opportunity Assessment By Data Type Supported
- Market Opportunity Assessment By Pricing Model
- Market Opportunity Assessment By Platform Support
- Japan Visualization Software Top Companies Market Share
- Japan Visualization Software Competitive Benchmarking By Technical and Operational Parameters
- Japan Visualization Software Company Profiles
- Japan Visualization Software Key Strategic Recommendations
Market Covered
This report examines the market across the segments below.
By Software Type
- Business Intelligence
- Scientific Viz Tool
- Medical Imaging
- 3D Data Viz
By Data Type Supported
- Real-time Analytics
- Research Datasets
- Radiographic Data
- Spatial Data
By Pricing Model
- Subscription
- One-time License
- Freemium
- SaaS
By Platform Support
- Cross-platform
- Windows/Linux
- Desktop
- Cloud































