Japan Wearable AR Devices Market Size & Growth Rate
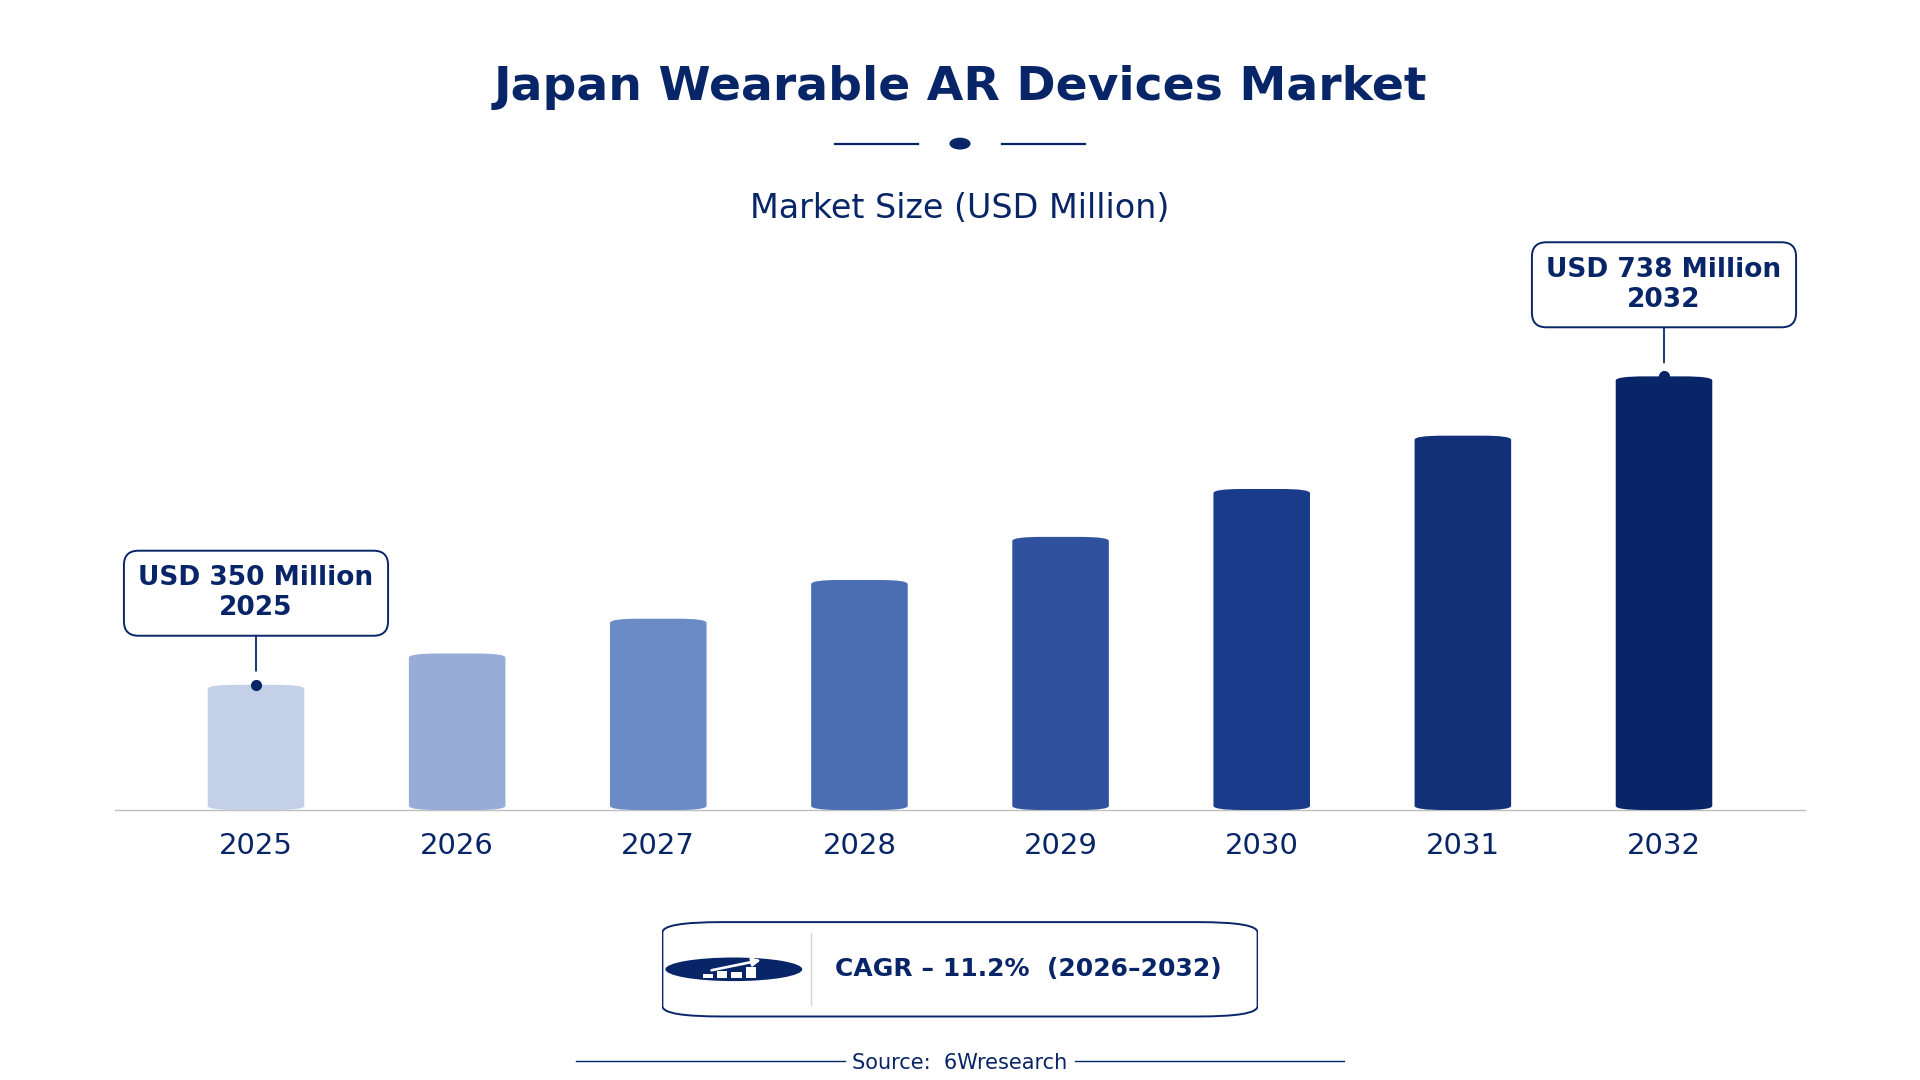
According to 6Wresearch internal database and industry insights, the Japan Wearable AR Devices Market was valued at USD 350 Million in 2025 and is projected to reach USD 738 Million by 2032, growing at a CAGR of approximately 11.2% during 2026–2032.
Japan Wearable AR Devices Market Highlights
| Report Metric | Details |
| Report Name | Japan Wearable AR Devices Market (2026-2032) |
| Market Size 2025 | USD 350 Million |
| Market Size 2032 | USD 738 Million |
| Absolute Growth 2025–2032 | USD 388 Million |
| CAGR 2026–2032 | 11.2% |
| Peak Annual Growth | 12.8% in 2026 |
| Forecast Period | 2026–2032 |
| Historical Data | 2022–2025 |
| Base Year | 2025 |
| Leading Product Type, 2025 | Smart Glasses (37% share) |
| Leading Display Technology, 2025 | Augmented Reality (36% share) |
| Leading Distribution Channel, 2025 | Online Platforms (34% share) |
| Leading End User, 2025 | Enterprise Training (37% share) |
| Fastest-Growing Product Type | Enterprise AR Kits (15.6% CAGR) |
| Fastest-Growing Display Technology | Mixed Reality (15.0% CAGR) |
| Fastest-Growing Distribution Channel | B2B Sales (13.7% CAGR) |
| Fastest-Growing End User | Logistics & Warehousing (14.0% CAGR) |
| Growing Sector | Logistics & Warehousing |
| Key End Users | Enterprise Training, Industrial Workforce, Tech Enthusiasts |
Japan Wearable AR Devices Market Year-wise Growth Rate and Key Drivers (2022–2032)
This graph illustrates the annual growth rates of the market from 2022 to 2032, highlighting a steady upward trajectory and projected market expansion over the forecast period.
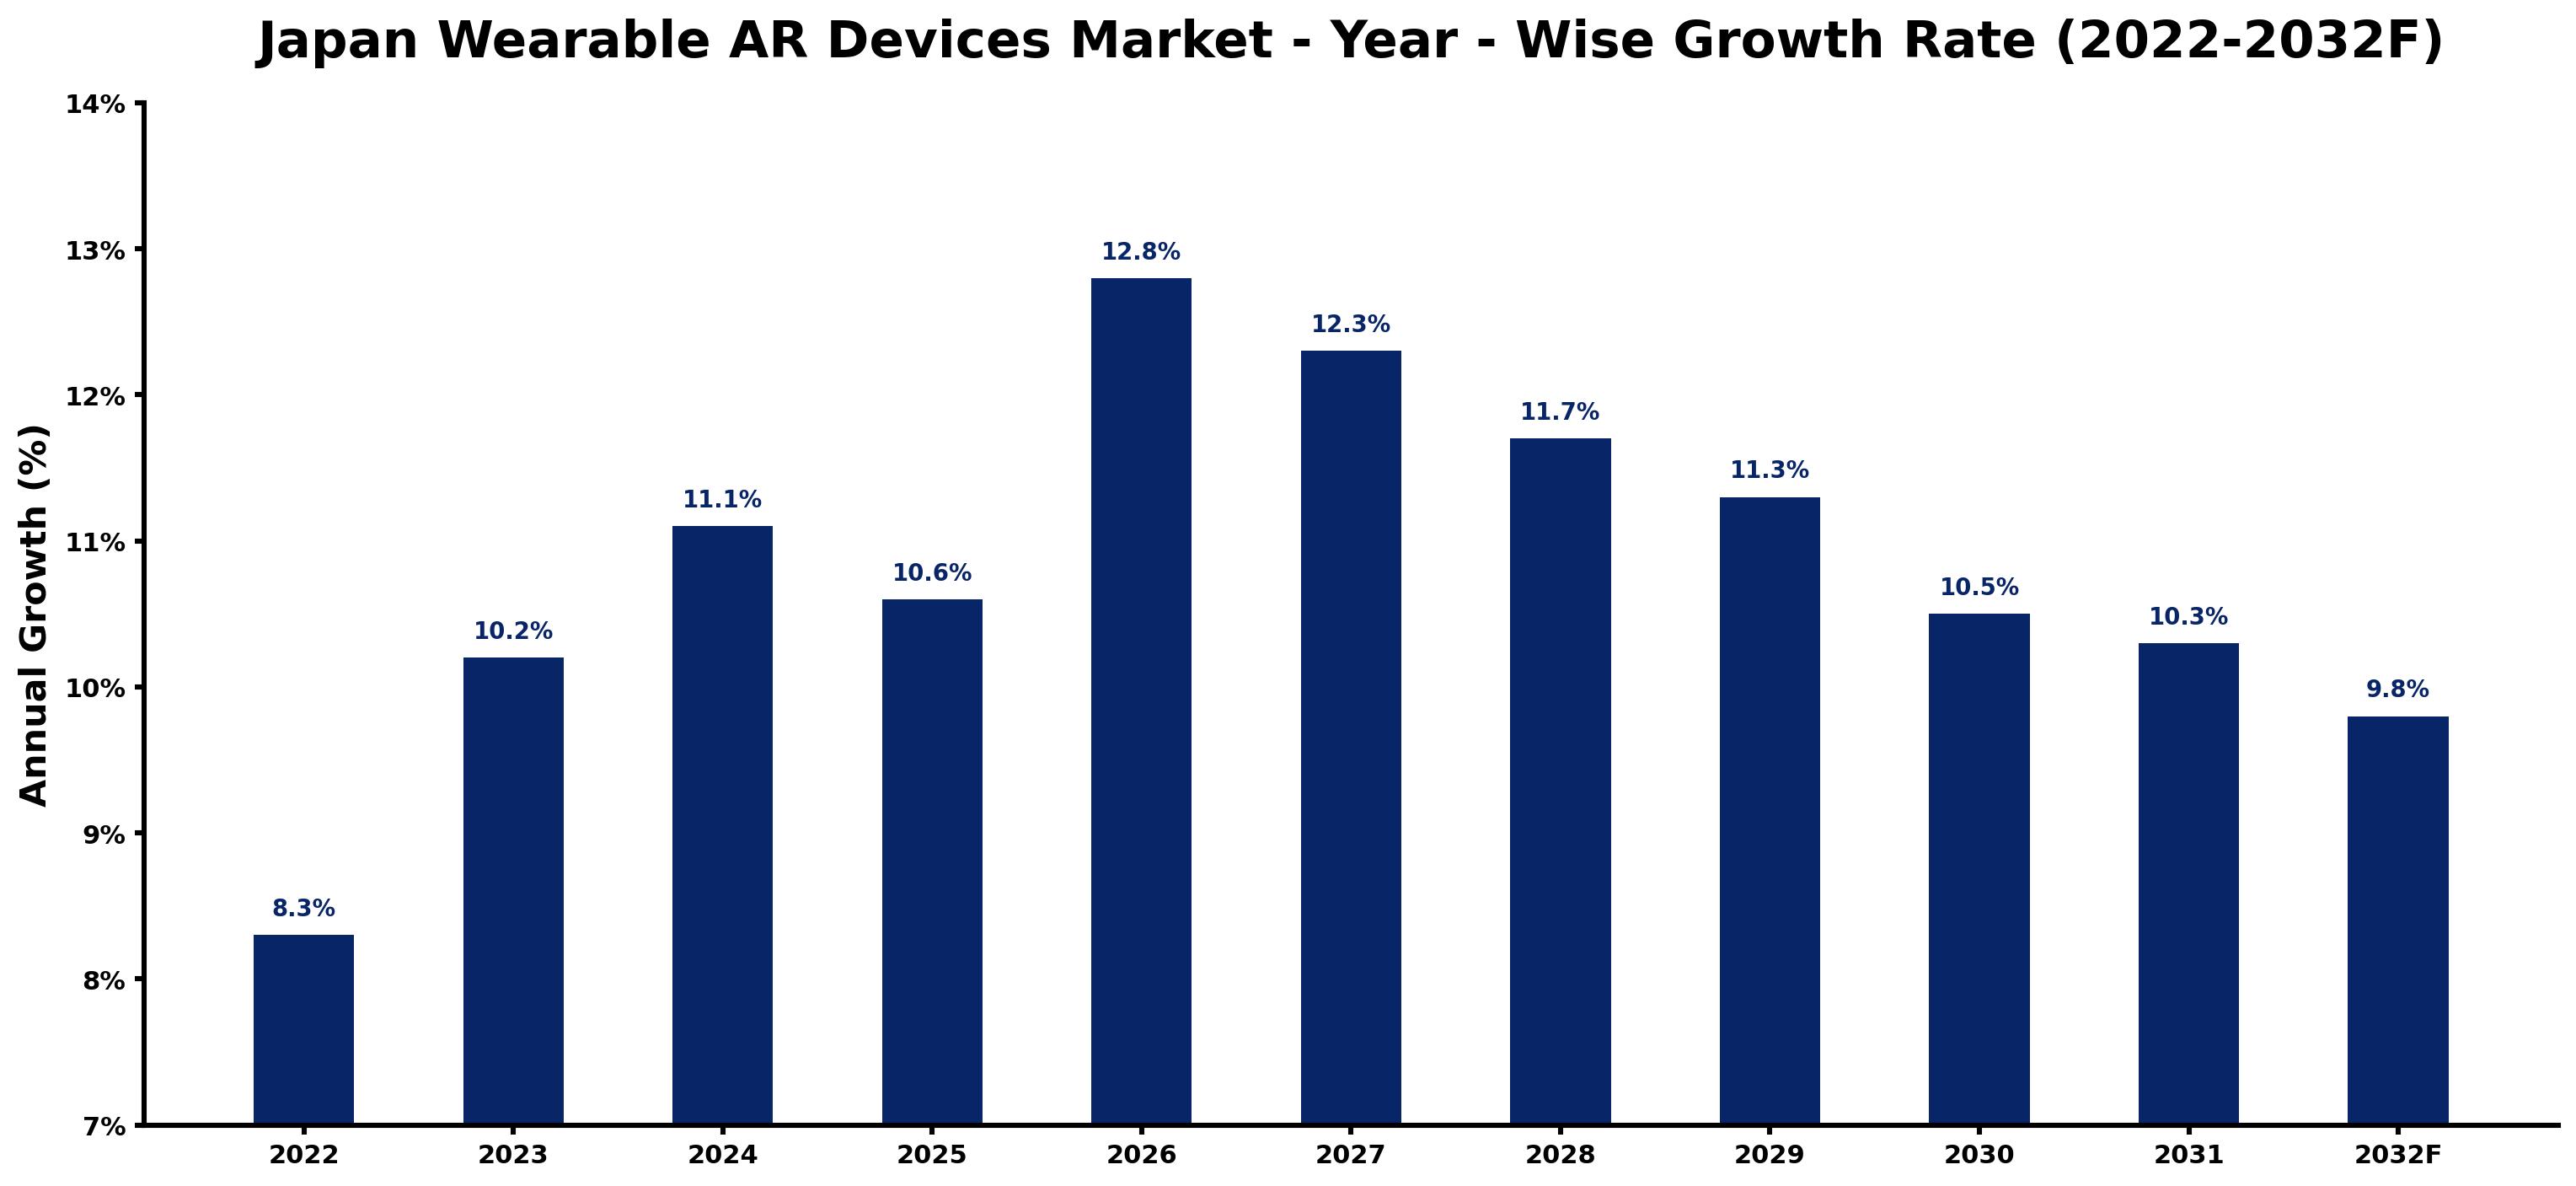
Annual growth estimates for each year appear below with the principal reason behind them, explaining the shifts that set the pace of the market.
| Year | Estimated Annual Growth (%) | Market Rationale |
| 2022 | 8.3 | The market experienced steady growth, reflecting increasing interest in AR technology across various sectors. |
| 2023 | 10.2 | Growth accelerated as more enterprises adopted AR solutions for training and operational efficiency. |
| 2024 | 11.1 | The market continued to expand, driven by rising investments in AR technology and applications. |
| 2025 | 10.6 | Growth slowed slightly as the market matured, yet demand for AR devices remained strong. |
| 2026 | 12.8 | Peak growth is expected due to heightened enterprise investment in AR training solutions. |
| 2027 | 12.3 | Demand growth is projected to decelerate, reflecting market saturation in some segments while new applications emerge. |
| 2028 | 11.7 | The market is expected to continue growing, supported by ongoing technological advancements and user adoption. |
| 2029 | 11.3 | Growth is anticipated to slow further, as competition intensifies and innovation becomes key to capturing market share. |
| 2030 | 10.5 | The market will experience another slowdown, with buyers becoming more selective in their AR investments. |
| 2031 | 10.3 | Demand growth is expected to continue decelerating, as the focus shifts to improving existing AR applications. |
| 2032 | 9.8 | The market growth rate is projected to stabilise, driven by a mature user base and ongoing technological integration. |
Note: Market size estimations and growth projections presented in this report are based on 6Wresearch's proprietary forecasting methodology, utilizing the latest available industry data, government publications, and primary research inputs.
Japan Wearable AR Devices Market Synopsis
Wearable AR devices overlay digital information onto the real world, improving training and operational efficiency in various sectors. The Japan Wearable AR Devices Market is growing due to increasing enterprise adoption, particularly in manufacturing and logistics. The total number of AR device users is projected to exceed 10 million by 2025, supported by government measures like the PMD Act, which regulates the safety and performance of AR technologies.
Market Dynamics Impact Analysis (2026–2032)
| Factor | Type | Impact | Primary Segment Affected |
| Growing enterprise adoption of AR technology for training and operational efficiency | Driver | High | Enterprise AR Kits |
| Increasing investments in AR development and infrastructure | Driver | High | AR Headsets |
| Rising demand for AR solutions in logistics and warehousing | Opportunity | High | Logistics & Warehousing |
| Expanding use of AR in healthcare training applications | Opportunity | Medium | Enterprise Training |
| High costs associated with AR device development and deployment | Restraint | High | Smart Glasses |
| Limited awareness of AR technology benefits among potential users | Restraint | Medium | AR Headsets |
| Competition from alternative training and operational technologies | Challenge | High | Enterprise AR Kits |
| Supply chain disruptions affecting AR device availability | Challenge | Medium | Logistics & Warehousing |
Evaluation of Drivers in Japan Wearable AR Devices Market (2026–2032)
These are the developments adding the most demand over the forecast period.
| Drivers | Primary Segment Affected | Why It Matters (Evidence) |
| Increased investment in AR technology by enterprises | Enterprise AR Kits | This investment is expected to reach over JPY 300 billion by 2023, leading to improved training capabilities. |
| Growing interest in AR applications for operational efficiency | AR Headsets | With the logistics sector adopting AR solutions, demand is anticipated to rise, improving productivity. |
| Expansion of AR training programs in various industries | Enterprise Training | The 'Future of Work' programme encourages AR integration in workforce training, driving demand for devices. |
| Technological advancements in AR display technologies | Smart Glasses | The development of lightweight materials and improved optical projection is enhancing user experience and driving sales. |
| Increasing consumer awareness of AR benefits | Logistics & Warehousing | As more enterprises showcase successful AR implementations, interest among potential buyers is increasing. |
What keeps demand rising is increased investment in AR technology, particularly in the logistics sector, which is adopting AR solutions for inventory management. In 2023, Japan's AR market is estimated to be worth over 300 billion yen, driven by enterprise applications. Technological advancements in display technologies are improving user experience, encouraging purchases of AR devices. As enterprises recognise the operational efficiencies gained through AR, interest from sectors like manufacturing continues to grow, resulting in a rise in demand for effective solutions.
Evaluation of Restraints in Japan Wearable AR Devices Market
These restraints slow adoption and weigh on supplier margins.
| Market Restraint | Primary Segment Affected | Why It Matters (Evidence) |
| High costs associated with developing and deploying AR devices | Smart Glasses | Development costs can exceed JPY 100 million for advanced AR systems, limiting adoption among smaller enterprises. |
| Limited awareness of AR technology benefits among potential users | AR Headsets | Many enterprises remain unaware of how AR can improve training and operational efficiency, hindering market growth. |
| Competition from alternative training technologies | Enterprise AR Kits | As virtual reality and traditional training methods gain traction, AR devices face increased competition for market share. |
| Supply chain disruptions affecting AR device availability | Logistics & Warehousing | Global supply chain issues have led to delays in AR device production, impacting timely availability for buyers. |
| Regulatory hurdles in AR device approval | Enterprise Training | Compliance with safety and performance standards can delay product launches, affecting market entry. |
Japan Wearable AR Devices Market Challenges
In manufacturing, buyers encounter high costs for wearable AR devices, with prices exceeding JPY 1 million per unit, limiting adoption among smaller firms. Competition escalates as many companies invest in AR technology, forcing buyers to navigate a crowded market. Technology limitations hinder the development of user-friendly interfaces, extending training times for employees and delaying operational improvements by up to six months. Supply chain disruptions arise from reliance on specific components, which can postpone device availability for clinics and inflate overall project costs by 20%.
Trends in the Japan Wearable AR Devices Market
Buyers and suppliers in the Japan Wearable AR Devices Market are adjusting to the following trends.
- Shift from Traditional Training to AR-Based Solutions: Enterprise training is increasingly adopting AR solutions, with over 10 million users expected by 2025. This shift improves engagement and retention during training sessions.
- Growth of AR in Logistics Operations: Tokyo is becoming a hub for AR adoption in logistics, with significant investments in AR technology for inventory management. The logistics sector is rapidly integrating AR solutions to improve efficiency.
- Emergence of Mixed Reality Applications: The rise of mixed reality applications began in 2023, improving user experience in various sectors. This trend is likely to grow as technology advances and user adoption increases.
- Integration of AR in Smart City Projects: The Tokyo Metropolitan Government is investing in smart city projects that include AR applications. This initiative is anticipated to improve urban management and public safety.
Investment Opportunities in the Japan Wearable AR Devices Market
Where to invest in the Japan Wearable AR Devices Market: the main openings are set out below.
- Investment in AR Solutions for Logistics: Tokyo's logistics sector is rapidly adopting AR solutions, with a projected market worth exceeding 300 billion yen. Suppliers can enter this market by partnering with local logistics firms.
- Expansion of AR in Healthcare Training: The healthcare sector is increasingly integrating AR into training programs, with a growing demand for AR devices. Suppliers can collaborate with medical training institutions to meet this need.
- Development of AR Standards: The ongoing development of JIS X 0129 standards for AR device safety presents an opportunity for manufacturers to ensure compliance and improve marketability.
- Growth in AR Device User Base: With the total number of AR device users expected to exceed 10 million by 2025, suppliers should focus on improving product features to attract more buyers.
Government Initiatives in the Japan Wearable AR Devices Market
The regulatory framework for AR devices in Japan is shaped by several laws, including the Industrial Standardization Act of 1949 and the PMD Act of 2014. These laws govern the approval, manufacture, and quality of AR devices, ensuring safety and performance standards are met. The PMD Act regulates how AR devices are developed and marketed, which affects their availability for buyers in various sectors.
The Pharmaceuticals and Medical Devices Agency (PMDA) reviews AR devices for compliance with safety standards. The agency monitors post-market safety and provides approvals for new AR technologies, facilitating their entry into the market. Additionally, the Japan Agency for Medical Research and Development (AMED) funds research initiatives that support the development of AR applications in various sectors.
Future Insight of the Japan Wearable AR Devices Market
The logistics sector will increasingly implement wearable AR devices for operational improvements by 2032, driven by the 'Smart Manufacturing' initiative. The healthcare sector will adopt AR for training, with the total number of AR device users in Japan expected to exceed 10 million by 2025, prompting suppliers to innovate. Standards like JIS X 0129 will establish safety and performance benchmarks, reassuring buyers. Government programmes will promote AR technology, creating new opportunities for suppliers to meet rising demand across various industries.
Market Segmentation Analysis
Japan Wearable AR Devices Market report covers a detailed analysis of the following market segments:
By Product Type – Smart Glasses Lead, Enterprise AR Kits Expected to Grow Fastest
According to Saurav Kr Singh, Senior Research Analyst at 6Wresearch, Smart Glasses held 37% of the Japan Wearable AR Devices Market by product type in 2025. Smart Glasses hold the largest share as they are extensively used in sectors like manufacturing and healthcare, providing hands-free access to critical information. Their application in operational tasks significantly boosts efficiency and productivity across various industries, particularly in training scenarios. Enterprise AR Kits are projected to grow fastest, at a CAGR of 15.6% during 2026–2032. Enterprise AR Kits are witnessing rapid growth due to the increasing demand for specialised training solutions tailored for workforce skill enhancement. This segment's expansion is propelled by the necessity for customised training tools in operational environments, ensuring effective learning outcomes. Suppliers should focus on developing features that cater specifically to enterprise training needs to capture this growing market.
By Display Technology – Augmented Reality Leads, Mixed Reality Expected to Grow Fastest
Augmented Reality accounted for 36% of the market by display technology in 2025. Augmented Reality is the leading display technology as it is essential for the functionality of wearable devices, offering immersive experiences that enhance user interaction. Its widespread application in training and operational contexts solidifies its dominant market position. Mixed Reality is set to record the highest CAGR in this split, 15.0% over 2026–2032. Mixed Reality is experiencing swift growth as it significantly enriches user experience in applications that necessitate interaction with both digital and physical elements. This technology is increasingly preferred in sectors such as healthcare and training, where immersive experiences are critical. Investing in Mixed Reality capabilities could provide suppliers with a competitive edge in attracting new clients.
By Distribution Channel – Online Platforms Lead, B2B Sales Expected to Grow Fastest
With 34% of distribution channel revenue in 2025, Online Platforms was the largest category. Online Platforms serve as the primary distribution channel for wearable AR devices, offering easy access and broad reach to consumers. The convenience of online shopping has led to increased sales in this segment, establishing it as the leading channel. Over 2026–2032, B2B Sales is expected to post the fastest growth, at a CAGR of 13.7%. B2B Sales are rapidly growing as businesses recognise the value of direct solutions tailored to industrial clients, especially in logistics and manufacturing. This trend reflects a shift towards enterprise-focused sales strategies that cater to specific industry needs. Suppliers should enhance their B2B strategies to effectively engage with industrial clients and address their unique requirements.
By End User – Enterprise Training Leads, Logistics & Warehousing Expected to Grow Fastest
The largest end user category in 2025 was Enterprise Training, at 37% of revenue. Enterprise Training is the leading end user segment owing to the extensive use of AR devices in enhancing workforce skills and operational efficiency. Many organisations are investing in AR solutions to improve training outcomes and reduce costs associated with traditional methods. The quickest growth will come from Logistics & Warehousing, forecast to expand at a CAGR of 14.0% between 2026 and 2032. Logistics & Warehousing is the fastest-growing end user segment as AR solutions are increasingly employed for inventory management and training, optimising operations in this crucial sector. The push for efficiency in logistics accelerates this rapid adoption. Suppliers should tailor their offerings to meet the specific training and operational needs of the logistics sector to capitalise on this growth.
Key Attractiveness of the Report
- 10 Years of Market Numbers
- Historical Data Starting from 2022 to 2025
- Base Year 2025
- Forecast Data until 2032
- Key Performance Indicators Impacting the Market
- Major Upcoming Developments and Projects
Key Highlights of the Report:
- Japan Wearable AR Devices Market Outlook
- Market Size of Japan Wearable AR Devices Market, 2025
- Forecast of Japan Wearable AR Devices Market, 2032
- Historical Data and Forecast of Japan Wearable AR Devices Revenues & Volume for the Period 2022-2032F
- Japan Wearable AR Devices Market Trend Evolution
- Japan Wearable AR Devices Market Drivers and Challenges
- Japan Wearable AR Devices Price Trends
- Japan Wearable AR Devices Porter's Five Forces
- Japan Wearable AR Devices Industry Life Cycle
- Historical Data and Forecast of Japan Wearable AR Devices Market Revenues & Volume By Product Type for the Period 2022-2032F
- Historical Data and Forecast of Japan Wearable AR Devices Market Revenues & Volume By Smart Glasses for the Period 2022-2032F
- Historical Data and Forecast of Japan Wearable AR Devices Market Revenues & Volume By AR Headsets for the Period 2022-2032F
- Historical Data and Forecast of Japan Wearable AR Devices Market Revenues & Volume By Wearable Visors for the Period 2022-2032F
- Historical Data and Forecast of Japan Wearable AR Devices Market Revenues & Volume By Enterprise AR Kits for the Period 2022-2032F
- Historical Data and Forecast of Japan Wearable AR Devices Market Revenues & Volume By Display Technology for the Period 2022-2032F
- Historical Data and Forecast of Japan Wearable AR Devices Market Revenues & Volume By Augmented Reality for the Period 2022-2032F
- Historical Data and Forecast of Japan Wearable AR Devices Market Revenues & Volume By Mixed Reality for the Period 2022-2032F
- Historical Data and Forecast of Japan Wearable AR Devices Market Revenues & Volume By Optical Projection for the Period 2022-2032F
- Historical Data and Forecast of Japan Wearable AR Devices Market Revenues & Volume By HUD Systems for the Period 2022-2032F
- Historical Data and Forecast of Japan Wearable AR Devices Market Revenues & Volume By Distribution Channel for the Period 2022-2032F
- Historical Data and Forecast of Japan Wearable AR Devices Market Revenues & Volume By Online Platforms for the Period 2022-2032F
- Historical Data and Forecast of Japan Wearable AR Devices Market Revenues & Volume By Direct Sales for the Period 2022-2032F
- Historical Data and Forecast of Japan Wearable AR Devices Market Revenues & Volume By B2B Sales for the Period 2022-2032F
- Historical Data and Forecast of Japan Wearable AR Devices Market Revenues & Volume By Tech Distributors for the Period 2022-2032F
- Historical Data and Forecast of Japan Wearable AR Devices Market Revenues & Volume By End User for the Period 2022-2032F
- Historical Data and Forecast of Japan Wearable AR Devices Market Revenues & Volume By Tech Enthusiasts for the Period 2022-2032F
- Historical Data and Forecast of Japan Wearable AR Devices Market Revenues & Volume By Enterprise Training for the Period 2022-2032F
- Historical Data and Forecast of Japan Wearable AR Devices Market Revenues & Volume By Industrial Workforce for the Period 2022-2032F
- Historical Data and Forecast of Japan Wearable AR Devices Market Revenues & Volume By Logistics & Warehousing for the Period 2022-2032F
- Japan Wearable AR Devices Import Export Trade Statistics
- Market Opportunity Assessment By Product Type
- Market Opportunity Assessment By Display Technology
- Market Opportunity Assessment By Distribution Channel
- Market Opportunity Assessment By End User
- Japan Wearable AR Devices Top Companies Market Share
- Japan Wearable AR Devices Competitive Benchmarking By Technical and Operational Parameters
- Japan Wearable AR Devices Company Profiles
- Japan Wearable AR Devices Key Strategic Recommendations
Market Covered
This report examines the market across the segments below.
By Product Type
- Smart Glasses
- AR Headsets
- Wearable Visors
- Enterprise AR Kits
By Display Technology
- Augmented Reality
- Mixed Reality
- Optical Projection
- HUD Systems
By Distribution Channel
- Online Platforms
- Direct Sales
- B2B Sales
- Tech Distributors
By End User
- Tech Enthusiasts
- Enterprise Training
- Industrial Workforce
- Logistics & Warehousing































