Jordan Gold Potassium Cyanide Market (2026-2032) Outlook | Value, Analysis, Growth, Size, Companies, Share, Forecast, Industry, Revenue & Trends
Market Forecast By Type (Low Purity, High Purity), By Applications (Electroplating of Metals, Decorative Costume Jewellery, Electronic Devices, Watches, Others) And Competitive Landscape
| Product Code: ETC196198 | Publication Date: May 2022 | Updated Date: Jun 2026 | Product Type: Market Research Report | |
| Publisher: 6Wresearch | Author: Ravi Bhandari | No. of Pages: 60 | No. of Figures: 40 | No. of Tables: 7 |
Jordan Gold Potassium Cyanide Market Size, Share & Growth Rate
The Jordan Gold Potassium Cyanide Market was estimated at USD 430 Million in 2025 and is projected to reach USD 581 Million by 2032, growing at a CAGR of 4.4% from 2026 to 2032. This growth trajectory is primarily driven by the rising demand for gold extraction, particularly within the jewelry manufacturing sector. Additionally, the mining industry in Jordan is expanding, further fueling the need for Gold Potassium Cyanide as an essential chemical in gold processing.
Jordan Gold Potassium Cyanide Market Year-wise Growth Rate and Key Drivers
This graph highlights how the Jordan Gold Potassium Cyanide Market has steadily grown over the years, supported by major growth factors.
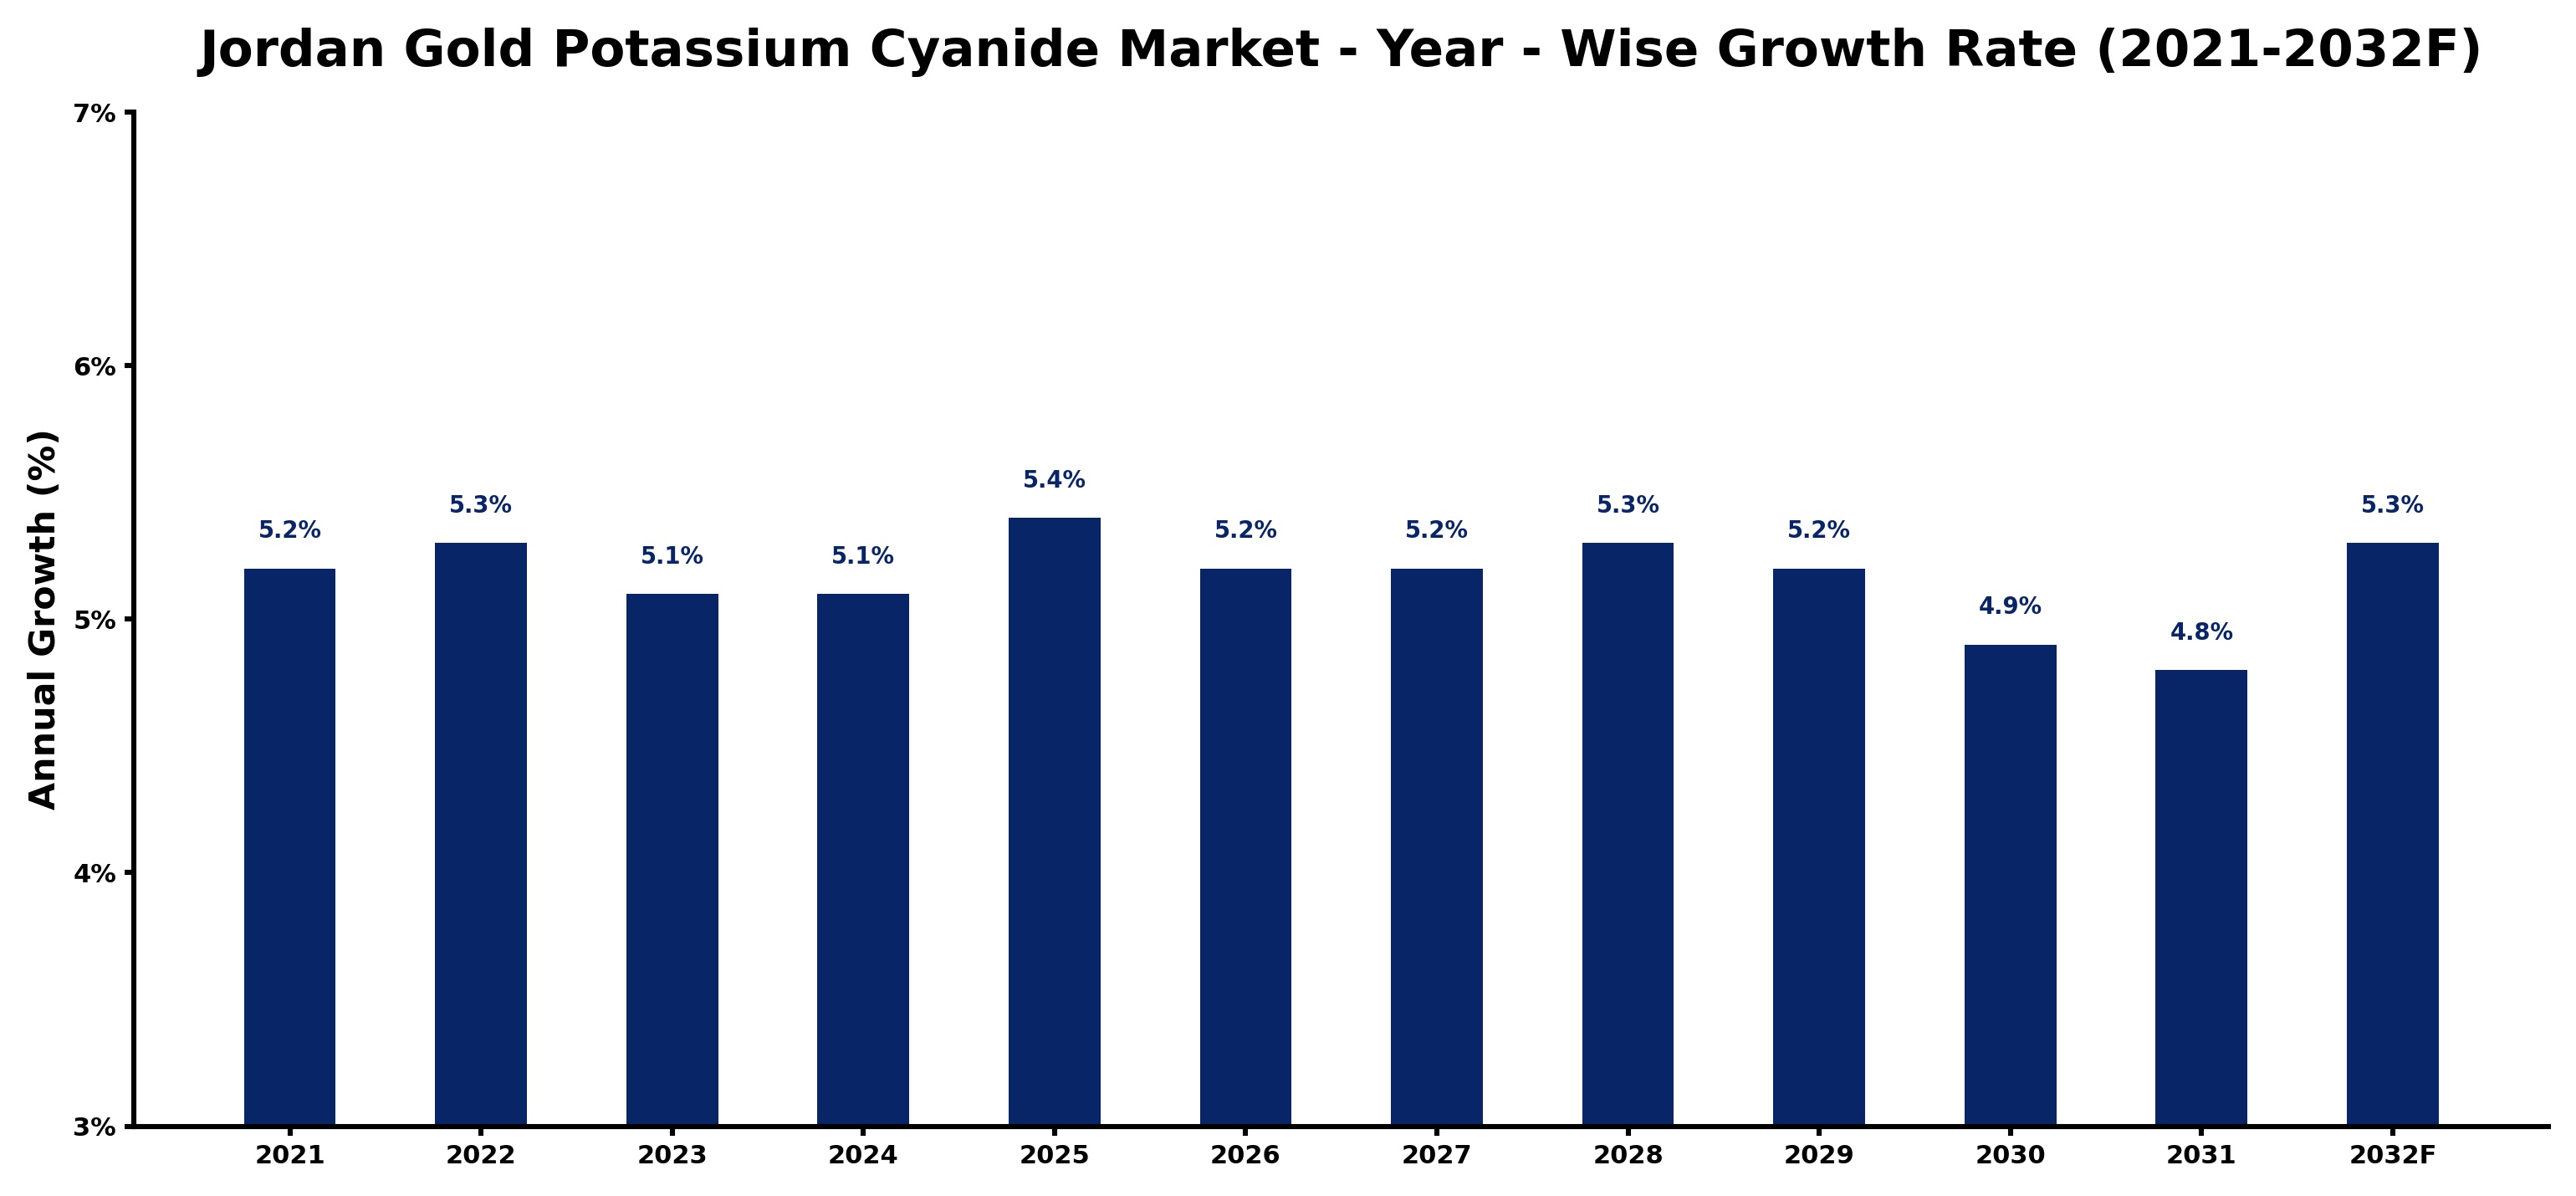
The table below presents the year‑wise growth rates along with the key drivers influencing the market
| Year | Growth Rate | Major Drivers |
| 2021 | 5.2% | Mining sector growth stimulated demand |
| 2022 | 5.3% | Increased industrial applications expanded market |
| 2023 | 5.1% | Regulatory support enhanced production capacity |
| 2024 | 5.1% | Technological advancements improved efficiency |
| 2025 | 5.4% | Rising gold prices drove consumption |
| 2026 | 5.2% | Export opportunities expanded significantly |
| 2027 | 5.2% | Sustainability initiatives encouraged innovation |
| 2028 | 5.3% | Emerging markets increased consumption rates |
| 2029 | 5.2% | Strategic partnerships enhanced distribution networks |
| 2030 | 4.9% | Market consolidation improved competitive landscape |
| 2031 | 4.8% | Research investments fostered product development |
| 2032 | 5.3% | Consumer awareness drove market expansion |
Note - Market size estimations and growth projections presented in this report are based on 6Wresearch’s advanced forecasting approach, validated with industry datasets as of June 2026.
Jordan Gold Potassium Cyanide Market Synopsis
Recent market dynamics indicate a robust momentum in the Jordan Gold Potassium Cyanide landscape, largely propelled by increasing gold investments and a flourishing jewelry market. However, the future reveals a pathway shaped by enhanced regulatory scrutiny and a movement towards sustainability in chemical production.
The market is evolving, with both domestic and international players vying to meet the burgeoning demand. As consumer preferences shift towards environmentally conscious products, companies are expected to innovate while adhering to safety regulations, ensuring that both market growth and public health are prioritized.
Jordan Gold Potassium Cyanide Market Key Takeaways
- Significant growth anticipated in the Jordan Gold Potassium Cyanide market driven by increased jewelry production and gold mining activities.
- Ongoing trends toward sustainable practices are reshaping production processes and market strategies.
- Strict regulatory frameworks present both challenges and opportunities for market participants.
- Investment prospects are bolstered by government initiatives promoting mining sector development.
- Technological advancements in manufacturing are enhancing product quality and efficiency.
Evaluation of Restraints in Jordan Gold Potassium Cyanide Market
The Jordan Gold Potassium Cyanide market faces several significant restraints that could impede its growth trajectory. Stringent regulations regarding the handling and distribution of potassium cyanide are a primary concern, as they require adherence to strict licensing and safety protocols. These compliance measures can be costly and complex for businesses, especially smaller domestic players. Furthermore, competition is intense within a limited supplier base, causing price volatility that can disrupt supply chains. The imperative for product quality and purity adds another layer of complexity, as any lapses can jeopardize client relationships and market reputation.
Jordan Gold Potassium Cyanide Market Trends
A notable trend within the Jordan Gold Potassium Cyanide market is the increasing preference for gold jewelry among consumers, which is intensifying the demand for potassium cyanide in jewelry manufacturing. Additionally, there is a growing emphasis on environmentally sustainable practices, prompting companies to innovate production processes to mitigate environmental impact. The adoption of advanced manufacturing technologies is also on the rise, aimed at ensuring product quality while meeting market demands.
Jordan Gold Potassium Cyanide Market Opportunities
Investors are presented with promising opportunities in the Jordan Gold Potassium Cyanide market, particularly due to the burgeoning mining sector fueled by governmental support. As the demand for gold extraction rises, there is significant potential for establishing local production facilities and partnerships with mining companies requiring potassium cyanide. Furthermore, investing in research and development to create safer and more efficient production methods could also yield substantial returns in this evolving market landscape.
Government Initiatives in the Jordan Gold Potassium Cyanide Market
Government policies in Jordan regarding the Gold Potassium Cyanide market are centered around ensuring safety and environmental protection. These regulations dictate the production, import, and use of potassium cyanide, thus requiring companies to follow strict licensing and registration protocols. Furthermore, measures to prevent illegal trafficking and misuse of potassium cyanide are in place, underscoring the government's commitment to public health while supporting the mining industry, which relies heavily on this critical chemical.
Future Insights of the Jordan Gold Potassium Cyanide Market
Looking ahead to the period between 2026 and 2032, the Jordan Gold Potassium Cyanide market is poised for promising growth. The consistent rise in demand for gold across various sectors, including jewelry and electronics, is expected to drive usage. With a strong focus on sustainable practices and technological advancements, industry participants will need to adapt to maintain a competitive edge. Government initiatives aimed at enhancing mining sector investments are also likely to provide a conducive environment for growth, ensuring that the market continues to thrive amidst challenges.
Jordan Gold Potassium Cyanide Market Latest Developments (May 2025 - June 2026)
In recent months, the Jordan Gold Potassium Cyanide market has seen a heightened focus on sustainable production methods, with several industry stakeholders exploring innovative solutions to reduce environmental impacts. Additionally, advancements in compliance practices have emerged, ensuring better adherence to regulatory requirements. The competitive landscape remains dynamic, with players actively seeking partnerships to enhance their market reach and operational efficiencies.
Jordan Gold Potassium Cyanide Market - Key Attractiveness of the Report
- 10 Years of Market Numbers
- Historical Data Starting from 2022 to 2025
- Base Year: 2025
- Forecast Data until 2032
- Key Performance Indicators Impacting the Market
- Major Upcoming Developments and Projects
Key Highlights of the Report:
- Jordan Gold Potassium Cyanide Market Outlook
- Market Size of Jordan Gold Potassium Cyanide Market, 2025
- Forecast of Jordan Gold Potassium Cyanide Market, 2032
- Historical Data and Forecast of Jordan Gold Potassium Cyanide Revenues & Volume for the Period 2022-2032F
- Jordan Gold Potassium Cyanide Market Trend Evolution
- Jordan Gold Potassium Cyanide Market Drivers and Challenges
- Jordan Gold Potassium Cyanide Price Trends
- Jordan Gold Potassium Cyanide Porter's Five Forces
- Jordan Gold Potassium Cyanide Industry Life Cycle
- Historical Data and Forecast of Jordan Gold Potassium Cyanide Market Revenues & Volume By Type for the Period 2022-2032F
- Historical Data and Forecast of Jordan Gold Potassium Cyanide Market Revenues & Volume By Low Purity for the Period 2022-2032F
- Historical Data and Forecast of Jordan Gold Potassium Cyanide Market Revenues & Volume By High Purity for the Period 2022-2032F
- Historical Data and Forecast of Jordan Gold Potassium Cyanide Market Revenues & Volume By Applications for the Period 2022-2032F
- Historical Data and Forecast of Jordan Gold Potassium Cyanide Market Revenues & Volume By Electroplating of Metals for the Period 2022-2032F
- Historical Data and Forecast of Jordan Gold Potassium Cyanide Market Revenues & Volume By Decorative Costume Jewellery for the Period 2022-2032F
- Historical Data and Forecast of Jordan Gold Potassium Cyanide Market Revenues & Volume By Electronic Devices for the Period 2022-2032F
- Historical Data and Forecast of Jordan Gold Potassium Cyanide Market Revenues & Volume By Watches for the Period 2022-2032F
- Historical Data and Forecast of Jordan Gold Potassium Cyanide Market Revenues & Volume By Others for the Period 2022-2032F
- Jordan Gold Potassium Cyanide Import Export Trade Statistics
- Market Opportunity Assessment By Type
- Market Opportunity Assessment By Applications
- Jordan Gold Potassium Cyanide Top Companies Market Share
- Jordan Gold Potassium Cyanide Competitive Benchmarking By Technical and Operational Parameters
- Jordan Gold Potassium Cyanide Company Profiles
- Jordan Gold Potassium Cyanide Key Strategic Recommendations
Jordan Gold Potassium Cyanide Market - Frequently Asked Questions
The growth is largely fueled by the increasing demand for gold in the jewelry and mining sectors, coupled with a trend towards technological advancement in cyanide production.
Companies must navigate stringent regulatory frameworks and ensure compliance with safety standards while maintaining product quality amidst competition and price fluctuations.
The market was estimated at USD 430 Million in 2025, projected to reach USD 581 Million by 2032, reflecting a CAGR of 4.4% from 2026 to 2032, indicating robust growth potential.
Innovations are primarily focused on enhancing production efficiency and minimizing environmental impact, with a shift towards more sustainable practices in cyanide manufacturing.
Government policies regulate the production, import, and usage of potassium cyanide, ensuring safety while also aiming to support the mining industry's growth through appropriate measures.
6Wresearch actively monitors the Jordan Gold Potassium Cyanide Market and publishes its comprehensive annual report, highlighting emerging trends, growth drivers, revenue analysis, and forecast outlook. Our insights help businesses to make data-backed strategic decisions with ongoing market dynamics. Our analysts track relevent industries related to the Jordan Gold Potassium Cyanide Market, allowing our clients with actionable intelligence and reliable forecasts tailored to emerging regional needs.
Yes, we provide customisation as per your requirements. To learn more, feel free to contact us on sales@6wresearch.com
1 Executive Summary |
2 Introduction |
2.1 Key Highlights of the Report |
2.2 Report Description |
2.3 Market Scope & Segmentation |
2.4 Research Methodology |
2.5 Assumptions |
3 Jordan Gold Potassium Cyanide Market Overview |
3.1 Jordan Country Macro Economic Indicators |
3.2 Jordan Gold Potassium Cyanide Market Revenues & Volume, 2022 & 2032F |
3.3 Jordan Gold Potassium Cyanide Market - Industry Life Cycle |
3.4 Jordan Gold Potassium Cyanide Market - Porter's Five Forces |
3.5 Jordan Gold Potassium Cyanide Market Revenues & Volume Share, By Type, 2022 & 2032F |
3.6 Jordan Gold Potassium Cyanide Market Revenues & Volume Share, By Applications, 2022 & 2032F |
4 Jordan Gold Potassium Cyanide Market Dynamics |
4.1 Impact Analysis |
4.2 Market Drivers |
4.2.1 Increasing demand for gold in industries such as jewelry, electronics, and medical sectors. |
4.2.2 Growing adoption of gold potassium cyanide in electroplating applications. |
4.2.3 Favorable government regulations supporting the mining and refining of gold in Jordan. |
4.3 Market Restraints |
4.3.1 Volatility in gold prices impacting the overall demand for gold potassium cyanide. |
4.3.2 Environmental concerns related to the use and disposal of cyanide compounds. |
4.3.3 Competition from alternative gold extraction methods or substitutes affecting market growth. |
5 Jordan Gold Potassium Cyanide Market Trends |
6 Jordan Gold Potassium Cyanide Market, By Types |
6.1 Jordan Gold Potassium Cyanide Market, By Type |
6.1.1 Overview and Analysis |
6.1.2 Jordan Gold Potassium Cyanide Market Revenues & Volume, By Type, 2022-2032F |
6.1.3 Jordan Gold Potassium Cyanide Market Revenues & Volume, By Low Purity, 2022-2032F |
6.1.4 Jordan Gold Potassium Cyanide Market Revenues & Volume, By High Purity, 2022-2032F |
6.2 Jordan Gold Potassium Cyanide Market, By Applications |
6.2.1 Overview and Analysis |
6.2.2 Jordan Gold Potassium Cyanide Market Revenues & Volume, By Electroplating of Metals, 2022-2032F |
6.2.3 Jordan Gold Potassium Cyanide Market Revenues & Volume, By Decorative Costume Jewellery, 2022-2032F |
6.2.4 Jordan Gold Potassium Cyanide Market Revenues & Volume, By Electronic Devices, 2022-2032F |
6.2.5 Jordan Gold Potassium Cyanide Market Revenues & Volume, By Watches, 2022-2032F |
6.2.6 Jordan Gold Potassium Cyanide Market Revenues & Volume, By Others, 2022-2032F |
7 Jordan Gold Potassium Cyanide Market Import-Export Trade Statistics |
7.1 Jordan Gold Potassium Cyanide Market Export to Major Countries |
7.2 Jordan Gold Potassium Cyanide Market Imports from Major Countries |
8 Jordan Gold Potassium Cyanide Market Key Performance Indicators |
8.1 Environmental compliance metrics related to cyanide handling and disposal practices. |
8.2 Adoption rate of gold potassium cyanide in new application areas. |
8.3 Research and development investments in improving the efficiency and safety of gold cyanidation processes. |
9 Jordan Gold Potassium Cyanide Market - Opportunity Assessment |
9.1 Jordan Gold Potassium Cyanide Market Opportunity Assessment, By Type, 2022 & 2032F |
9.2 Jordan Gold Potassium Cyanide Market Opportunity Assessment, By Applications, 2022 & 2032F |
10 Jordan Gold Potassium Cyanide Market - Competitive Landscape |
10.1 Jordan Gold Potassium Cyanide Market Revenue Share, By Companies, 2025 |
10.2 Jordan Gold Potassium Cyanide Market Competitive Benchmarking, By Operating and Technical Parameters |
11 Company Profiles |
12 Recommendations |
13 Disclaimer |
Global Go To Market Strategy - 2030
Export potential enables firms to identify high-growth global markets with greater confidence by combining advanced trade intelligence with a structured quantitative methodology. The framework analyzes emerging demand trends and country-level import patterns while integrating macroeconomic and trade datasets such as GDP and population forecasts, bilateral import–export flows, tariff structures, elasticity differentials between developed and developing economies, geographic distance, and import demand projections. Using weighted trade values from 2020–2024 as the base period to project country-to-country export potential for 2030, these inputs are operationalized through calculated drivers such as gravity model parameters, tariff impact factors, and projected GDP per-capita growth. Through an analysis of hidden potentials, demand hotspots, and market conditions that are most favorable to success, this method enables firms to focus on target countries, maximize returns, and global expansion with data, backed by accuracy.
By factoring in the projected importer demand gap that is currently unmet and could be potential opportunity, it identifies the potential for the Exporter (Country) among 190 countries, against the general trade analysis, which identifies the biggest importer or exporter.
To discover high-growth global markets and optimize your business strategy:
Click Here
Pricing
- Single User License$ 1,995
- Department License$ 2,400
- Site License$ 3,120
- Global License$ 3,795

Leadership Perspectives from Industry Events
Search
Thought Leadership and Analyst Meet


Our Clients
6WResearch In News
- India Air Conditioner Market Set for Strong Rebound in 2026 After Weather-Led Correction and GST-Driven Recovery: 6Wresearch
- ADAS in India: How Automatic Emergency Braking, Blind Spot Detection & Driver Monitoring are Transforming Road Safety
- Doha a strategic location for EV manufacturing hub: IPA Qatar
- Demand for luxury TVs surging in the GCC, says Samsung
- Empowering Growth: The Thriving Journey of Bangladesh’s Cable Industry
- Demand for luxury TVs surging in the GCC, says Samsung
Latest Reports
- Nicaragua RPG Gaming Market (2026-2032)
- New Zealand RPG Gaming Market (2026-2032)
- Netherlands RPG Gaming Market (2026-2032)
- Nauru RPG Gaming Market (2026-2032)
- Namibia RPG Gaming Market (2026-2032)
- Mozambique RPG Gaming Market (2026-2032)
- Montenegro RPG Gaming Market (2026-2032)
- Mongolia RPG Gaming Market (2026-2032)
- Monaco RPG Gaming Market (2026-2032)
- Micronesia RPG Gaming Market (2026-2032)
Industry Events and Analyst Meet

EV India Expo 2026

HIMTEX 2026

India Refining Summit 2026

India EV Show 2026

EV tech India Expo 2026
Whitepaper
- Middle East & Africa Commercial Security Market Click here to view more.
- Middle East & Africa Fire Safety Systems & Equipment Market Click here to view more.
- GCC Drone Market Click here to view more.
- Middle East Lighting Fixture Market Click here to view more.
- GCC Physical & Perimeter Security Market Click here to view more.