Jordan Inorganic Pigments Market (2026-2032) Outlook | Value, Share, Analysis, Growth, Revenue, Companies, Industry, Trends, Forecast & Size
Market Forecast By Type (Titanium Dioxide, Iron Oxide, Cadmium, Carbon Blank, Lead Chromate, Chromium Oxide, Others), By Colour (Red, Yellow, Orange, Green, Blue, Black, White, Others), By Chemistry (Oxide, Silicate, Carbonate, Sulphate, Sulphide, Others), By Grade (Food Grade, Pharmaceutical Grade, Industrial Grade, Others), By Form (Powder, Liquid), By Application (Plastics, Paints & Coatings, Printing Inks, Glass & Ceramics, Cosmetics, Paper Industry, Food Industry, Others) And Competitive Landscape
| Product Code: ETC190558 | Publication Date: May 2022 | Updated Date: Jun 2026 | Product Type: Market Research Report | |
| Publisher: 6Wresearch | Author: Ravi Bhandari | No. of Pages: 60 | No. of Figures: 40 | No. of Tables: 7 |
Jordan Inorganic Pigments Market Size, Share & Growth Rate
The Jordan Inorganic Pigments Market was estimated at USD 433 Million in 2025 and is projected to reach USD 628 Million by 2032, growing at a CAGR of 5.5% from 2026 to 2032. This robust growth trajectory is primarily fueled by escalating construction activities and an increasing demand for high-performance materials across various sectors. Industries such as paints and coatings are particularly contributing to this surge, as they seek pigments that ensure durability and UV stability in challenging environments.
Jordan Inorganic Pigments Market Year-wise Growth Rate and Key Drivers
This graph highlights how the Jordan Inorganic Pigments Market has steadily grown over the years, supported by major growth factors.
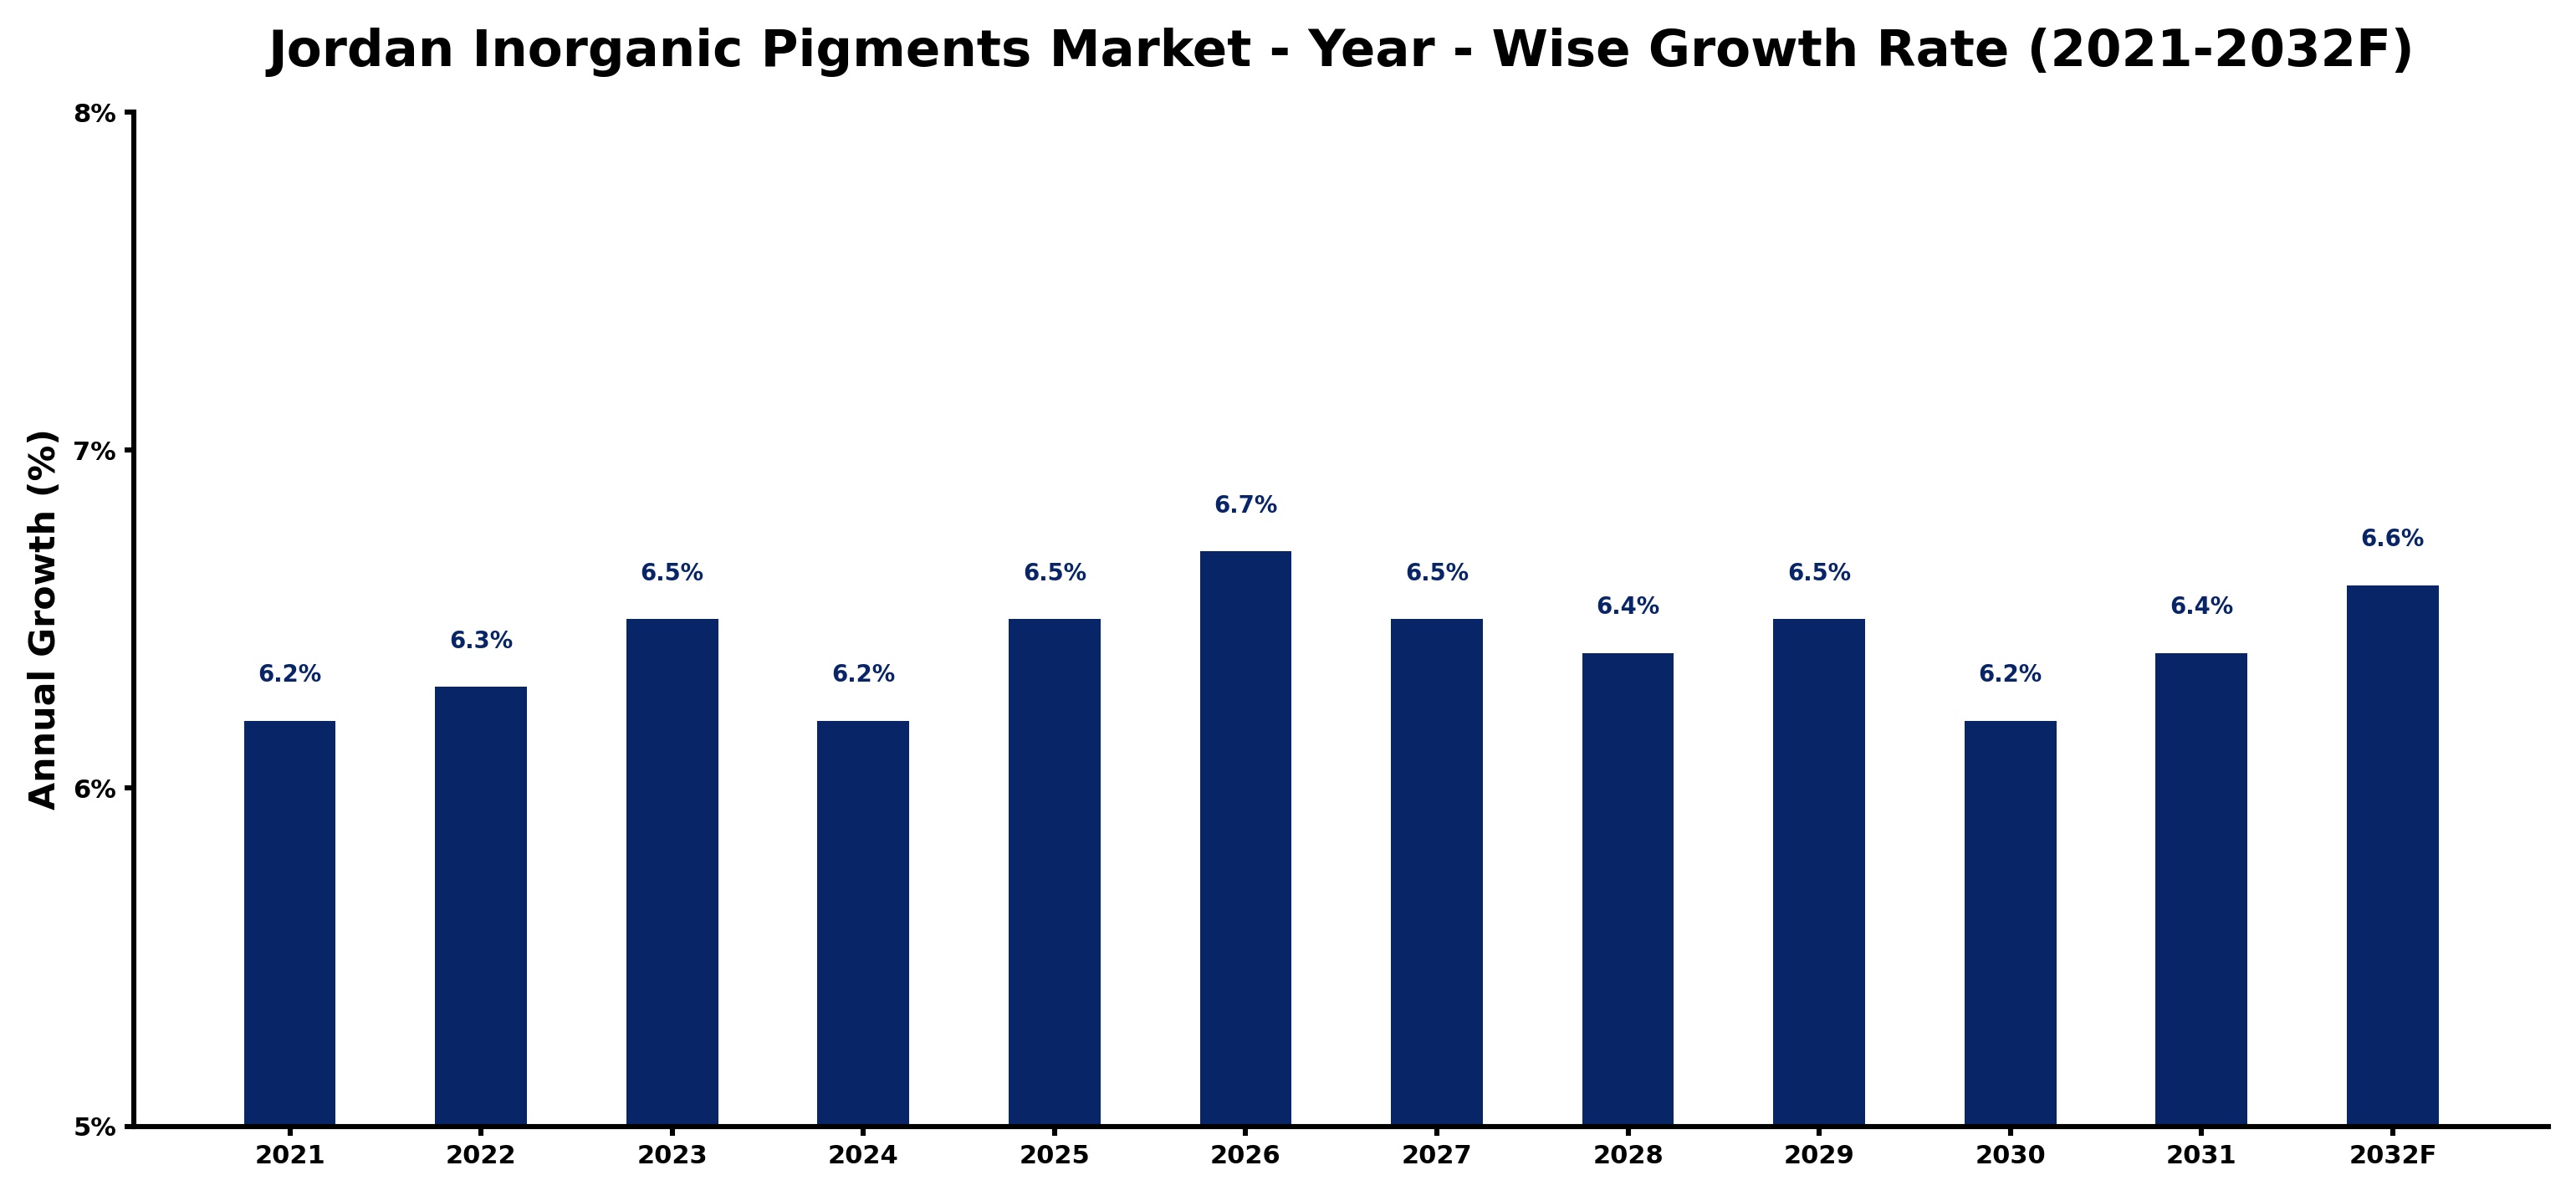
The table below presents the year‑wise growth rates along with the key drivers influencing the market
| Year | Growth Rate | Major Drivers |
| 2021 | 6.2% | Construction sector demand increased significantly |
| 2022 | 6.3% | Automotive industry growth expanded usage |
| 2023 | 6.5% | Paint and coatings market surged |
| 2024 | 6.2% | Consumer goods production expanded rapidly |
| 2025 | 6.5% | Textile industry demand improved significantly |
| 2026 | 6.7% | Electronics manufacturing growth accelerated |
| 2027 | 6.5% | Infrastructure projects drove pigment usage |
| 2028 | 6.4% | Sustainable product demand increased notably |
| 2029 | 6.5% | Innovative applications expanded market reach |
| 2030 | 6.2% | Export opportunities enhanced market growth |
| 2031 | 6.4% | Research and development investments increased |
| 2032 | 6.6% | Regulatory support boosted industry expansion |
Note - Market size estimations and growth projections presented in this report are based on 6Wresearch’s advanced forecasting approach, validated with industry datasets as of June 2026.
Jordan Inorganic Pigments Market Synopsis
In recent years, the Jordan Inorganic Pigments Market has experienced significant momentum driven by advancements in pigment technology and rising construction demands. However, the market is now poised for a transformative phase, where sustainability and eco-friendliness are becoming central themes in production processes and product offerings.
As infrastructure projects gain traction and the need for resilient materials increases, stakeholders are challenged to innovate continuously. This evolution suggests a more competitive landscape, compelling manufacturers to embrace cutting-edge technologies and sustainable practices to maintain market relevance.
Jordan Inorganic Pigments Market Key Takeaways
- The market is driven by the demand for high-performance pigments across construction, automotive, and coatings industries.
- Government policies are favoring eco-friendly manufacturing practices, which align with market trends towards sustainability.
- Raw material costs and regulatory challenges pose operational hurdles for manufacturers in the region.
- Innovation in pigment technologies is essential for meeting the evolving needs of diverse industries.
- The growing infrastructure projects in Jordan significantly boost the demand for durable and high-quality pigments.
Evaluation of Restraints in Jordan Inorganic Pigments Market
Despite the promising growth outlook, the Jordan Inorganic Pigments Market faces several restraints that may limit its potential. A primary concern is the volatility in raw material costs, which can impact profit margins and pricing strategies. Moreover, stringent environmental regulations regarding chemical handling and disposal add to the complexities of production. Additionally, local manufacturers must navigate competitive pressures from imported pigments, which may offer more attractive pricing or superior quality. Continuous investment in research and development is necessary to address these challenges and foster innovation, but this can be a significant barrier for smaller players in the market.
Jordan Inorganic Pigments Market Trends
The market is witnessing several emerging trends that are reshaping demand dynamics. Notably, there is an increasing emphasis on the development of eco-friendly inorganic pigments that meet stringent environmental standards. Additionally, advancements in nanotechnology are paving the way for new pigment formulations that deliver enhanced performance and durability. As industries place greater importance on product life cycles and sustainability, the integration of recycled materials into pigment production processes is also gaining traction.
Jordan Inorganic Pigments Market Opportunities
Opportunities abound in the Jordan Inorganic Pigments Market as demand for innovative and sustainable pigment solutions continues to rise. The booming construction sector offers a fertile ground for growth, with major infrastructure projects requiring pigments that are both durable and aesthetically appealing. Furthermore, collaborations with international firms can enhance technological capabilities, leading to the development of advanced pigment solutions tailored to specific industry needs. Investments in R&D focused on sustainability can position companies as leaders in an increasingly eco-conscious market.
Government Initiatives in the Jordan Inorganic Pigments Market
The Jordanian government has established several initiatives that promote sustainable practices within the inorganic pigments market. These include subsidies for manufacturers who adopt green technologies and incentives for projects that focus on eco-friendly production methods. Additionally, there is a growing push for partnerships with international companies to facilitate technology transfer and improve local manufacturing capabilities. Stricter regulations on hazardous substances in production further encourage companies to innovate towards safer, more environmentally responsible solutions.
Future Insights of the Jordan Inorganic Pigments Market
Looking ahead to the period from 2026 to 2032, the Jordan Inorganic Pigments Market is expected to evolve significantly. The convergence of technological advancements and heightened awareness of sustainability will likely redefine product offerings. As demand for high-performance pigments continues to expand, manufacturers will be compelled to innovate while balancing cost-effectiveness and regulatory compliance. Overall, the market is poised for steady growth, driven by a robust construction sector and an increasing focus on eco-friendly materials.
Jordan Inorganic Pigments Market Latest Developments (May 2025 - June 2026)
Recent developments in the Jordan Inorganic Pigments Market indicate a continued shift towards innovation and sustainability. Manufacturers are increasingly investing in research to develop new formulations that enhance performance while minimizing environmental impact. Additionally, collaborations and partnerships aimed at leveraging advanced technologies have gained prominence, facilitating the introduction of novel pigment solutions into the market. The emphasis on quality and compliance with stricter environmental regulations will continue to shape the landscape in the coming years.
Jordan Inorganic Pigments Market - Key Attractiveness of the Report
- 10 Years of Market Numbers
- Historical Data Starting from 2022 to 2025
- Base Year: 2025
- Forecast Data until 2032
- Key Performance Indicators Impacting the Market
- Major Upcoming Developments and Projects
Key Highlights of the Report:
- Jordan Inorganic Pigments Market Outlook
- Market Size of Jordan Inorganic Pigments Market, 2025
- Forecast of Jordan Inorganic Pigments Market, 2032
- Historical Data and Forecast of Jordan Inorganic Pigments Revenues & Volume for the Period 2022-2032F
- Jordan Inorganic Pigments Market Trend Evolution
- Jordan Inorganic Pigments Market Drivers and Challenges
- Jordan Inorganic Pigments Price Trends
- Jordan Inorganic Pigments Porter's Five Forces
- Jordan Inorganic Pigments Industry Life Cycle
- Historical Data and Forecast of Jordan Inorganic Pigments Market Revenues & Volume By Type for the Period 2022-2032F
- Historical Data and Forecast of Jordan Inorganic Pigments Market Revenues & Volume By Titanium Dioxide for the Period 2022-2032F
- Historical Data and Forecast of Jordan Inorganic Pigments Market Revenues & Volume By Iron Oxide, Cadmium for the Period 2022-2032F
- Historical Data and Forecast of Jordan Inorganic Pigments Market Revenues & Volume By Carbon Blank for the Period 2022-2032F
- Historical Data and Forecast of Jordan Inorganic Pigments Market Revenues & Volume By Lead Chromate for the Period 2022-2032F
- Historical Data and Forecast of Jordan Inorganic Pigments Market Revenues & Volume By Chromium Oxide for the Period 2022-2032F
- Historical Data and Forecast of Jordan Inorganic Pigments Market Revenues & Volume By Others for the Period 2022-2032F
- Historical Data and Forecast of Jordan Inorganic Pigments Market Revenues & Volume By Colour for the Period 2022-2032F
- Historical Data and Forecast of Jordan Inorganic Pigments Market Revenues & Volume By Red for the Period 2022-2032F
- Historical Data and Forecast of Jordan Inorganic Pigments Market Revenues & Volume By Yellow for the Period 2022-2032F
- Historical Data and Forecast of Jordan Inorganic Pigments Market Revenues & Volume By Orange for the Period 2022-2032F
- Historical Data and Forecast of Jordan Inorganic Pigments Market Revenues & Volume By Green for the Period 2022-2032F
- Historical Data and Forecast of Jordan Inorganic Pigments Market Revenues & Volume By Blue for the Period 2022-2032F
- Historical Data and Forecast of Jordan Inorganic Pigments Market Revenues & Volume By Black for the Period 2022-2032F
- Historical Data and Forecast of Jordan Inorganic Pigments Market Revenues & Volume By White for the Period 2022-2032F
- Historical Data and Forecast of Jordan Inorganic Pigments Market Revenues & Volume By Others for the Period 2022-2032F
- Historical Data and Forecast of Jordan Inorganic Pigments Market Revenues & Volume By Chemistry for the Period 2022-2032F
- Historical Data and Forecast of Jordan Inorganic Pigments Market Revenues & Volume By Oxide for the Period 2022-2032F
- Historical Data and Forecast of Jordan Inorganic Pigments Market Revenues & Volume By Silicate for the Period 2022-2032F
- Historical Data and Forecast of Jordan Inorganic Pigments Market Revenues & Volume By Carbonate for the Period 2022-2032F
- Historical Data and Forecast of Jordan Inorganic Pigments Market Revenues & Volume By Sulphate for the Period 2022-2032F
- Historical Data and Forecast of Jordan Inorganic Pigments Market Revenues & Volume By Sulphide for the Period 2022-2032F
- Historical Data and Forecast of Jordan Inorganic Pigments Market Revenues & Volume By Others for the Period 2022-2032F
- Historical Data and Forecast of Jordan Inorganic Pigments Market Revenues & Volume By Grade for the Period 2022-2032F
- Historical Data and Forecast of Jordan Inorganic Pigments Market Revenues & Volume By Food Grade for the Period 2022-2032F
- Historical Data and Forecast of Jordan Inorganic Pigments Market Revenues & Volume By Pharmaceutical Grade for the Period 2022-2032F
- Historical Data and Forecast of Jordan Inorganic Pigments Market Revenues & Volume By Industrial Grade for the Period 2022-2032F
- Historical Data and Forecast of Jordan Inorganic Pigments Market Revenues & Volume By Others for the Period 2022-2032F
- Historical Data and Forecast of Jordan Inorganic Pigments Market Revenues & Volume By Form for the Period 2022-2032F
- Historical Data and Forecast of Jordan Inorganic Pigments Market Revenues & Volume By Powder for the Period 2022-2032F
- Historical Data and Forecast of Jordan Inorganic Pigments Market Revenues & Volume By Liquid for the Period 2022-2032F
- Historical Data and Forecast of Jordan Inorganic Pigments Market Revenues & Volume By Application for the Period 2022-2032F
- Historical Data and Forecast of Jordan Inorganic Pigments Market Revenues & Volume By Plastics for the Period 2022-2032F
- Historical Data and Forecast of Jordan Inorganic Pigments Market Revenues & Volume By Paints & Coatings for the Period 2022-2032F
- Historical Data and Forecast of Jordan Inorganic Pigments Market Revenues & Volume By Printing Inks for the Period 2022-2032F
- Historical Data and Forecast of Jordan Inorganic Pigments Market Revenues & Volume By Glass & Ceramics for the Period 2022-2032F
- Historical Data and Forecast of Jordan Inorganic Pigments Market Revenues & Volume By Cosmetics for the Period 2022-2032F
- Historical Data and Forecast of Jordan Inorganic Pigments Market Revenues & Volume By Paper Industry for the Period 2022-2032F
- Historical Data and Forecast of Jordan Inorganic Pigments Market Revenues & Volume By Food Industry for the Period 2022-2032F
- Historical Data and Forecast of Jordan Inorganic Pigments Market Revenues & Volume By Others for the Period 2022-2032F
- Jordan Inorganic Pigments Import Export Trade Statistics
- Market Opportunity Assessment By Type
- Market Opportunity Assessment By Colour
- Market Opportunity Assessment By Chemistry
- Market Opportunity Assessment By Grade
- Market Opportunity Assessment By Form
- Market Opportunity Assessment By Application
- Jordan Inorganic Pigments Top Companies Market Share
- Jordan Inorganic Pigments Competitive Benchmarking By Technical and Operational Parameters
- Jordan Inorganic Pigments Company Profiles
- Jordan Inorganic Pigments Key Strategic Recommendations
Jordan Inorganic Pigments Market - Frequently Asked Questions
The Jordan Inorganic Pigments Market is estimated to grow from USD 433 Million in 2025 to USD 628 Million by 2032, achieving a CAGR of 5.5% during the 2026 to 2032 period.
The construction, automotive, and coatings industries are the primary sectors driving the demand for inorganic pigments, as they seek materials that offer durability and UV stability.
Government policies in Jordan are promoting sustainable manufacturing practices through subsidies for eco-friendly technologies and strict regulations on hazardous substances, fostering innovation and compliance within the industry.
Manufacturers face challenges related to rising raw material costs, compliance with stringent environmental regulations, and competition from imported pigments that can sometimes offer lower pricing or higher quality.
Sustainability is increasingly at the forefront, with a growing emphasis on developing eco-friendly pigments and integrating recycled materials into production processes to meet environmental standards and consumer expectations.
6Wresearch actively monitors the Jordan Inorganic Pigments Market and publishes its comprehensive annual report, highlighting emerging trends, growth drivers, revenue analysis, and forecast outlook. Our insights help businesses to make data-backed strategic decisions with ongoing market dynamics. Our analysts track relevent industries related to the Jordan Inorganic Pigments Market, allowing our clients with actionable intelligence and reliable forecasts tailored to emerging regional needs.
Yes, we provide customisation as per your requirements. To learn more, feel free to contact us on sales@6wresearch.com
1 Executive Summary |
2 Introduction |
2.1 Key Highlights of the Report |
2.2 Report Description |
2.3 Market Scope & Segmentation |
2.4 Research Methodology |
2.5 Assumptions |
3 Jordan Inorganic Pigments Market Overview |
3.1 Jordan Country Macro Economic Indicators |
3.2 Jordan Inorganic Pigments Market Revenues & Volume, 2022 & 2032F |
3.3 Jordan Inorganic Pigments Market - Industry Life Cycle |
3.4 Jordan Inorganic Pigments Market - Porter's Five Forces |
3.5 Jordan Inorganic Pigments Market Revenues & Volume Share, By Type, 2022 & 2032F |
3.6 Jordan Inorganic Pigments Market Revenues & Volume Share, By Colour, 2022 & 2032F |
3.7 Jordan Inorganic Pigments Market Revenues & Volume Share, By Chemistry, 2022 & 2032F |
3.8 Jordan Inorganic Pigments Market Revenues & Volume Share, By Grade, 2022 & 2032F |
3.9 Jordan Inorganic Pigments Market Revenues & Volume Share, By Form, 2022 & 2032F |
3.10 Jordan Inorganic Pigments Market Revenues & Volume Share, By Application, 2022 & 2032F |
4 Jordan Inorganic Pigments Market Dynamics |
4.1 Impact Analysis |
4.2 Market Drivers |
4.2.1 Growing demand for inorganic pigments in various industries such as construction, automotive, and packaging in Jordan |
4.2.2 Increasing investments in infrastructure development projects driving the demand for inorganic pigments |
4.2.3 Favorable government policies supporting the growth of the inorganic pigments market in Jordan |
4.3 Market Restraints |
4.3.1 Fluctuating raw material prices impacting the production costs of inorganic pigments |
4.3.2 Environmental regulations and concerns regarding the use of certain inorganic pigments affecting market growth |
5 Jordan Inorganic Pigments Market Trends |
6 Jordan Inorganic Pigments Market, By Types |
6.1 Jordan Inorganic Pigments Market, By Type |
6.1.1 Overview and Analysis |
6.1.2 Jordan Inorganic Pigments Market Revenues & Volume, By Type, 2022-2032F |
6.1.3 Jordan Inorganic Pigments Market Revenues & Volume, By Titanium Dioxide, 2022-2032F |
6.1.4 Jordan Inorganic Pigments Market Revenues & Volume, By Iron Oxide, Cadmium, 2022-2032F |
6.1.5 Jordan Inorganic Pigments Market Revenues & Volume, By Carbon Blank, 2022-2032F |
6.1.6 Jordan Inorganic Pigments Market Revenues & Volume, By Lead Chromate, 2022-2032F |
6.1.7 Jordan Inorganic Pigments Market Revenues & Volume, By Chromium Oxide, 2022-2032F |
6.1.8 Jordan Inorganic Pigments Market Revenues & Volume, By Others, 2022-2032F |
6.2 Jordan Inorganic Pigments Market, By Colour |
6.2.1 Overview and Analysis |
6.2.2 Jordan Inorganic Pigments Market Revenues & Volume, By Red, 2022-2032F |
6.2.3 Jordan Inorganic Pigments Market Revenues & Volume, By Yellow, 2022-2032F |
6.2.4 Jordan Inorganic Pigments Market Revenues & Volume, By Orange, 2022-2032F |
6.2.5 Jordan Inorganic Pigments Market Revenues & Volume, By Green, 2022-2032F |
6.2.6 Jordan Inorganic Pigments Market Revenues & Volume, By Blue, 2022-2032F |
6.2.7 Jordan Inorganic Pigments Market Revenues & Volume, By Black, 2022-2032F |
6.2.8 Jordan Inorganic Pigments Market Revenues & Volume, By Others, 2022-2032F |
6.2.9 Jordan Inorganic Pigments Market Revenues & Volume, By Others, 2022-2032F |
6.3 Jordan Inorganic Pigments Market, By Chemistry |
6.3.1 Overview and Analysis |
6.3.2 Jordan Inorganic Pigments Market Revenues & Volume, By Oxide, 2022-2032F |
6.3.3 Jordan Inorganic Pigments Market Revenues & Volume, By Silicate, 2022-2032F |
6.3.4 Jordan Inorganic Pigments Market Revenues & Volume, By Carbonate, 2022-2032F |
6.3.5 Jordan Inorganic Pigments Market Revenues & Volume, By Sulphate, 2022-2032F |
6.3.6 Jordan Inorganic Pigments Market Revenues & Volume, By Sulphide, 2022-2032F |
6.3.7 Jordan Inorganic Pigments Market Revenues & Volume, By Others, 2022-2032F |
6.4 Jordan Inorganic Pigments Market, By Grade |
6.4.1 Overview and Analysis |
6.4.2 Jordan Inorganic Pigments Market Revenues & Volume, By Food Grade, 2022-2032F |
6.4.3 Jordan Inorganic Pigments Market Revenues & Volume, By Pharmaceutical Grade, 2022-2032F |
6.4.4 Jordan Inorganic Pigments Market Revenues & Volume, By Industrial Grade, 2022-2032F |
6.4.5 Jordan Inorganic Pigments Market Revenues & Volume, By Others, 2022-2032F |
6.5 Jordan Inorganic Pigments Market, By Form |
6.5.1 Overview and Analysis |
6.5.2 Jordan Inorganic Pigments Market Revenues & Volume, By Powder, 2022-2032F |
6.5.3 Jordan Inorganic Pigments Market Revenues & Volume, By Liquid, 2022-2032F |
6.6 Jordan Inorganic Pigments Market, By Application |
6.6.1 Overview and Analysis |
6.6.2 Jordan Inorganic Pigments Market Revenues & Volume, By Plastics, 2022-2032F |
6.6.3 Jordan Inorganic Pigments Market Revenues & Volume, By Paints & Coatings, 2022-2032F |
6.6.4 Jordan Inorganic Pigments Market Revenues & Volume, By Printing Inks, 2022-2032F |
6.6.5 Jordan Inorganic Pigments Market Revenues & Volume, By Glass & Ceramics, 2022-2032F |
6.6.6 Jordan Inorganic Pigments Market Revenues & Volume, By Cosmetics, 2022-2032F |
6.6.7 Jordan Inorganic Pigments Market Revenues & Volume, By Paper Industry, 2022-2032F |
6.6.8 Jordan Inorganic Pigments Market Revenues & Volume, By Others, 2022-2032F |
6.6.9 Jordan Inorganic Pigments Market Revenues & Volume, By Others, 2022-2032F |
7 Jordan Inorganic Pigments Market Import-Export Trade Statistics |
7.1 Jordan Inorganic Pigments Market Export to Major Countries |
7.2 Jordan Inorganic Pigments Market Imports from Major Countries |
8 Jordan Inorganic Pigments Market Key Performance Indicators |
8.1 Research and development investments in new and innovative inorganic pigment formulations |
8.2 Adoption rate of sustainable and eco-friendly inorganic pigments in the market |
8.3 Number of new product launches and technological advancements in the inorganic pigments sector |
9 Jordan Inorganic Pigments Market - Opportunity Assessment |
9.1 Jordan Inorganic Pigments Market Opportunity Assessment, By Type, 2022 & 2032F |
9.2 Jordan Inorganic Pigments Market Opportunity Assessment, By Colour, 2022 & 2032F |
9.3 Jordan Inorganic Pigments Market Opportunity Assessment, By Chemistry, 2022 & 2032F |
9.4 Jordan Inorganic Pigments Market Opportunity Assessment, By Grade, 2022 & 2032F |
9.5 Jordan Inorganic Pigments Market Opportunity Assessment, By Form, 2022 & 2032F |
9.6 Jordan Inorganic Pigments Market Opportunity Assessment, By Application, 2022 & 2032F |
10 Jordan Inorganic Pigments Market - Competitive Landscape |
10.1 Jordan Inorganic Pigments Market Revenue Share, By Companies, 2025 |
10.2 Jordan Inorganic Pigments Market Competitive Benchmarking, By Operating and Technical Parameters |
11 Company Profiles |
12 Recommendations |
13 Disclaimer |
Global Go To Market Strategy - 2030
Export potential enables firms to identify high-growth global markets with greater confidence by combining advanced trade intelligence with a structured quantitative methodology. The framework analyzes emerging demand trends and country-level import patterns while integrating macroeconomic and trade datasets such as GDP and population forecasts, bilateral import–export flows, tariff structures, elasticity differentials between developed and developing economies, geographic distance, and import demand projections. Using weighted trade values from 2020–2024 as the base period to project country-to-country export potential for 2030, these inputs are operationalized through calculated drivers such as gravity model parameters, tariff impact factors, and projected GDP per-capita growth. Through an analysis of hidden potentials, demand hotspots, and market conditions that are most favorable to success, this method enables firms to focus on target countries, maximize returns, and global expansion with data, backed by accuracy.
By factoring in the projected importer demand gap that is currently unmet and could be potential opportunity, it identifies the potential for the Exporter (Country) among 190 countries, against the general trade analysis, which identifies the biggest importer or exporter.
To discover high-growth global markets and optimize your business strategy:
Click Here
Pricing
- Single User License$ 1,995
- Department License$ 2,400
- Site License$ 3,120
- Global License$ 3,795

Leadership Perspectives from Industry Events
Search
Thought Leadership and Analyst Meet


Our Clients
6WResearch In News
- India Air Conditioner Market Set for Strong Rebound in 2026 After Weather-Led Correction and GST-Driven Recovery: 6Wresearch
- ADAS in India: How Automatic Emergency Braking, Blind Spot Detection & Driver Monitoring are Transforming Road Safety
- Doha a strategic location for EV manufacturing hub: IPA Qatar
- Demand for luxury TVs surging in the GCC, says Samsung
- Empowering Growth: The Thriving Journey of Bangladesh’s Cable Industry
- Demand for luxury TVs surging in the GCC, says Samsung
Latest Reports
- Nicaragua RPG Gaming Market (2026-2032)
- New Zealand RPG Gaming Market (2026-2032)
- Netherlands RPG Gaming Market (2026-2032)
- Nauru RPG Gaming Market (2026-2032)
- Namibia RPG Gaming Market (2026-2032)
- Mozambique RPG Gaming Market (2026-2032)
- Montenegro RPG Gaming Market (2026-2032)
- Mongolia RPG Gaming Market (2026-2032)
- Monaco RPG Gaming Market (2026-2032)
- Micronesia RPG Gaming Market (2026-2032)
Industry Events and Analyst Meet

EV India Expo 2026

HIMTEX 2026

India Refining Summit 2026

India EV Show 2026

EV tech India Expo 2026
Whitepaper
- Middle East & Africa Commercial Security Market Click here to view more.
- Middle East & Africa Fire Safety Systems & Equipment Market Click here to view more.
- GCC Drone Market Click here to view more.
- Middle East Lighting Fixture Market Click here to view more.
- GCC Physical & Perimeter Security Market Click here to view more.