Jordan Optical Glass Market (2026-2032) Outlook | Trends, Share, Growth, Analysis, Size, Revenue, Industry, Forecast, Value & Companies
Market Forecast By Type (Colorless, Colored), By Supply Form (Plate, Round Plate, Worked Rod, Prism, Others), By Application (Consumer Optics, Astronomy, Industrial Equipment, Medical & Biotech, Electronics & Semiconductors, Others) And Competitive Landscape
| Product Code: ETC125036 | Publication Date: Jun 2021 | Updated Date: Jun 2026 | Product Type: Report | |
| Publisher: 6Wresearch | Author: Dhaval Chaurasia | No. of Pages: 70 | No. of Figures: 35 | No. of Tables: 5 |
Jordan Optical Glass Market Size, Share & Growth Rate
The Jordan Optical Glass Market was estimated at USD 394 Million in 2025 and is projected to reach USD 521 Million by 2032, growing at a CAGR of 4.1% from 2026 to 2032. This growth trajectory is fueled by the rising demand for high-quality optical components across critical sectors including healthcare, defense, and telecommunications. As technology advances, industries are increasingly integrating optical glass in innovative applications, creating a robust environment for market expansion.
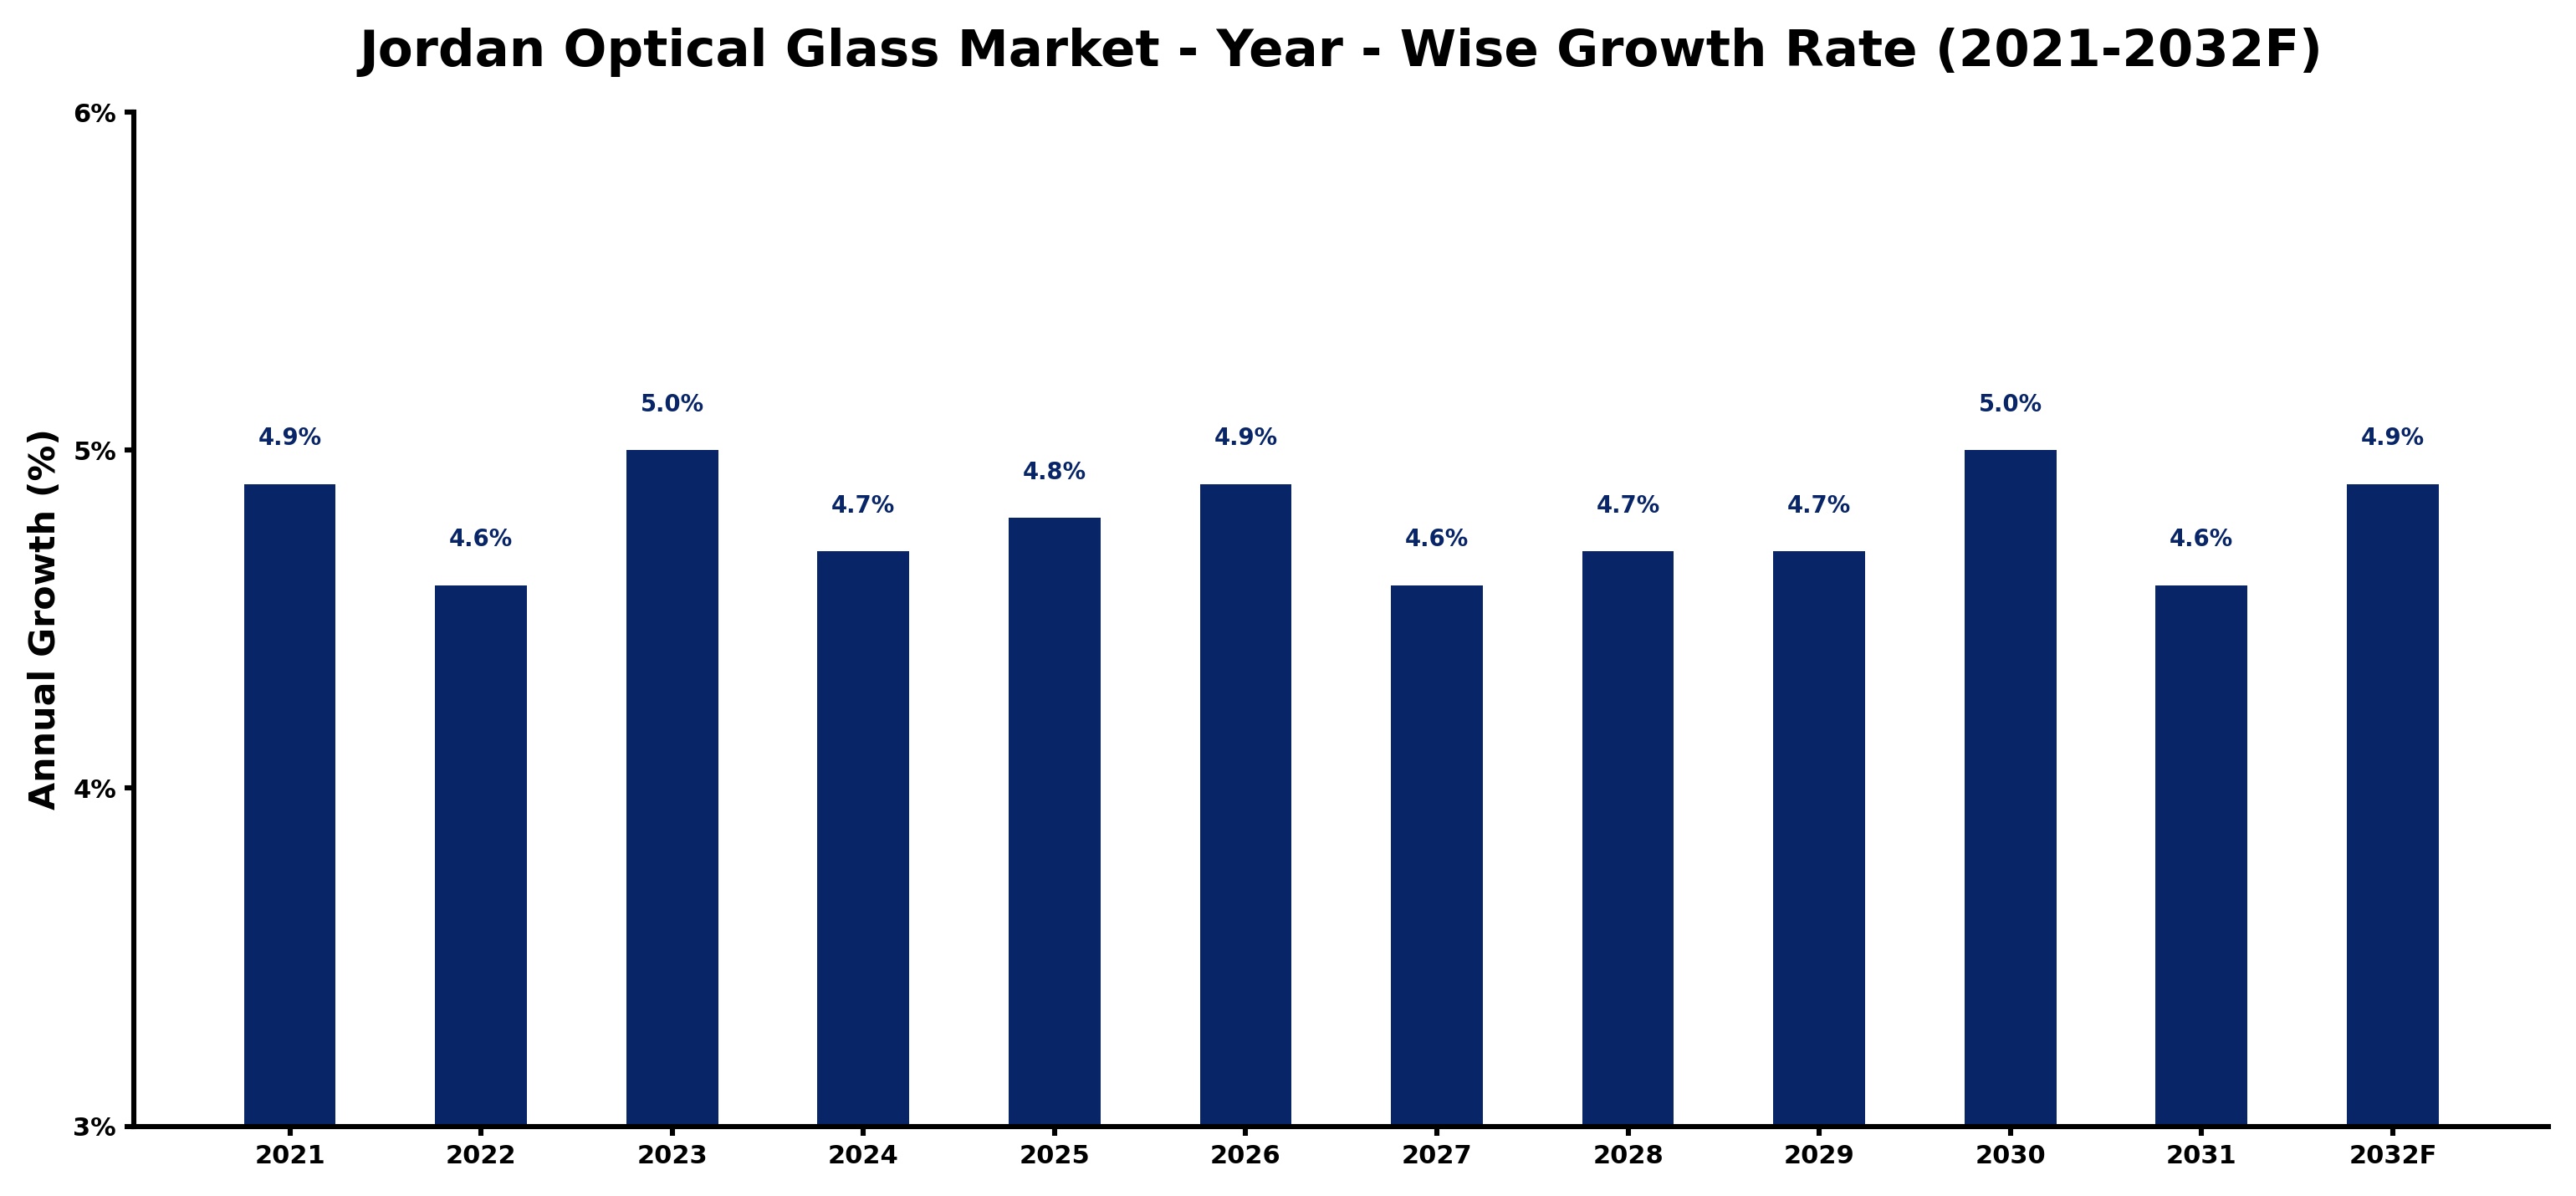
Jordan Optical Glass Market Growth Rate Analysis (2021-2032)
The Jordan Optical Glass market has shown an overall stable growth pattern, with annual growth rates fluctuating between 4.6% and 5.0%. In 2021, the market grew by 4.9%, fueled by increasing consumer demand for high-quality optical products. However, a slight decline to 4.6% in 2022 can be attributed to supply chain disruptions and rising material costs. The market rebounded to a robust 5.0% in 2023 thanks to substantial investments in technology and infrastructure upgrades. As we look towards 2024 and beyond, steady growth is anticipated due to ongoing digitalization and evolving consumer preferences towards enhanced optical solutions, maintaining a range of 4.6% to 4.9% through 2032.
Jordan Optical Glass Market Year-wise Growth Rate and Key Drivers
This graph highlights how the Jordan Optical Glass Market has steadily grown over the past five years, supported by major growth factors.
The table below presents the year‑wise growth rates along with the key drivers influencing the market
| Year | Growth Rate | Major Drivers |
| 2021 | 4.9% | New glass manufacturing facility boosts Jordan's export capacity significantly |
| 2022 | 4.6% | Optical glass production upgrades boost export capacity and quality |
| 2023 | 5.0% | Increased regional demand spurred local optical glass manufacturing capacity |
| 2024 | 4.7% | Local demand for precision optics drives investments in manufacturing technology |
| 2025 | 4.8% | Advanced production techniques boost optical glass precision manufacturing capacity |
| 2026 | 4.9% | New glass manufacturing facilities boosted local optical component output |
| 2027 | 4.6% | Domestic manufacturers adopt advanced glass melting technologies for efficiency |
| 2028 | 4.7% | Export driven manufacturing investments boost local optical glass production capabilities |
| 2029 | 4.7% | Surge in construction projects boosted optical glass manufacturing demands |
| 2030 | 5.0% | Technology integration in production lines boosts optical glass efficiency |
| 2031 | 4.6% | Jordan's optical glass exports boost local manufacturing investment initiatives |
| 2032 | 4.9% | Export driven demand for advanced optics spurred manufacturing investment expansion |
Note - Market size estimations and growth projections presented in this report are based on 6Wresearch’s advanced forecasting approach, validated with industry datasets as of June 2026.
Jordan Optical Glass Market Synopsis
The demand for specialty optical glasses is particularly strong within Jordan's healthcare and telecommunications sectors, where precision and clarity are paramount. This local focus is further supported by advancements in manufacturing techniques, which are enhancing the quality and versatility of optical glass products.
Moreover, Jordan's strategic geographic location serves as a crucial advantage, facilitating trade routes and distribution channels for optical glass products. As companies continue to innovate and diversify their product offerings, the market is positioned for substantial growth and increased competitiveness.
Jordan Optical Glass Market Key Takeaways
- The market is experiencing steady growth due to technological advancements in optical applications.
- Jordan’s strong infrastructure and strategic location play a critical role in facilitating trade.
- There is a notable shift towards sustainability in manufacturing practices.
- Investment in R&D is driving the development of specialized optical solutions.
- The competitive landscape is intensifying as local and international players innovate rapidly.
Evaluation of Restraints in Jordan Optical Glass Market
Despite the promising prospects, several factors pose challenges to the Jordan Optical Glass Market. The landscape is increasingly competitive, with foreign players entering the market with lower-priced products, potentially undercutting local businesses. Additionally, the limited domestic production capacity forces reliance on imports, impacting overall profitability. Fluctuating raw material costs can further compress margins, while regulatory complexities may impede operational efficiencies. Addressing these restraints demands strategic foresight and collaboration within the industry.
Jordan Optical Glass Market Trends
Currently, a key trend within the Jordan Optical Glass Market is the focus on advanced technologies and innovative product development. Companies are emphasizing the creation of customized optical glass solutions to meet specific needs in sectors like aerospace and virtual reality. Moreover, there is a growing commitment to environmental sustainability in production methods, leading to a reduction in energy consumption and waste.
Jordan Optical Glass Market Opportunities
Significant opportunities for investment and growth exist within the Jordan Optical Glass Market, particularly for those targeting specialized optical components. The ongoing demand from emerging sectors such as autonomous vehicles presents new avenues for development. Additionally, leveraging Jordan’s stable political climate and regulatory support can attract foreign investment, further enhancing market capabilities.
Government Initiatives in the Jordan Optical Glass Market
The Jordanian government has initiated various policies aimed at bolstering the optical glass market, including incentives and tax breaks designed to stimulate local manufacturing. Partnerships with international organizations have been established to elevate the quality and competitiveness of domestic products. Furthermore, regulations are in place to ensure adherence to environmental standards, promoting sustainable practices within the industry.
Future Insights of the Jordan Optical Glass Market
Looking ahead, the Jordan Optical Glass Market is poised for growth driven by sustained demand for optical components across diverse industries. The rise of sophisticated technologies, particularly in areas like augmented reality and telecommunications, will continue to expand application possibilities. With ongoing government support and a skilled workforce, the market is well-positioned to capitalize on these trends and achieve further advancements.
Jordan Optical Glass Market Latest Developments (May 2025 - June 2026)
Recent developments in the Jordan Optical Glass Market indicate a concerted push towards innovation and collaboration among local manufacturers. There has been increased activity surrounding research initiatives aimed at developing next-generation optical materials. Additionally, partnerships are being formed between industry stakeholders to enhance product offerings and streamline distribution networks, reflecting a dynamic and evolving market landscape.
Jordan Optical Glass Market - Key Attractiveness of the Report
- 10 Years of Market Numbers
- Historical Data Starting from 2022 to 2025
- Base Year: 2025
- Forecast Data until 2032
- Key Performance Indicators Impacting the Market
- Major Upcoming Developments and Projects
Key Highlights of the Report:
- Jordan Optical Glass Market Outlook
- Market Size of Jordan Optical Glass Market, 2025
- Forecast of Jordan Optical Glass Market, 2032
- Historical Data and Forecast of Jordan Optical Glass Revenues & Volume for the Period 2022-2032F
- Jordan Optical Glass Market Trend Evolution
- Jordan Optical Glass Market Drivers and Challenges
- Jordan Optical Glass Price Trends
- Jordan Optical Glass Porter's Five Forces
- Jordan Optical Glass Industry Life Cycle
- Historical Data and Forecast of Jordan Optical Glass Market Revenues & Volume By Type for the Period 2022-2032F
- Historical Data and Forecast of Jordan Optical Glass Market Revenues & Volume By Colorless for the Period 2022-2032F
- Historical Data and Forecast of Jordan Optical Glass Market Revenues & Volume By Colored for the Period 2022-2032F
- Historical Data and Forecast of Jordan Optical Glass Market Revenues & Volume By Supply Form for the Period 2022-2032F
- Historical Data and Forecast of Jordan Optical Glass Market Revenues & Volume By Plate for the Period 2022-2032F
- Historical Data and Forecast of Jordan Optical Glass Market Revenues & Volume By Round Plate for the Period 2022-2032F
- Historical Data and Forecast of Jordan Optical Glass Market Revenues & Volume By Worked Rod for the Period 2022-2032F
- Historical Data and Forecast of Jordan Optical Glass Market Revenues & Volume By Prism for the Period 2022-2032F
- Historical Data and Forecast of Jordan Optical Glass Market Revenues & Volume By Others for the Period 2022-2032F
- Historical Data and Forecast of Jordan Optical Glass Market Revenues & Volume By Application for the Period 2022-2032F
- Historical Data and Forecast of Jordan Optical Glass Market Revenues & Volume By Consumer Optics for the Period 2022-2032F
- Historical Data and Forecast of Jordan Optical Glass Market Revenues & Volume By Astronomy for the Period 2022-2032F
- Historical Data and Forecast of Jordan Optical Glass Market Revenues & Volume By Industrial Equipment for the Period 2022-2032F
- Historical Data and Forecast of Jordan Optical Glass Market Revenues & Volume By Medical & Biotech for the Period 2022-2032F
- Historical Data and Forecast of Jordan Optical Glass Market Revenues & Volume By Electronics & Semiconductors for the Period 2022-2032F
- Historical Data and Forecast of Jordan Optical Glass Market Revenues & Volume By Others for the Period 2022-2032F
- Jordan Optical Glass Import Export Trade Statistics
- Market Opportunity Assessment By Type
- Market Opportunity Assessment By Supply Form
- Market Opportunity Assessment By Application
- Jordan Optical Glass Top Companies Market Share
- Jordan Optical Glass Competitive Benchmarking By Technical and Operational Parameters
- Jordan Optical Glass Company Profiles
- Jordan Optical Glass Key Strategic Recommendations
Jordan Optical Glass Market - Frequently Asked Questions
The growth is primarily driven by increased demand for high-quality optical components in healthcare, defense, and telecommunications, coupled with advancements in technology.
The market was estimated at USD 394 Million in 2025 and is projected to reach USD 521 Million by 2032, growing at a CAGR of 4.1% from 2026 to 2032.
A growing focus on environmentally friendly production methods, including waste reduction and energy efficiency, is shaping industry practices.
Yes, the market presents promising opportunities, especially in specialized optical components, driven by Jordan’s stable political environment and supportive government policies.
Challenges include increasing competition from lower-priced international products and limited domestic production capacity, which can impact market stability.
6Wresearch actively monitors the Jordan Optical Glass Market and publishes its comprehensive annual report, highlighting emerging trends, growth drivers, revenue analysis, and forecast outlook. Our insights help businesses to make data-backed strategic decisions with ongoing market dynamics. Our analysts track relevent industries related to the Jordan Optical Glass Market, allowing our clients with actionable intelligence and reliable forecasts tailored to emerging regional needs.
Yes, we provide customisation as per your requirements. To learn more, feel free to contact us on sales@6wresearch.com
Jordan Optical Glass |
1 Executive Summary |
2 Introduction |
2.1 Key Highlights of the Report |
2.2 Report Description |
2.3 Market Scope & Segmentation |
2.4 Research Methodology |
2.5 Assumptions |
3 Jordan Optical Glass Market Overview |
3.1 Jordan Country Macro Economic Indicators |
3.2 Jordan Optical Glass Market Revenues & Volume, 2022 & 2032F |
3.3 Jordan Optical Glass Market - Industry Life Cycle |
3.4 Jordan Optical Glass Market - Porter's Five Forces |
3.5 Jordan Optical Glass Market Revenues & Volume Share, By Type, 2022 & 2032F |
3.6 Jordan Optical Glass Market Revenues & Volume Share, By Supply Form, 2022 & 2032F |
3.7 Jordan Optical Glass Market Revenues & Volume Share, By Form, 2022 & 2032F |
4 Jordan Optical Glass Market Dynamics |
4.1 Impact Analysis |
4.2 Market Drivers |
4.3 Market Restraints |
5 Jordan Optical Glass Market Trends |
6 Jordan Optical Glass Market, By Types |
6.1 Jordan Optical Glass Market, By Type |
6.1.1 Overview and Analysis |
6.1.2 Jordan Optical Glass Market Revenues & Volume, By Type, 2022-2032F |
6.1.3 Jordan Optical Glass Market Revenues & Volume, By Colorless, 2022-2032F |
6.1.4 Jordan Optical Glass Market Revenues & Volume, By Colored, 2022-2032F |
6.2 Jordan Optical Glass Market, By Supply Form |
6.2.1 Overview and Analysis |
6.2.2 Jordan Optical Glass Market Revenues & Volume, By Plate, 2022-2032F |
6.2.3 Jordan Optical Glass Market Revenues & Volume, By Round Plate, 2022-2032F |
6.2.4 Jordan Optical Glass Market Revenues & Volume, By Worked Rod, 2022-2032F |
6.2.5 Jordan Optical Glass Market Revenues & Volume, By Prism, 2022-2032F |
6.2.6 Jordan Optical Glass Market Revenues & Volume, By Others, 2022-2032F |
6.3 Jordan Optical Glass Market, By Application |
6.3.1 Overview and Analysis |
6.3.2 Jordan Optical Glass Market Revenues & Volume, By Consumer Optics, 2022-2032F |
6.3.3 Jordan Optical Glass Market Revenues & Volume, By Astronomy, 2022-2032F |
6.3.4 Jordan Optical Glass Market Revenues & Volume, By Industrial Equipment, 2022-2032F |
6.3.5 Jordan Optical Glass Market Revenues & Volume, By Medical & Biotech, 2022-2032F |
6.3.6 Jordan Optical Glass Market Revenues & Volume, By Electronics & Semiconductors, 2022-2032F |
6.3.7 Jordan Optical Glass Market Revenues & Volume, By Others, 2022-2032F |
7 Jordan Optical Glass Market Import-Export Trade Statistics |
7.1 Jordan Optical Glass Market Export to Major Countries |
7.2 Jordan Optical Glass Market Imports from Major Countries |
8 Jordan Optical Glass Market Key Performance Indicators |
9 Jordan Optical Glass Market - Opportunity Assessment |
9.1 Jordan Optical Glass Market Opportunity Assessment, By Type, 2022 & 2032F |
9.2 Jordan Optical Glass Market Opportunity Assessment, By Supply Form, 2022 & 2032F |
9.3 Jordan Optical Glass Market Opportunity Assessment, By Application, 2022 & 2032F |
10 Jordan Optical Glass Market - Competitive Landscape |
10.1 Jordan Optical Glass Market Revenue Share, By Companies, 2025 |
10.2 Jordan Optical Glass Market Competitive Benchmarking, By Operating and Technical Parameters |
11 Company Profiles |
12 Recommendations |
13 Disclaimer |
Global Go To Market Strategy - 2030
Export potential enables firms to identify high-growth global markets with greater confidence by combining advanced trade intelligence with a structured quantitative methodology. The framework analyzes emerging demand trends and country-level import patterns while integrating macroeconomic and trade datasets such as GDP and population forecasts, bilateral import–export flows, tariff structures, elasticity differentials between developed and developing economies, geographic distance, and import demand projections. Using weighted trade values from 2020–2024 as the base period to project country-to-country export potential for 2030, these inputs are operationalized through calculated drivers such as gravity model parameters, tariff impact factors, and projected GDP per-capita growth. Through an analysis of hidden potentials, demand hotspots, and market conditions that are most favorable to success, this method enables firms to focus on target countries, maximize returns, and global expansion with data, backed by accuracy.
By factoring in the projected importer demand gap that is currently unmet and could be potential opportunity, it identifies the potential for the Exporter (Country) among 190 countries, against the general trade analysis, which identifies the biggest importer or exporter.
To discover high-growth global markets and optimize your business strategy:
Click Here
Pricing
- Single User License$ 1,995
- Department License$ 2,400
- Site License$ 3,120
- Global License$ 3,795

Leadership Perspectives from Industry Events
Search
Thought Leadership and Analyst Meet


Our Clients
6WResearch In News
- India Air Conditioner Market Set for Strong Rebound in 2026 After Weather-Led Correction and GST-Driven Recovery: 6Wresearch
- ADAS in India: How Automatic Emergency Braking, Blind Spot Detection & Driver Monitoring are Transforming Road Safety
- Doha a strategic location for EV manufacturing hub: IPA Qatar
- Demand for luxury TVs surging in the GCC, says Samsung
- Empowering Growth: The Thriving Journey of Bangladesh’s Cable Industry
- Demand for luxury TVs surging in the GCC, says Samsung
Latest Reports
- Poland Fire Protection Systems Market (2026-2032)
- Cape Verde Portable Hand-Thrown Extinguisher Market (2026-2032)
- Canada Portable Hand-Thrown Extinguisher Market (2026-2032)
- Cameroon Portable Hand-Thrown Extinguisher Market (2026-2032)
- Burundi Portable Hand-Thrown Extinguisher Market (2026-2032)
- Burkina Faso Portable Hand-Thrown Extinguisher Market (2026-2032)
- Bulgaria Portable Hand-Thrown Extinguisher Market (2026-2032)
- Brunei Portable Hand-Thrown Extinguisher Market (2026-2032)
- Botswana Portable Hand-Thrown Extinguisher Market (2026-2032)
- Bosnia and Herzegovina Portable Hand-Thrown Extinguisher Market (2026-2032)
Industry Events and Analyst Meet

HIMTEX 2026

India Refining Summit 2026

India EV Show 2026

EV tech India Expo 2026

Auto Tech Asia 2026
Whitepaper
- Middle East & Africa Commercial Security Market Click here to view more.
- Middle East & Africa Fire Safety Systems & Equipment Market Click here to view more.
- GCC Drone Market Click here to view more.
- Middle East Lighting Fixture Market Click here to view more.
- GCC Physical & Perimeter Security Market Click here to view more.