Jordan Phosphoric Acid Market (2026-2032) Outlook | Share, Trends, Revenue, Analysis, Industry, Value, Growth, Size, Forecast & Companies
Market Forecast By Process Type (Wet Process, Thermal Process, Others), By Application (Home Cleaning Agents, Fertilizer Chemicals), By Fertilizer Type (Mono-Ammonium Phosphate (MAP), Diammonium Phosphate (DAP), Triple Superphosphate (TSP)), By End-Users (Electronics, Beverage, Medical, Food, Fertilizer, Others), By Grade (Food-Grade, Technical Grade) And Competitive Landscape
| Product Code: ETC129533 | Publication Date: Jun 2021 | Updated Date: Jun 2026 | Product Type: Report | |
| Publisher: 6Wresearch | Author: Shubham Deep | No. of Pages: 70 | No. of Figures: 35 | No. of Tables: 5 |
Jordan Phosphoric Acid Market Size, Share & Growth Rate
The Jordan Phosphoric Acid Market was estimated at USD 498 Million in 2025 and is projected to reach USD 662 Million by 2032, growing at a CAGR of 4.2% from 2026 to 2032. This growth trajectory is primarily driven by the rising demand from the agricultural sector, where phosphoric acid is essential for fertilizer production. Additionally, the food processing industry and increased technological innovations in production methods are contributing to this upward trend.
Jordan Phosphoric Acid Market Year-wise Growth Rate and Key Drivers
This graph highlights how the Jordan Phosphoric Acid Market has steadily grown over the years, supported by major growth factors.
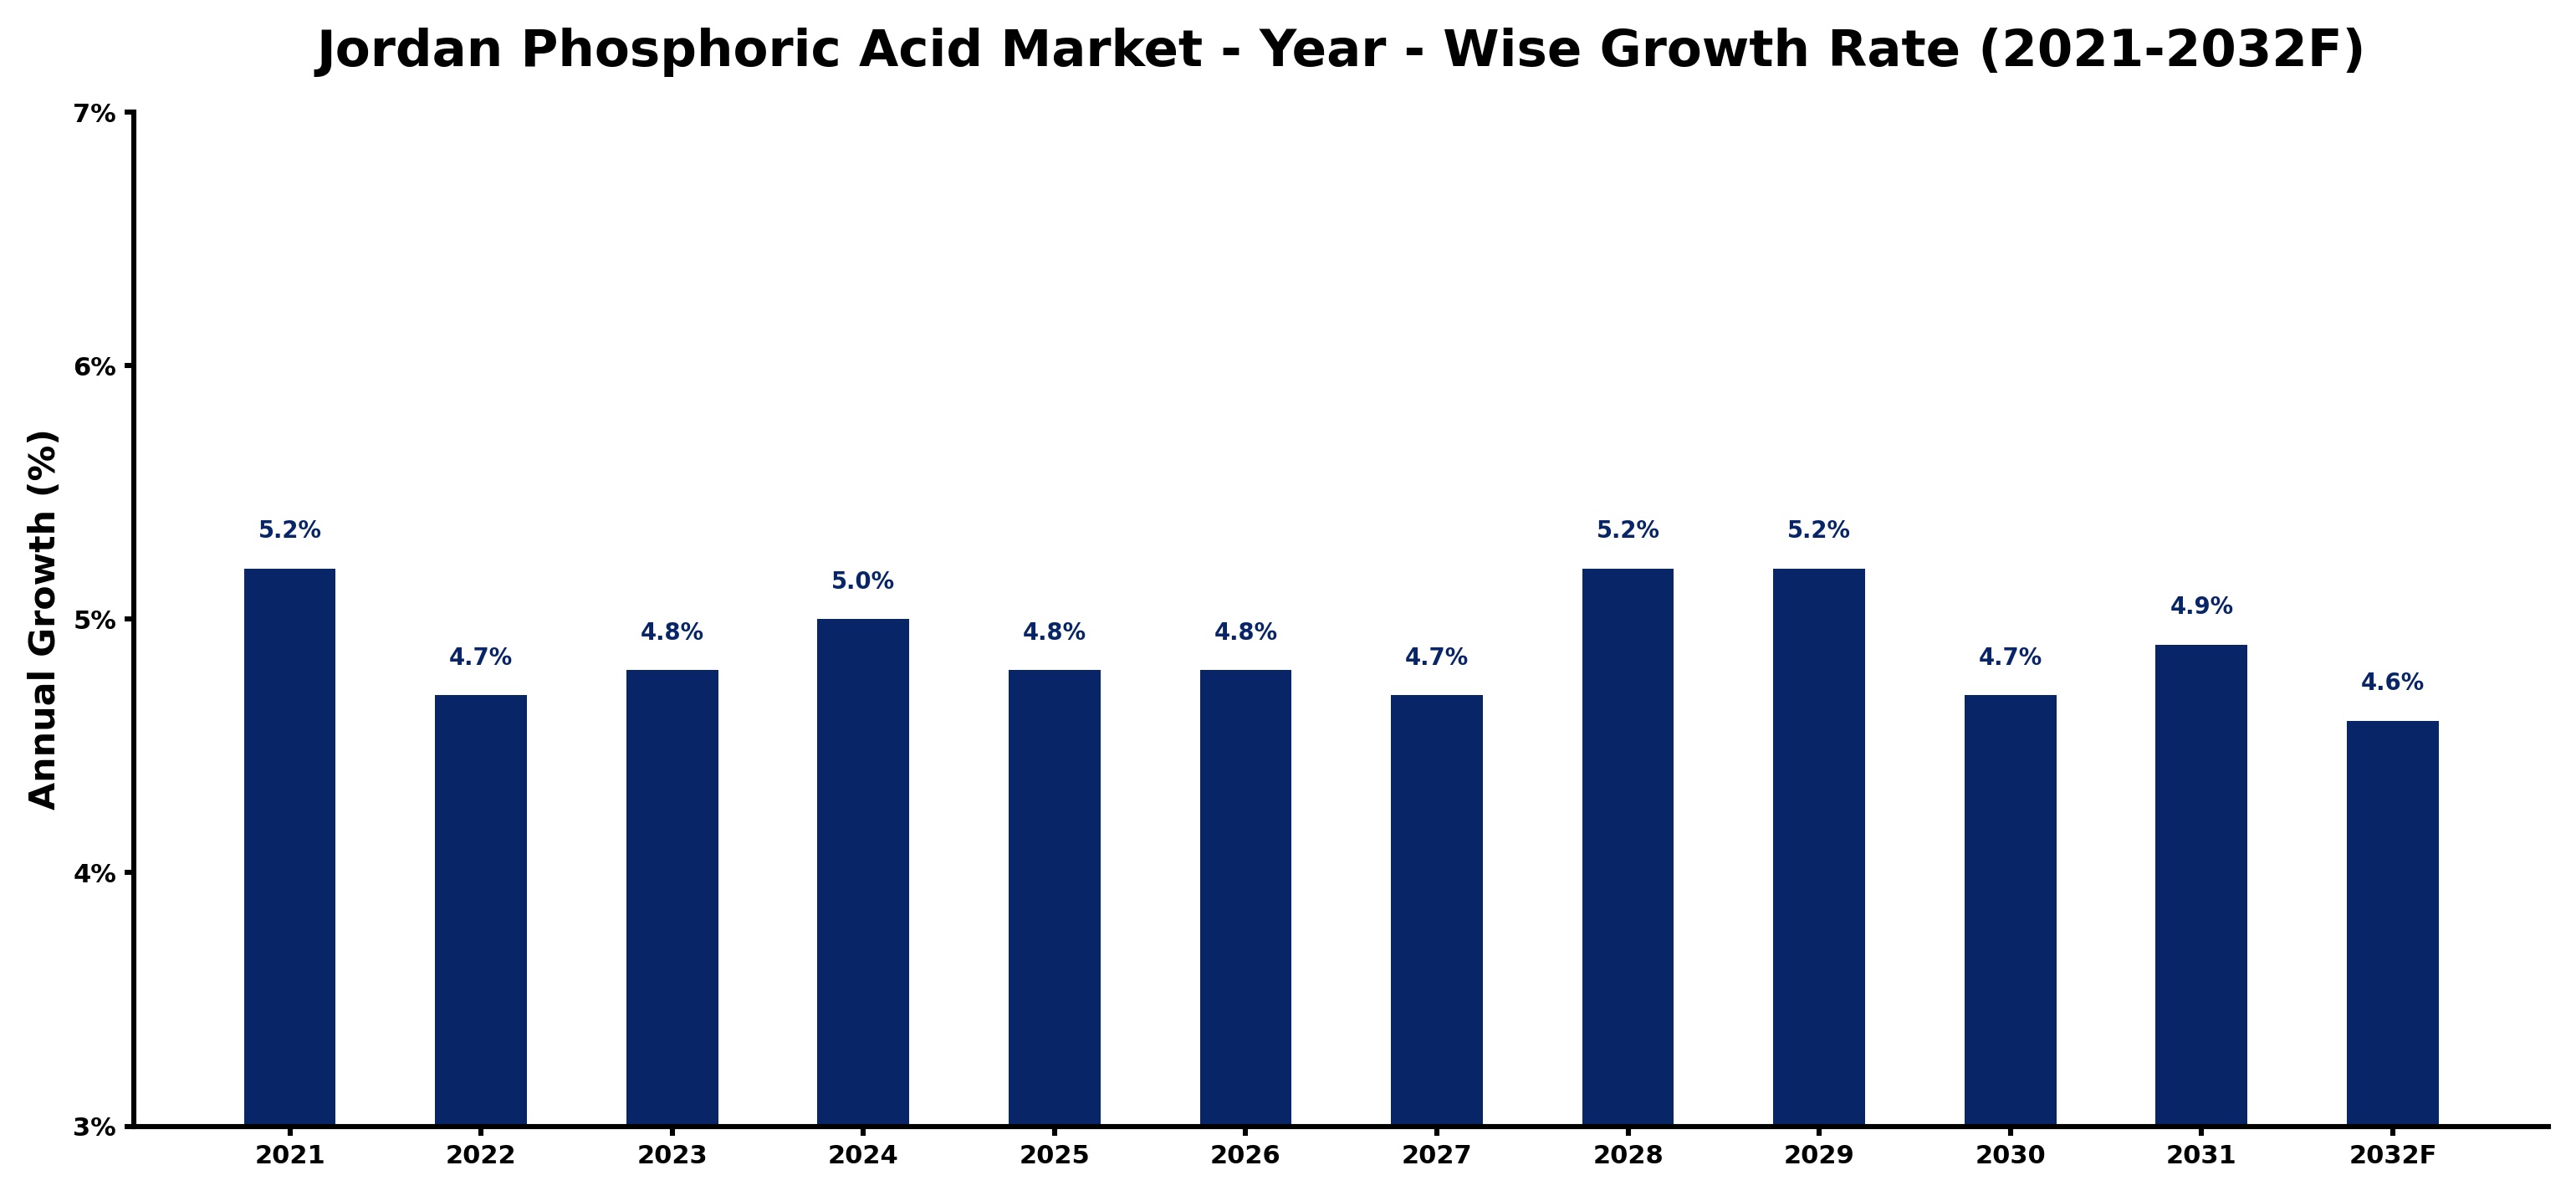
The table below presents the year‑wise growth rates along with the key drivers influencing the market
| Year | Growth Rate | Major Drivers |
| 2021 | 5.2% | Expansion of transportation and logistics networks |
| 2022 | 4.7% | Increasing industrial infrastructure investments |
| 2023 | 4.8% | Rising electricity demand across industries |
| 2024 | 5.0% | Expansion of commercial construction activities |
| 2025 | 4.8% | Increasing adoption of advanced technologies |
| 2026 | 4.8% | Growing renewable energy integration projects |
| 2027 | 4.7% | Increasing adoption of advanced technologies |
| 2028 | 5.2% | Government infrastructure modernization initiatives |
| 2029 | 5.2% | Rising electricity demand across industries |
| 2030 | 4.7% | Increasing industrial automation investments |
| 2031 | 4.9% | Government infrastructure modernization initiatives |
| 2032 | 4.6% | Growing renewable energy integration projects |
Note - Market size estimations and growth projections presented in this report are based on 6Wresearch’s advanced forecasting approach, validated with industry datasets as of June 2026.
Jordan Phosphoric Acid Market Synopsis
In Jordan, the phosphoric acid market benefits from an abundance of phosphate reserves, making it a critical component of the nation's chemical industry. The robust demand for phosphoric acid is fueled by its widespread application in fertilizers, vital for boosting agricultural productivity in the region.
Additionally, the commitment to sustainable production practices is reshaping the market landscape. As players increasingly prioritize eco-friendly processes, the focus on innovations that enhance efficiency and product quality is becoming a defining characteristic of the Jordanian phosphoric acid sector.
Jordan Phosphoric Acid Market Key Takeaways
- Jordan's rich phosphate reserves provide a competitive edge in global markets.
- Growing agricultural needs are substantially driving demand for phosphoric acid.
- The market is embracing sustainable practices and eco-friendly production methods.
- Investment in technology and capacity expansion is essential for meeting rising demand.
- The government actively promotes policies that support sustainable industry growth.
Evaluation of Restraints in Jordan Phosphoric Acid Market
Despite its strengths, the Jordan Phosphoric Acid Market faces several constraints. Fluctuations in global demand and price volatility for phosphate-based products can hinder market stability. Additionally, the region’s geopolitical environment poses risks to trade and export opportunities. Environmental concerns related to phosphate mining also create pressure for stricter regulations, potentially impacting production processes. Lastly, the industry must navigate infrastructure limitations that can impede growth and innovation.
Jordan Phosphoric Acid Market Trends
Current trends in the Jordan Phosphoric Acid Market indicate a notable shift towards sustainability. Producers are increasingly adopting eco-friendly manufacturing practices in response to consumer demand for green products. Furthermore, there is a growing emphasis on research and development, aiming to enhance production methods and develop value-added products. The convergence of agricultural needs and technological advancements signifies a transformative phase in the market.
Jordan Phosphoric Acid Market Opportunities
The market offers a multitude of investment opportunities, particularly in the expansion of phosphoric acid production facilities. As industries seek to diversify their offerings, ventures into value-added products such as specialty fertilizers and food additives present lucrative prospects. With strategic initiatives to bolster export capabilities, investors can capitalize on Jordan's advantageous geographical positioning to tap into regional markets, enhancing growth potential.
Government Initiatives in the Jordan Phosphoric Acid Market
The Jordanian government actively supports the phosphoric acid sector through a range of initiatives. These include policies aimed at promoting sustainable mining practices and ensuring environmental protection throughout the production cycle. Tax incentives and subsidies are also offered to attract investment and encourage the development of the industry. By establishing export quotas and pricing regulations, the government aims to maintain a stable market while fostering competitive practices among producers.
Future Insights of the Jordan Phosphoric Acid Market
Looking ahead to 2026-2032, the Jordan Phosphoric Acid Market is poised for consistent growth. The increasing demand from agriculture and food sectors is expected to drive production and innovation. Furthermore, with ongoing governmental support for industrial investment and advancements in production technologies, the market will likely attract new players and enhance its competitive landscape. The future appears promising, characterized by sustained growth and expanded applications across diverse industries.
Jordan Phosphoric Acid Market Latest Developments (May 2025 - June 2026)
Recent developments in the Jordan Phosphoric Acid Market indicate a strong focus on innovation and capacity expansion among key producers. There is a notable trend towards integrating advanced technologies in manufacturing processes to boost efficiency and reduce environmental impacts. Furthermore, collaborations with research institutions are becoming more common as stakeholders seek to develop sustainable solutions and expand their product portfolios to meet diverse consumer needs.
Jordan Phosphoric Acid Market - Key Attractiveness of the Report
- 10 Years of Market Numbers
- Historical Data Starting from 2022 to 2025
- Base Year: 2025
- Forecast Data until 2032
- Key Performance Indicators Impacting the Market
- Major Upcoming Developments and Projects
Key Highlights of the Report:
- Jordan Phosphoric Acid Market Outlook
- Market Size of Jordan Phosphoric Acid Market, 2025
- Forecast of Jordan Phosphoric Acid Market, 2032
- Historical Data and Forecast of Jordan Phosphoric Acid Revenues & Volume for the Period 2022-2032F
- Jordan Phosphoric Acid Market Trend Evolution
- Jordan Phosphoric Acid Market Drivers and Challenges
- Jordan Phosphoric Acid Price Trends
- Jordan Phosphoric Acid Porter's Five Forces
- Jordan Phosphoric Acid Industry Life Cycle
- Historical Data and Forecast of Jordan Phosphoric Acid Market Revenues & Volume By Process Type for the Period 2022-2032F
- Historical Data and Forecast of Jordan Phosphoric Acid Market Revenues & Volume By Wet Process for the Period 2022-2032F
- Historical Data and Forecast of Jordan Phosphoric Acid Market Revenues & Volume By Thermal Process for the Period 2022-2032F
- Historical Data and Forecast of Jordan Phosphoric Acid Market Revenues & Volume By Others for the Period 2022-2032F
- Historical Data and Forecast of Jordan Phosphoric Acid Market Revenues & Volume By Application for the Period 2022-2032F
- Historical Data and Forecast of Jordan Phosphoric Acid Market Revenues & Volume By Home Cleaning Agents for the Period 2022-2032F
- Historical Data and Forecast of Jordan Phosphoric Acid Market Revenues & Volume By Fertilizer Chemicals for the Period 2022-2032F
- Historical Data and Forecast of Jordan Phosphoric Acid Market Revenues & Volume By Fertilizer Type for the Period 2022-2032F
- Historical Data and Forecast of Jordan Phosphoric Acid Market Revenues & Volume By Mono-Ammonium Phosphate (MAP) for the Period 2022-2032F
- Historical Data and Forecast of Jordan Phosphoric Acid Market Revenues & Volume By Diammonium Phosphate (DAP) for the Period 2022-2032F
- Historical Data and Forecast of Jordan Phosphoric Acid Market Revenues & Volume By Triple Superphosphate (TSP) for the Period 2022-2032F
- Historical Data and Forecast of Jordan Phosphoric Acid Market Revenues & Volume By End-Users for the Period 2022-2032F
- Historical Data and Forecast of Jordan Phosphoric Acid Market Revenues & Volume By Electronics for the Period 2022-2032F
- Historical Data and Forecast of Jordan Phosphoric Acid Market Revenues & Volume By Beverage for the Period 2022-2032F
- Historical Data and Forecast of Jordan Phosphoric Acid Market Revenues & Volume By Medical for the Period 2022-2032F
- Historical Data and Forecast of Jordan Phosphoric Acid Market Revenues & Volume By Food for the Period 2022-2032F
- Historical Data and Forecast of Jordan Phosphoric Acid Market Revenues & Volume By Fertilizer for the Period 2022-2032F
- Historical Data and Forecast of Jordan Phosphoric Acid Market Revenues & Volume By Others for the Period 2022-2032F
- Historical Data and Forecast of Jordan Phosphoric Acid Market Revenues & Volume By Grade for the Period 2022-2032F
- Historical Data and Forecast of Jordan Phosphoric Acid Market Revenues & Volume By Food-Grade for the Period 2022-2032F
- Historical Data and Forecast of Jordan Phosphoric Acid Market Revenues & Volume By Technical Grade for the Period 2022-2032F
- Jordan Phosphoric Acid Import Export Trade Statistics
- Market Opportunity Assessment By Process Type
- Market Opportunity Assessment By Application
- Market Opportunity Assessment By Fertilizer Type
- Market Opportunity Assessment By End-Users
- Market Opportunity Assessment By Grade
- Jordan Phosphoric Acid Top Companies Market Share
- Jordan Phosphoric Acid Competitive Benchmarking By Technical and Operational Parameters
- Jordan Phosphoric Acid Company Profiles
- Jordan Phosphoric Acid Key Strategic Recommendations
Jordan Phosphoric Acid Market - Frequently Asked Questions
In Jordan, phosphoric acid is primarily used in fertilizer production, critical for enhancing agricultural yield. It's also utilized in food processing and as a raw material in the chemical industry, highlighting its versatility and significance.
The market was estimated at USD 498 Million in 2025 and is projected to reach USD 662 Million by 2032, with a CAGR of 4.2% from 2026 to 2032, reflecting robust growth driven by demand from various sectors.
The Jordanian government promotes sustainable practices within the phosphoric acid market through regulations, incentives, and policies that ensure environmental protections while encouraging investment and growth.
Innovations in production technologies are enhancing efficiency and reducing costs, as well as supporting the industry's shift towards sustainable practices, allowing for the development of more eco-friendly products.
The Jordan Phosphoric Acid Market grapples with fluctuating global demand and prices, geopolitical risks that may affect trade agreements, and the need for ongoing improvements in production infrastructure to sustain growth.
6Wresearch actively monitors the Jordan Phosphoric Acid Market and publishes its comprehensive annual report, highlighting emerging trends, growth drivers, revenue analysis, and forecast outlook. Our insights help businesses to make data-backed strategic decisions with ongoing market dynamics. Our analysts track relevent industries related to the Jordan Phosphoric Acid Market, allowing our clients with actionable intelligence and reliable forecasts tailored to emerging regional needs.
Yes, we provide customisation as per your requirements. To learn more, feel free to contact us on sales@6wresearch.com
Jordan Phosphoric Acid |
1 Executive Summary |
2 Introduction |
2.1 Key Highlights of the Report |
2.2 Report Description |
2.3 Market Scope & Segmentation |
2.4 Research Methodology |
2.5 Assumptions |
3 Jordan Phosphoric Acid Market Overview |
3.1 Jordan Country Macro Economic Indicators |
3.2 Jordan Phosphoric Acid Market Revenues & Volume, 2022 & 2032F |
3.3 Jordan Phosphoric Acid Market - Industry Life Cycle |
3.4 Jordan Phosphoric Acid Market - Porter's Five Forces |
3.5 Jordan Phosphoric Acid Market Revenues & Volume Share, By Process Type, 2022 & 2032F |
3.6 Jordan Phosphoric Acid Market Revenues & Volume Share, By Form, 2022 & 2032F |
3.7 Jordan Phosphoric Acid Market Revenues & Volume Share, By Fertilizer Type, 2022 & 2032F |
3.8 Jordan Phosphoric Acid Market Revenues & Volume Share, By End-Users, 2022 & 2032F |
3.9 Jordan Phosphoric Acid Market Revenues & Volume Share, By Grade, 2022 & 2032F |
4 Jordan Phosphoric Acid Market Dynamics |
4.1 Impact Analysis |
4.2 Market Drivers |
4.3 Market Restraints |
5 Jordan Phosphoric Acid Market Trends |
6 Jordan Phosphoric Acid Market, By Types |
6.1 Jordan Phosphoric Acid Market, By Process Type |
6.1.1 Overview and Analysis |
6.1.2 Jordan Phosphoric Acid Market Revenues & Volume, By Process Type, 2022-2032F |
6.1.3 Jordan Phosphoric Acid Market Revenues & Volume, By Wet Process, 2022-2032F |
6.1.4 Jordan Phosphoric Acid Market Revenues & Volume, By Thermal Process, 2022-2032F |
6.1.5 Jordan Phosphoric Acid Market Revenues & Volume, By Others, 2022-2032F |
6.2 Jordan Phosphoric Acid Market, By Application |
6.2.1 Overview and Analysis |
6.2.2 Jordan Phosphoric Acid Market Revenues & Volume, By Home Cleaning Agents, 2022-2032F |
6.2.3 Jordan Phosphoric Acid Market Revenues & Volume, By Fertilizer Chemicals, 2022-2032F |
6.3 Jordan Phosphoric Acid Market, By Fertilizer Type |
6.3.1 Overview and Analysis |
6.3.2 Jordan Phosphoric Acid Market Revenues & Volume, By Mono-Ammonium Phosphate (MAP), 2022-2032F |
6.3.3 Jordan Phosphoric Acid Market Revenues & Volume, By Diammonium Phosphate (DAP), 2022-2032F |
6.3.4 Jordan Phosphoric Acid Market Revenues & Volume, By Triple Superphosphate (TSP), 2022-2032F |
6.4 Jordan Phosphoric Acid Market, By End-Users |
6.4.1 Overview and Analysis |
6.4.2 Jordan Phosphoric Acid Market Revenues & Volume, By Electronics, 2022-2032F |
6.4.3 Jordan Phosphoric Acid Market Revenues & Volume, By Beverage, 2022-2032F |
6.4.4 Jordan Phosphoric Acid Market Revenues & Volume, By Medical, 2022-2032F |
6.4.5 Jordan Phosphoric Acid Market Revenues & Volume, By Food, 2022-2032F |
6.4.6 Jordan Phosphoric Acid Market Revenues & Volume, By Fertilizer, 2022-2032F |
6.4.7 Jordan Phosphoric Acid Market Revenues & Volume, By Others, 2022-2032F |
6.5 Jordan Phosphoric Acid Market, By Grade |
6.5.1 Overview and Analysis |
6.5.2 Jordan Phosphoric Acid Market Revenues & Volume, By Food-Grade, 2022-2032F |
6.5.3 Jordan Phosphoric Acid Market Revenues & Volume, By Technical Grade, 2022-2032F |
7 Jordan Phosphoric Acid Market Import-Export Trade Statistics |
7.1 Jordan Phosphoric Acid Market Export to Major Countries |
7.2 Jordan Phosphoric Acid Market Imports from Major Countries |
8 Jordan Phosphoric Acid Market Key Performance Indicators |
9 Jordan Phosphoric Acid Market - Opportunity Assessment |
9.1 Jordan Phosphoric Acid Market Opportunity Assessment, By Process Type, 2022 & 2032F |
9.2 Jordan Phosphoric Acid Market Opportunity Assessment, By Application, 2022 & 2032F |
9.3 Jordan Phosphoric Acid Market Opportunity Assessment, By Fertilizer Type, 2022 & 2032F |
9.4 Jordan Phosphoric Acid Market Opportunity Assessment, By End-Users, 2022 & 2032F |
9.5 Jordan Phosphoric Acid Market Opportunity Assessment, By Grade, 2022 & 2032F |
10 Jordan Phosphoric Acid Market - Competitive Landscape |
10.1 Jordan Phosphoric Acid Market Revenue Share, By Companies, 2025 |
10.2 Jordan Phosphoric Acid Market Competitive Benchmarking, By Operating and Technical Parameters |
11 Company Profiles |
12 Recommendations |
13 Disclaimer |
Global Go To Market Strategy - 2030
Export potential enables firms to identify high-growth global markets with greater confidence by combining advanced trade intelligence with a structured quantitative methodology. The framework analyzes emerging demand trends and country-level import patterns while integrating macroeconomic and trade datasets such as GDP and population forecasts, bilateral import–export flows, tariff structures, elasticity differentials between developed and developing economies, geographic distance, and import demand projections. Using weighted trade values from 2020–2024 as the base period to project country-to-country export potential for 2030, these inputs are operationalized through calculated drivers such as gravity model parameters, tariff impact factors, and projected GDP per-capita growth. Through an analysis of hidden potentials, demand hotspots, and market conditions that are most favorable to success, this method enables firms to focus on target countries, maximize returns, and global expansion with data, backed by accuracy.
By factoring in the projected importer demand gap that is currently unmet and could be potential opportunity, it identifies the potential for the Exporter (Country) among 190 countries, against the general trade analysis, which identifies the biggest importer or exporter.
To discover high-growth global markets and optimize your business strategy:
Click Here
Pricing
- Single User License$ 1,995
- Department License$ 2,400
- Site License$ 3,120
- Global License$ 3,795

Leadership Perspectives from Industry Events
Search
Thought Leadership and Analyst Meet


Our Clients
6WResearch In News
- India Air Conditioner Market Set for Strong Rebound in 2026 After Weather-Led Correction and GST-Driven Recovery: 6Wresearch
- ADAS in India: How Automatic Emergency Braking, Blind Spot Detection & Driver Monitoring are Transforming Road Safety
- Doha a strategic location for EV manufacturing hub: IPA Qatar
- Demand for luxury TVs surging in the GCC, says Samsung
- Empowering Growth: The Thriving Journey of Bangladesh’s Cable Industry
- Demand for luxury TVs surging in the GCC, says Samsung
Latest Reports
- Nicaragua RPG Gaming Market (2026-2032)
- New Zealand RPG Gaming Market (2026-2032)
- Netherlands RPG Gaming Market (2026-2032)
- Nauru RPG Gaming Market (2026-2032)
- Namibia RPG Gaming Market (2026-2032)
- Mozambique RPG Gaming Market (2026-2032)
- Montenegro RPG Gaming Market (2026-2032)
- Mongolia RPG Gaming Market (2026-2032)
- Monaco RPG Gaming Market (2026-2032)
- Micronesia RPG Gaming Market (2026-2032)
Industry Events and Analyst Meet

EV India Expo 2026

HIMTEX 2026

India Refining Summit 2026

India EV Show 2026

EV tech India Expo 2026
Whitepaper
- Middle East & Africa Commercial Security Market Click here to view more.
- Middle East & Africa Fire Safety Systems & Equipment Market Click here to view more.
- GCC Drone Market Click here to view more.
- Middle East Lighting Fixture Market Click here to view more.
- GCC Physical & Perimeter Security Market Click here to view more.