Georgia Phosphoric Acid Market (2026-2032) Outlook | Value, Analysis, Companies, Revenue, Trends, Share, Forecast, Industry, Size, Growth
Market Forecast By Process Type (Wet Process, Thermal Process, Others), By Application (Home Cleaning Agents, Fertilizer Chemicals), By Fertilizer Type (Mono-Ammonium Phosphate (MAP), Diammonium Phosphate (DAP), Triple Superphosphate (TSP)), By End-Users (Electronics, Beverage, Medical, Food, Fertilizer, Others), By Grade (Food-Grade, Technical Grade) And Competitive Landscape
| Product Code: ETC129519 | Publication Date: Jun 2021 | Updated Date: Jun 2026 | Product Type: Report | |
| Publisher: 6Wresearch | Author: Sumit Sagar | No. of Pages: 70 | No. of Figures: 35 | No. of Tables: 5 |
Georgia Phosphoric Acid Market Size, Share & Growth Rate
The Georgia Phosphoric Acid Market was estimated at USD 1121 Million in 2025 and is projected to reach USD 1627 Million by 2032, growing at a CAGR of 5.5% from 2026 to 2032. This growth trajectory is primarily fueled by the state's robust agricultural sector, which heavily relies on phosphoric acid for fertilizer production. Additionally, the increasing demand for high-purity phosphoric acid in diverse applications like food processing and pharmaceuticals is driving further market expansion.
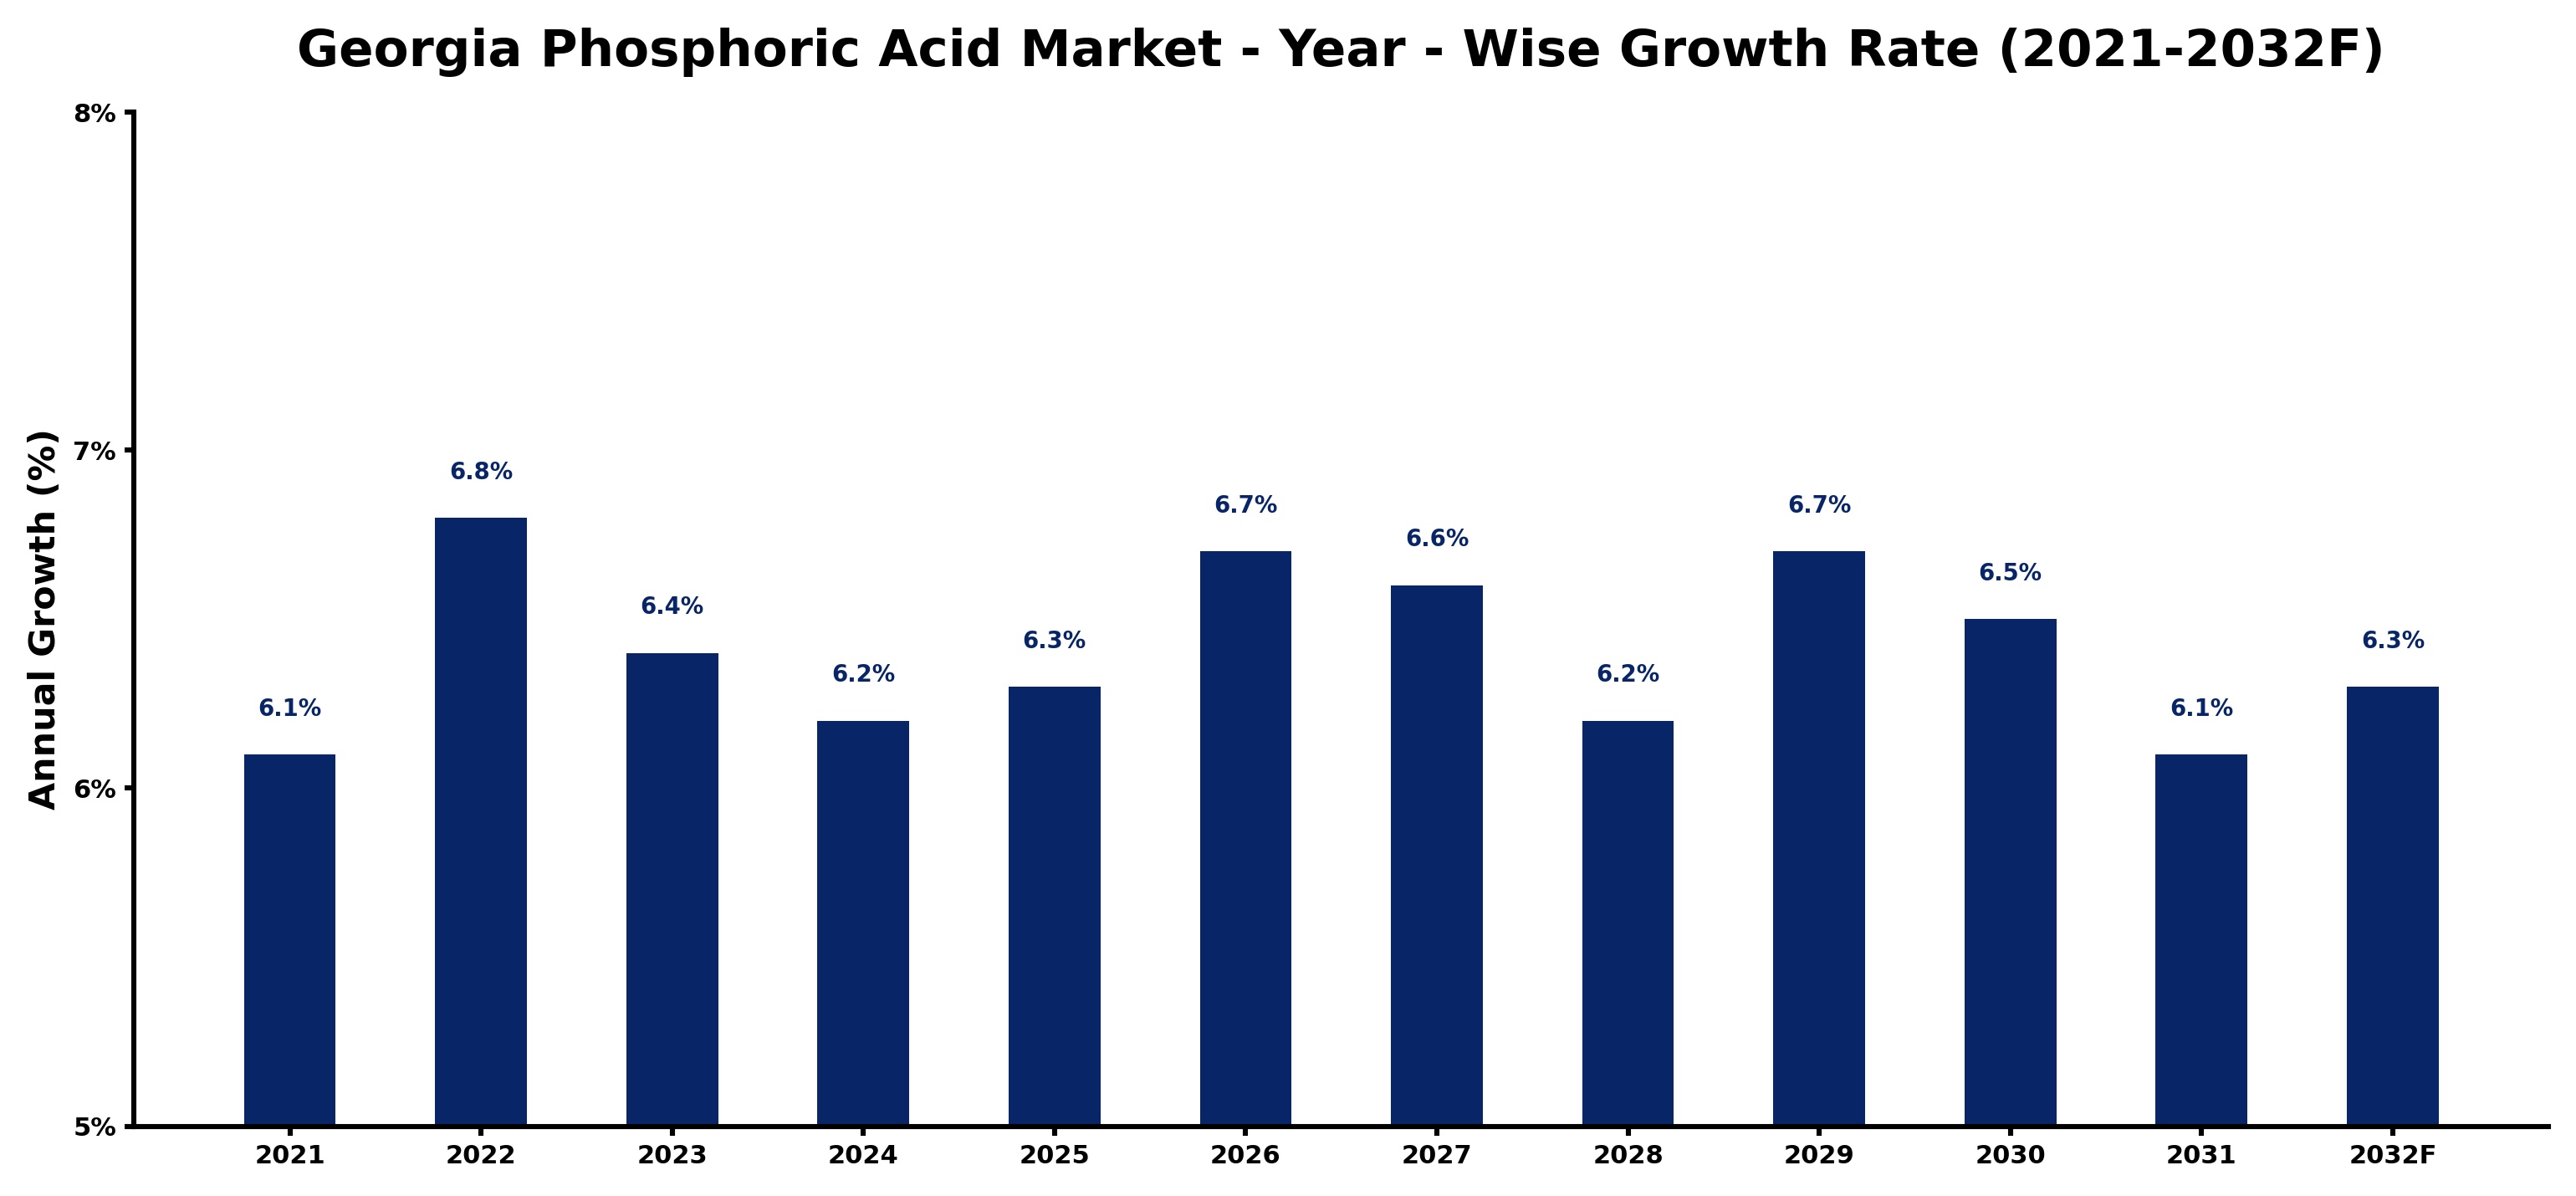
Georgia Phosphoric Acid Market Growth Rate Analysis (2021-2032)
The Georgia phosphoric acid market is poised for steady growth, maintaining an average yearly increase of approximately 6.3% from 2021 to 2032. Initial growth of 6.1% in 2021 was driven by strong agricultural demand as farmers sought phosphorus-rich fertilizers to enhance crop yields. This momentum continued into 2022 with a notable uptick of 6.8% as rising global food consumption spurred investor interest. Although growth rates fluctuated slightly in subsequent years—lowering to 6.2% in 2024 and eventually to 6.1% by 2031—factors such as advancements in extraction technology and supportive agricultural policies have kept the market stable. Anticipated demand in sectors like renewable energy and food production further underscores the potential for continued investment and expansion through 2032.
Georgia Phosphoric Acid Market Year-wise Growth Rate and Key Drivers
This graph highlights how the Georgia Phosphoric Acid Market has steadily grown over the past five years, supported by major growth factors.
The table below presents the year‑wise growth rates along with the key drivers influencing the market
| Year | Growth Rate | Major Drivers |
| 2021 | 6.1% | Government infrastructure modernization initiatives |
| 2022 | 6.8% | Increasing adoption of advanced technologies |
| 2023 | 6.4% | Expansion of commercial construction activities |
| 2024 | 6.2% | Rising electricity demand across industries |
| 2025 | 6.3% | Growing renewable energy integration projects |
| 2026 | 6.7% | Expansion of commercial construction activities |
| 2027 | 6.6% | Increasing adoption of advanced technologies |
| 2028 | 6.2% | Expansion of commercial construction activities |
| 2029 | 6.7% | Expansion of transportation and logistics networks |
| 2030 | 6.5% | Rapid growth in telecom and data center sectors |
| 2031 | 6.1% | Growing renewable energy integration projects |
| 2032 | 6.3% | Growing renewable energy integration projects |
Note - Market size estimations and growth projections presented in this report are based on 6Wresearch’s advanced forecasting approach, validated with industry datasets as of June 2026.
Georgia Phosphoric Acid Market Synopsis
In Georgia, the substantial production of phosphoric acid is intrinsically linked to its fertile lands, which require high-quality fertilizers to support extensive agricultural activities. The state’s rich phosphate rock reserves not only support local manufacturing but also enhance the state's position as a critical supplier in the phosphoric acid market.
As industries increasingly adopt sustainable practices, there is a burgeoning market for eco-friendly phosphoric acid products. This trend aligns with both local agricultural demands and the global push for sustainability, positioning Georgia as a pivotal player in meeting this evolving market need.
Georgia Phosphoric Acid Market Key Takeaways
- The Georgia Phosphoric Acid Market is witnessing steady growth, driven by strong agricultural demand.
- Environmental sustainability is becoming a significant focus for producers and consumers alike.
- Investment in high-purity phosphoric acid is rising due to its applications in pharmaceuticals and electronics.
- Geopolitical factors and raw material pricing are critical considerations impacting market stability.
- The state's favorable business environment fosters innovation and growth within the sector.
Evaluation of Restraints in Georgia Phosphoric Acid Market
The Georgia Phosphoric Acid Market faces notable challenges including fluctuating raw material prices and increasing environmental regulations. The cost volatility associated with phosphate rock—an essential raw material—can significantly affect production expenses, thereby creating uncertainty for manufacturers. Additionally, the stringent environmental compliance requirements in Georgia are intended to reduce ecological impact, yet they can lead to increased operational costs, adding complexity for producers striving to maintain profitability and competitiveness.
Georgia Phosphoric Acid Market Trends
Current trends indicate a shift towards sustainable production methods and eco-friendly phosphoric acid products. Manufacturers are increasingly adopting greener technologies to minimize environmental impact while improving efficiency. Additionally, research and development efforts are being directed at creating high-purity phosphoric acid tailored for specific industrial applications, such as electronics and food production, further diversifying market offerings.
Georgia Phosphoric Acid Market Opportunities
The landscape for investment within the Georgia Phosphoric Acid Market is promising. As agricultural practices evolve towards sustainability, there is a growing demand for innovative and eco-friendly phosphoric acid solutions. Potential investors can capitalize on this trend by establishing production facilities that focus on sustainable practices. Moreover, the state's strategic location enhances its logistical advantages, providing easy access to key markets and fostering greater supply chain efficiencies.
Government Initiatives in the Georgia Phosphoric Acid Market
The Georgia government plays a pivotal role in nurturing the phosphoric acid market through favorable policies and incentives. Support measures include tax breaks and subsidies aimed at attracting investment into the sector. Furthermore, regulatory frameworks have been established to ensure that production practices align with environmental sustainability goals, encouraging innovation and safeguarding natural resources while promoting industrial growth.
Future Insights of the Georgia Phosphoric Acid Market
Looking ahead to 2026-2032, the Georgia Phosphoric Acid Market is expected to maintain its growth momentum, propelled by persistent demand across agriculture and food production sectors. The increasing emphasis on high-quality agricultural products and sustainable practices suggests a robust future for phosphoric acid applications. However, ongoing attention to regulatory shifts and raw material pricing will be crucial as stakeholders navigate this evolving landscape.
Georgia Phosphoric Acid Market Latest Developments (May 2025 - June 2026)
In the recent period, the Georgia Phosphoric Acid Market has seen a growing emphasis on the development of sustainable production practices. Companies are exploring partnerships aimed at enhancing supply chain efficiencies and investing in technology that minimizes environmental impact. Additionally, there is a noticeable increase in R&D initiatives focused on high-purity phosphoric acid applications, signaling a commitment to innovation within the industry.
Georgia Phosphoric Acid Market - Key Attractiveness of the Report
- 10 Years of Market Numbers
- Historical Data Starting from 2022 to 2025
- Base Year: 2025
- Forecast Data until 2032
- Key Performance Indicators Impacting the Market
- Major Upcoming Developments and Projects
Key Highlights of the Report:
- Georgia Phosphoric Acid Market Outlook
- Market Size of Georgia Phosphoric Acid Market, 2025
- Forecast of Georgia Phosphoric Acid Market, 2032
- Historical Data and Forecast of Georgia Phosphoric Acid Revenues & Volume for the Period 2022-2032F
- Georgia Phosphoric Acid Market Trend Evolution
- Georgia Phosphoric Acid Market Drivers and Challenges
- Georgia Phosphoric Acid Price Trends
- Georgia Phosphoric Acid Porter's Five Forces
- Georgia Phosphoric Acid Industry Life Cycle
- Historical Data and Forecast of Georgia Phosphoric Acid Market Revenues & Volume By Process Type for the Period 2022-2032F
- Historical Data and Forecast of Georgia Phosphoric Acid Market Revenues & Volume By Wet Process for the Period 2022-2032F
- Historical Data and Forecast of Georgia Phosphoric Acid Market Revenues & Volume By Thermal Process for the Period 2022-2032F
- Historical Data and Forecast of Georgia Phosphoric Acid Market Revenues & Volume By Others for the Period 2022-2032F
- Historical Data and Forecast of Georgia Phosphoric Acid Market Revenues & Volume By Application for the Period 2022-2032F
- Historical Data and Forecast of Georgia Phosphoric Acid Market Revenues & Volume By Home Cleaning Agents for the Period 2022-2032F
- Historical Data and Forecast of Georgia Phosphoric Acid Market Revenues & Volume By Fertilizer Chemicals for the Period 2022-2032F
- Historical Data and Forecast of Georgia Phosphoric Acid Market Revenues & Volume By Fertilizer Type for the Period 2022-2032F
- Historical Data and Forecast of Georgia Phosphoric Acid Market Revenues & Volume By Mono-Ammonium Phosphate (MAP) for the Period 2022-2032F
- Historical Data and Forecast of Georgia Phosphoric Acid Market Revenues & Volume By Diammonium Phosphate (DAP) for the Period 2022-2032F
- Historical Data and Forecast of Georgia Phosphoric Acid Market Revenues & Volume By Triple Superphosphate (TSP) for the Period 2022-2032F
- Historical Data and Forecast of Georgia Phosphoric Acid Market Revenues & Volume By End-Users for the Period 2022-2032F
- Historical Data and Forecast of Georgia Phosphoric Acid Market Revenues & Volume By Electronics for the Period 2022-2032F
- Historical Data and Forecast of Georgia Phosphoric Acid Market Revenues & Volume By Beverage for the Period 2022-2032F
- Historical Data and Forecast of Georgia Phosphoric Acid Market Revenues & Volume By Medical for the Period 2022-2032F
- Historical Data and Forecast of Georgia Phosphoric Acid Market Revenues & Volume By Food for the Period 2022-2032F
- Historical Data and Forecast of Georgia Phosphoric Acid Market Revenues & Volume By Fertilizer for the Period 2022-2032F
- Historical Data and Forecast of Georgia Phosphoric Acid Market Revenues & Volume By Others for the Period 2022-2032F
- Historical Data and Forecast of Georgia Phosphoric Acid Market Revenues & Volume By Grade for the Period 2022-2032F
- Historical Data and Forecast of Georgia Phosphoric Acid Market Revenues & Volume By Food-Grade for the Period 2022-2032F
- Historical Data and Forecast of Georgia Phosphoric Acid Market Revenues & Volume By Technical Grade for the Period 2022-2032F
- Georgia Phosphoric Acid Import Export Trade Statistics
- Market Opportunity Assessment By Process Type
- Market Opportunity Assessment By Application
- Market Opportunity Assessment By Fertilizer Type
- Market Opportunity Assessment By End-Users
- Market Opportunity Assessment By Grade
- Georgia Phosphoric Acid Top Companies Market Share
- Georgia Phosphoric Acid Competitive Benchmarking By Technical and Operational Parameters
- Georgia Phosphoric Acid Company Profiles
- Georgia Phosphoric Acid Key Strategic Recommendations
Georgia Phosphoric Acid Market - Frequently Asked Questions
The market is estimated to be valued at USD 1121 Million in 2025 and is projected to reach USD 1627 Million by 2032, growing at a CAGR of 5.5% between 2026 and 2032.
Agriculture is the primary driver of phosphoric acid demand in Georgia, given its critical role in fertilizer production, which supports the state’s extensive farming operations.
Stricter environmental regulations regarding emissions and waste management can increase operational costs for manufacturers, prompting a shift towards more sustainable production methods.
Yes, there is a growing focus on high-purity phosphoric acid, which is increasingly sought after for specialized applications in industries such as pharmaceuticals and electronics.
Investors have opportunities in developing sustainable production facilities and high-purity product lines to meet the increasing demand for eco-friendly solutions within the agricultural sector.
6Wresearch actively monitors the Georgia Phosphoric Acid Market and publishes its comprehensive annual report, highlighting emerging trends, growth drivers, revenue analysis, and forecast outlook. Our insights help businesses to make data-backed strategic decisions with ongoing market dynamics. Our analysts track relevent industries related to the Georgia Phosphoric Acid Market, allowing our clients with actionable intelligence and reliable forecasts tailored to emerging regional needs.
Yes, we provide customisation as per your requirements. To learn more, feel free to contact us on sales@6wresearch.com
Georgia Phosphoric Acid |
1 Executive Summary |
2 Introduction |
2.1 Key Highlights of the Report |
2.2 Report Description |
2.3 Market Scope & Segmentation |
2.4 Research Methodology |
2.5 Assumptions |
3 Georgia Phosphoric Acid Market Overview |
3.1 Georgia Country Macro Economic Indicators |
3.2 Georgia Phosphoric Acid Market Revenues & Volume, 2022 & 2032F |
3.3 Georgia Phosphoric Acid Market - Industry Life Cycle |
3.4 Georgia Phosphoric Acid Market - Porter's Five Forces |
3.5 Georgia Phosphoric Acid Market Revenues & Volume Share, By Process Type, 2022 & 2032F |
3.6 Georgia Phosphoric Acid Market Revenues & Volume Share, By Form, 2022 & 2032F |
3.7 Georgia Phosphoric Acid Market Revenues & Volume Share, By Fertilizer Type, 2022 & 2032F |
3.8 Georgia Phosphoric Acid Market Revenues & Volume Share, By End-Users, 2022 & 2032F |
3.9 Georgia Phosphoric Acid Market Revenues & Volume Share, By Grade, 2022 & 2032F |
4 Georgia Phosphoric Acid Market Dynamics |
4.1 Impact Analysis |
4.2 Market Drivers |
4.3 Market Restraints |
5 Georgia Phosphoric Acid Market Trends |
6 Georgia Phosphoric Acid Market, By Types |
6.1 Georgia Phosphoric Acid Market, By Process Type |
6.1.1 Overview and Analysis |
6.1.2 Georgia Phosphoric Acid Market Revenues & Volume, By Process Type, 2022-2032F |
6.1.3 Georgia Phosphoric Acid Market Revenues & Volume, By Wet Process, 2022-2032F |
6.1.4 Georgia Phosphoric Acid Market Revenues & Volume, By Thermal Process, 2022-2032F |
6.1.5 Georgia Phosphoric Acid Market Revenues & Volume, By Others, 2022-2032F |
6.2 Georgia Phosphoric Acid Market, By Application |
6.2.1 Overview and Analysis |
6.2.2 Georgia Phosphoric Acid Market Revenues & Volume, By Home Cleaning Agents, 2022-2032F |
6.2.3 Georgia Phosphoric Acid Market Revenues & Volume, By Fertilizer Chemicals, 2022-2032F |
6.3 Georgia Phosphoric Acid Market, By Fertilizer Type |
6.3.1 Overview and Analysis |
6.3.2 Georgia Phosphoric Acid Market Revenues & Volume, By Mono-Ammonium Phosphate (MAP), 2022-2032F |
6.3.3 Georgia Phosphoric Acid Market Revenues & Volume, By Diammonium Phosphate (DAP), 2022-2032F |
6.3.4 Georgia Phosphoric Acid Market Revenues & Volume, By Triple Superphosphate (TSP), 2022-2032F |
6.4 Georgia Phosphoric Acid Market, By End-Users |
6.4.1 Overview and Analysis |
6.4.2 Georgia Phosphoric Acid Market Revenues & Volume, By Electronics, 2022-2032F |
6.4.3 Georgia Phosphoric Acid Market Revenues & Volume, By Beverage, 2022-2032F |
6.4.4 Georgia Phosphoric Acid Market Revenues & Volume, By Medical, 2022-2032F |
6.4.5 Georgia Phosphoric Acid Market Revenues & Volume, By Food, 2022-2032F |
6.4.6 Georgia Phosphoric Acid Market Revenues & Volume, By Fertilizer, 2022-2032F |
6.4.7 Georgia Phosphoric Acid Market Revenues & Volume, By Others, 2022-2032F |
6.5 Georgia Phosphoric Acid Market, By Grade |
6.5.1 Overview and Analysis |
6.5.2 Georgia Phosphoric Acid Market Revenues & Volume, By Food-Grade, 2022-2032F |
6.5.3 Georgia Phosphoric Acid Market Revenues & Volume, By Technical Grade, 2022-2032F |
7 Georgia Phosphoric Acid Market Import-Export Trade Statistics |
7.1 Georgia Phosphoric Acid Market Export to Major Countries |
7.2 Georgia Phosphoric Acid Market Imports from Major Countries |
8 Georgia Phosphoric Acid Market Key Performance Indicators |
9 Georgia Phosphoric Acid Market - Opportunity Assessment |
9.1 Georgia Phosphoric Acid Market Opportunity Assessment, By Process Type, 2022 & 2032F |
9.2 Georgia Phosphoric Acid Market Opportunity Assessment, By Application, 2022 & 2032F |
9.3 Georgia Phosphoric Acid Market Opportunity Assessment, By Fertilizer Type, 2022 & 2032F |
9.4 Georgia Phosphoric Acid Market Opportunity Assessment, By End-Users, 2022 & 2032F |
9.5 Georgia Phosphoric Acid Market Opportunity Assessment, By Grade, 2022 & 2032F |
10 Georgia Phosphoric Acid Market - Competitive Landscape |
10.1 Georgia Phosphoric Acid Market Revenue Share, By Companies, 2025 |
10.2 Georgia Phosphoric Acid Market Competitive Benchmarking, By Operating and Technical Parameters |
11 Company Profiles |
12 Recommendations |
13 Disclaimer |
Global Go To Market Strategy - 2030
Export potential enables firms to identify high-growth global markets with greater confidence by combining advanced trade intelligence with a structured quantitative methodology. The framework analyzes emerging demand trends and country-level import patterns while integrating macroeconomic and trade datasets such as GDP and population forecasts, bilateral import–export flows, tariff structures, elasticity differentials between developed and developing economies, geographic distance, and import demand projections. Using weighted trade values from 2020–2024 as the base period to project country-to-country export potential for 2030, these inputs are operationalized through calculated drivers such as gravity model parameters, tariff impact factors, and projected GDP per-capita growth. Through an analysis of hidden potentials, demand hotspots, and market conditions that are most favorable to success, this method enables firms to focus on target countries, maximize returns, and global expansion with data, backed by accuracy.
By factoring in the projected importer demand gap that is currently unmet and could be potential opportunity, it identifies the potential for the Exporter (Country) among 190 countries, against the general trade analysis, which identifies the biggest importer or exporter.
To discover high-growth global markets and optimize your business strategy:
Click Here
Pricing
- Single User License$ 1,995
- Department License$ 2,400
- Site License$ 3,120
- Global License$ 3,795

Leadership Perspectives from Industry Events
Search
Thought Leadership and Analyst Meet


Our Clients
6WResearch In News
- India Air Conditioner Market Set for Strong Rebound in 2026 After Weather-Led Correction and GST-Driven Recovery: 6Wresearch
- ADAS in India: How Automatic Emergency Braking, Blind Spot Detection & Driver Monitoring are Transforming Road Safety
- Doha a strategic location for EV manufacturing hub: IPA Qatar
- Demand for luxury TVs surging in the GCC, says Samsung
- Empowering Growth: The Thriving Journey of Bangladesh’s Cable Industry
- Demand for luxury TVs surging in the GCC, says Samsung
Latest Reports
- Poland Fire Protection Systems Market (2026-2032)
- Cape Verde Portable Hand-Thrown Extinguisher Market (2026-2032)
- Canada Portable Hand-Thrown Extinguisher Market (2026-2032)
- Cameroon Portable Hand-Thrown Extinguisher Market (2026-2032)
- Burundi Portable Hand-Thrown Extinguisher Market (2026-2032)
- Burkina Faso Portable Hand-Thrown Extinguisher Market (2026-2032)
- Bulgaria Portable Hand-Thrown Extinguisher Market (2026-2032)
- Brunei Portable Hand-Thrown Extinguisher Market (2026-2032)
- Botswana Portable Hand-Thrown Extinguisher Market (2026-2032)
- Bosnia and Herzegovina Portable Hand-Thrown Extinguisher Market (2026-2032)
Industry Events and Analyst Meet

HIMTEX 2026

India Refining Summit 2026

India EV Show 2026

EV tech India Expo 2026

Auto Tech Asia 2026
Whitepaper
- Middle East & Africa Commercial Security Market Click here to view more.
- Middle East & Africa Fire Safety Systems & Equipment Market Click here to view more.
- GCC Drone Market Click here to view more.
- Middle East Lighting Fixture Market Click here to view more.
- GCC Physical & Perimeter Security Market Click here to view more.