Jordan Silica Sand For Glass Making Market (2026-2032) Outlook | Companies, Revenue, Trends, Analysis, Forecast, Share, Size, Growth, Industry & Value
Market Forecast By Application (Flat Glass, Fiber Glass, Glass Containers, Special & Technical, Tableware Glass, Others), By Purity (High Purity, Ultra High Purity) And Competitive Landscape
| Product Code: ETC346606 | Publication Date: Aug 2022 | Updated Date: Jul 2026 | Product Type: Market Research Report | |
| Publisher: 6Wresearch | Author: Sumit Sagar | No. of Pages: 75 | No. of Figures: 35 | No. of Tables: 20 |
Jordan Silica Sand For Glass Making Market Size, Share & Growth Rate
The Jordan Silica Sand For Glass Making Market was estimated at USD 486 Million in 2025 and is projected to reach USD 651 Million by 2032, growing at a CAGR of 4.3% from 2026 to 2032. This upward trajectory is largely attributed to the rising demand for high-quality glass products across various sectors, including construction, automotive, and electronics. As glass manufacturers increasingly seek sustainable and premium raw materials, Jordan's superior silica sand has become a pivotal resource in fulfilling these industry needs.
Jordan Silica Sand For Glass Making Market Year-wise Growth Rate and Key Drivers
This graph highlights how the Jordan Silica Sand For Glass Making Market has steadily grown over the years, supported by major growth factors.
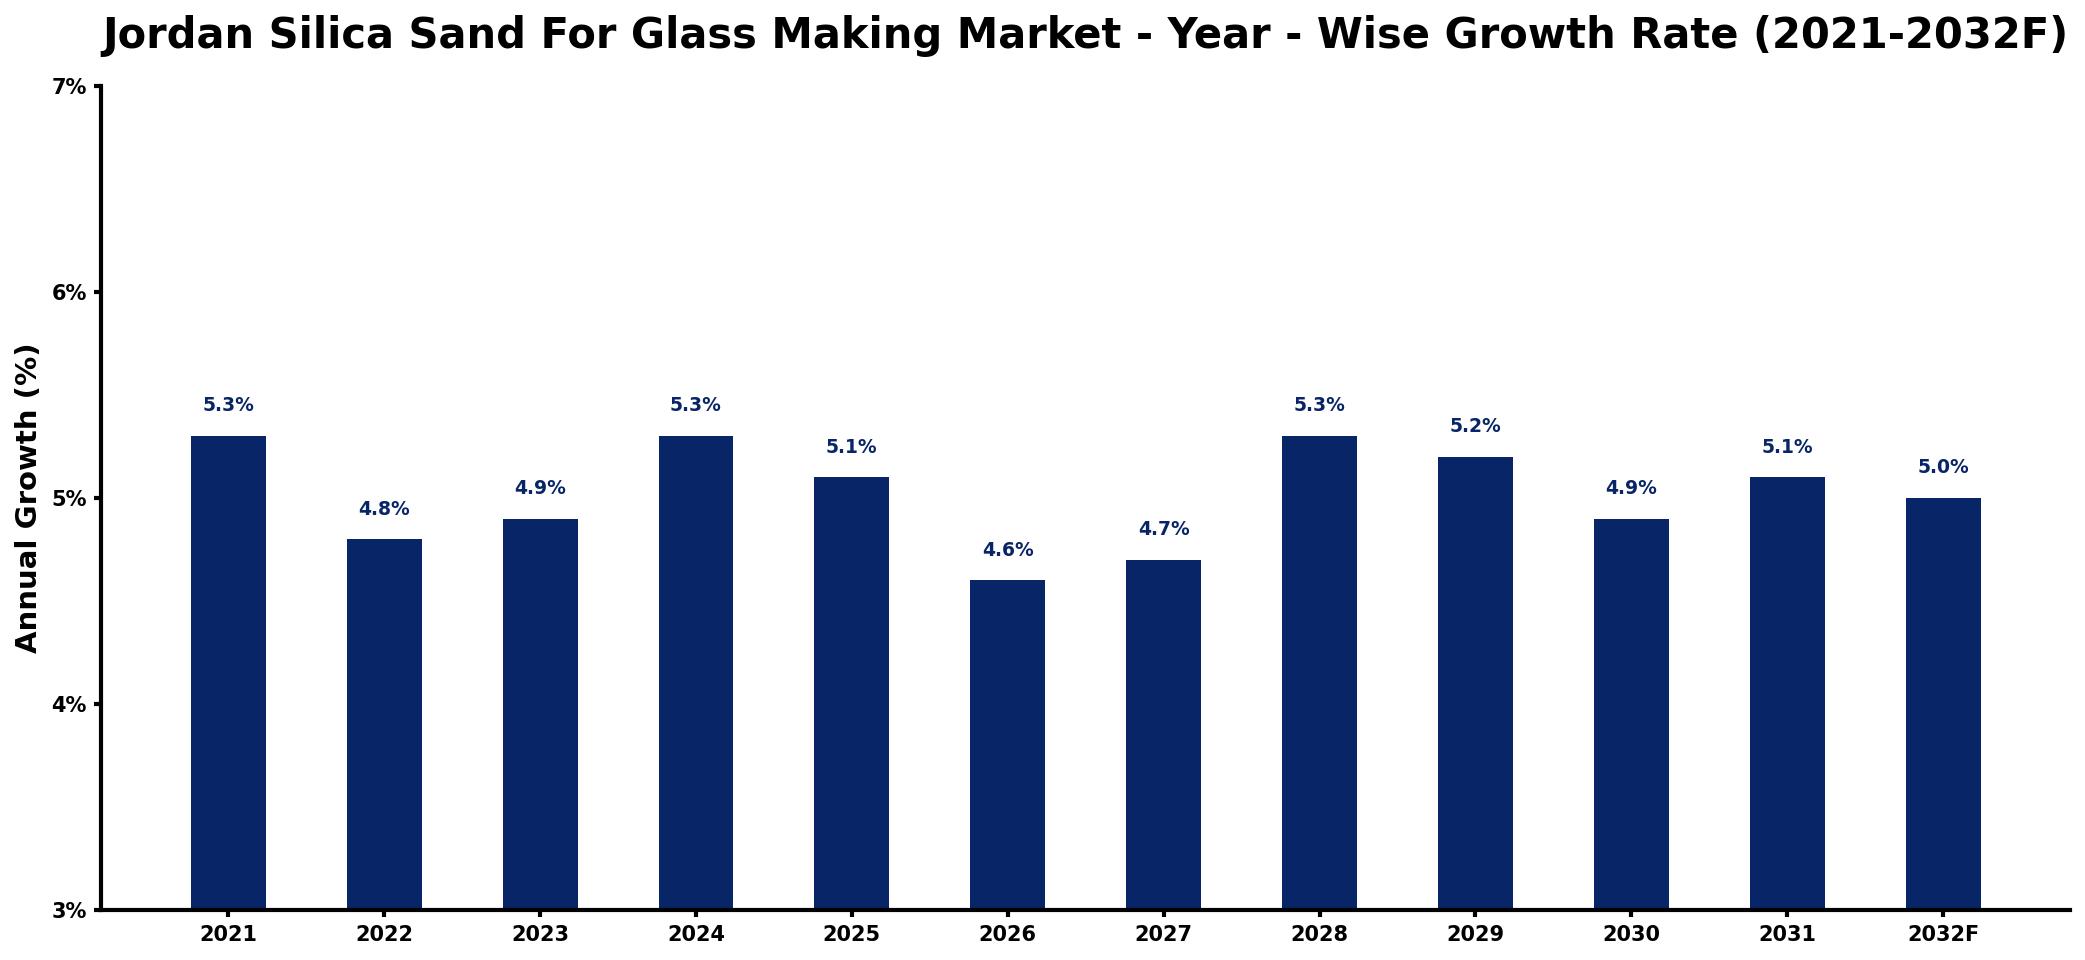
The table below presents the year‑wise growth rates along with the key drivers influencing the market
| Year | Growth Rate | Major Drivers |
| 2021 | 5.3% | Rising construction sector activity |
| 2022 | 4.8% | Increased demand from manufacturing |
| 2023 | 4.9% | Growing investments in infrastructure |
| 2024 | 5.3% | Expansion of renewable energy projects |
| 2025 | 5.1% | Surge in automotive industry production |
| 2026 | 4.6% | Strengthening export markets globally |
| 2027 | 4.7% | Technological advancements in production |
| 2028 | 5.3% | Higher consumption in urban development |
| 2029 | 5.2% | Boost from electronics manufacturing growth |
| 2030 | 4.9% | Increased focus on sustainability initiatives |
| 2031 | 5.1% | Rising consumer electronics demand |
| 2032 | 5.0% | Growth in packaging industry requirements |
Note: Market size estimations and growth projections presented in this report are based on 6Wresearch's proprietary forecasting methodology, utilizing the latest available industry data, government publications, and primary research inputs.
Jordan Silica Sand For Glass Making Market Synopsis
Jordan is blessed with significant reserves of high-purity silica sand, which is essential for producing high-quality glass products. The market is underscored by a robust network of local suppliers who efficiently cater to both domestic and international glass makers, thereby enhancing the region's influence in the global glass manufacturing sector.
In recent years, the glass industry has seen a surge in demand for eco-friendly materials. As such, Jordans silica sand market is experiencing increased investments focusing on sustainable extraction and processing methods, enabling suppliers to align with global sustainability trends while improving product quality.
Jordan Silica Sand For Glass Making Market Key Takeaways
- The market is driven by a robust demand for high-quality glass products in multiple sectors.
- Local suppliers dominate the landscape, serving both domestic needs and international markets.
- Growing emphasis on sustainability is shaping extraction and processing practices in the market.
- Investments in technology are enhancing the competitiveness of Jordans silica sand.
- Government initiatives support sustainable practices while promoting domestic production.
Evaluation of Restraints in Jordan Silica Sand For Glass Making Market
Despite the market's promising prospects, several restraints hamper growth. Fluctuating global demand for glass products creates uncertainty for suppliers. Additionally, competition from other silica sand-producing countries can pressure local prices and market share. Transportation costs, particularly due to Jordan's landlocked positioning, also challenge logistics and supply chain efficiency. Environmental concerns surrounding silica sand mining practices have led to increased scrutiny, necessitating compliance with stricter regulations that might impact operational capabilities.
Jordan Silica Sand For Glass Making Market Trends
The landscape of the Jordan silica sand for glass making market is evolving, characterized by a distinct shift towards higher purity levels and uniform grain size distribution. Manufacturers are increasingly prioritizing these specifications to enhance the quality of finished glass products. Concurrently, sustainability is becoming a critical focus, with companies adopting eco-friendly sourcing methods and production techniques. Research and development investments are also on the rise, aimed at innovating the silica sand properties for specialized applications, further driving technological advancements in the sector.
Jordan Silica Sand For Glass Making Market Opportunities
Investors are presented with a multitude of opportunities in the Jordan silica sand for glass making market. The region's vast reserves of high-quality silica sand, coupled with the escalating global demand for glass products, create a favorable investment climate for mining and processing operations. There are also substantial opportunities for establishing processing facilities that incorporate advanced technologies to optimize extraction and production efficiency. As sustainability takes precedence, investments geared towards eco-friendly practices and innovative techniques stand to enhance market competitiveness significantly.
Government Initiatives in the Jordan Silica Sand For Glass Making Market
The Jordanian government has implemented policies to promote sustainable mining practices and environmental stewardship within the silica sand sector. Licensing requirements are enforced to ensure responsible extraction methods, contributing to worker safety and environmental protection. Additionally, there are incentives aimed at bolstering domestic production of silica sand for glass making, thereby reducing reliance on imports. The government also encourages research and development efforts that focus on improving the quality of silica sand to meet international standards.
Future Insights of the Jordan Silica Sand For Glass Making Market
Looking ahead to the years 2026-2032, the Jordan silica sand for glass making market is poised for continued growth. As the construction sector expands and the demand for glass products escalates, this market is likely to thrive. Furthermore, advancements in glass technologies and increasing investments in infrastructure development will support this momentum. However, market players must navigate challenges posed by environmental regulations and competition from alternative materials. Overall, a focus on product innovation and sustainability will be crucial in shaping the future of the market.
Jordan Silica Sand For Glass Making Market Latest Developments (2025 - 2026)
In recent months, the Jordan silica sand market has seen a heightened emphasis on sustainability initiatives. Companies are increasingly adopting cleaner production processes, and there is a noticeable surge in collaboration among industry stakeholders to develop innovative solutions to enhance product quality. Moreover, the government is actively promoting new projects aimed at improving infrastructure to facilitate better access to mining sites and processing facilities, which is expected to significantly enhance operational efficiencies in the coming years.
Jordan Silica Sand For Glass Making Market - Key Attractiveness of the Report
- 10 Years of Market Numbers
- Historical Data Starting from 2022 to 2025
- Base Year: 2025
- Forecast Data until 2032
- Key Performance Indicators Impacting the Market
- Major Upcoming Developments and Projects
Key Highlights of the Report:
- Jordan Silica Sand For Glass Making Market Outlook
- Market Size of Jordan Silica Sand For Glass Making Market, 2025
- Forecast of Jordan Silica Sand For Glass Making Market, 2032
- Historical Data and Forecast of Jordan Silica Sand For Glass Making Revenues & Volume for the Period 2022-2032F
- Jordan Silica Sand For Glass Making Market Trend Evolution
- Jordan Silica Sand For Glass Making Market Drivers and Challenges
- Jordan Silica Sand For Glass Making Price Trends
- Jordan Silica Sand For Glass Making Porter's Five Forces
- Jordan Silica Sand For Glass Making Industry Life Cycle
- Historical Data and Forecast of Jordan Silica Sand For Glass Making Market Revenues & Volume By Application for the Period 2022-2032F
- Historical Data and Forecast of Jordan Silica Sand For Glass Making Market Revenues & Volume By Flat Glass for the Period 2022-2032F
- Historical Data and Forecast of Jordan Silica Sand For Glass Making Market Revenues & Volume By Fiber Glass for the Period 2022-2032F
- Historical Data and Forecast of Jordan Silica Sand For Glass Making Market Revenues & Volume By Glass Containers for the Period 2022-2032F
- Historical Data and Forecast of Jordan Silica Sand For Glass Making Market Revenues & Volume By Special & Technical for the Period 2022-2032F
- Historical Data and Forecast of Jordan Silica Sand For Glass Making Market Revenues & Volume By Tableware Glass for the Period 2022-2032F
- Historical Data and Forecast of Jordan Silica Sand For Glass Making Market Revenues & Volume By Others for the Period 2022-2032F
- Historical Data and Forecast of Jordan Silica Sand For Glass Making Market Revenues & Volume By Purity for the Period 2022-2032F
- Historical Data and Forecast of Jordan Silica Sand For Glass Making Market Revenues & Volume By High Purity for the Period 2022-2032F
- Historical Data and Forecast of Jordan Silica Sand For Glass Making Market Revenues & Volume By Ultra High Purity for the Period 2022-2032F
- Jordan Silica Sand For Glass Making Import Export Trade Statistics
- Market Opportunity Assessment By Application
- Market Opportunity Assessment By Purity
- Jordan Silica Sand For Glass Making Top Companies Market Share
- Jordan Silica Sand For Glass Making Competitive Benchmarking By Technical and Operational Parameters
- Jordan Silica Sand For Glass Making Company Profiles
- Jordan Silica Sand For Glass Making Key Strategic Recommendations
Frequently Asked Questions About the Market Study (FAQs):
The growth is primarily fueled by rising demand for high-quality glass across sectors like construction and electronics, alongside a push for sustainable sourcing practices in the industry.
The market was estimated at USD 486 Million in 2025 and is projected to reach USD 651 Million by 2032, growing at a CAGR of 4.3% from 2026 to 2032.
The Jordanian government enforces policies for sustainable mining practices and provides incentives for domestic production, enhancing the competitiveness of local suppliers in the silica sand sector.
Key challenges include fluctuating global demand, competition from international suppliers, and environmental concerns regarding mining practices, all of which necessitate strategic management for producers.
Sustainability is increasingly influencing extraction and processing practices, with companies focusing on reducing their carbon footprint and enhancing eco-friendly production methods to meet industry expectations.
Manufacturers are investing in research and development to improve silica sand properties for specific applications, aiming for higher purity levels and consistency in grain size, thus driving innovation in the market.
6Wresearch actively monitors the Jordan Silica Sand For Glass Making Market and publishes its comprehensive annual report, highlighting emerging trends, growth drivers, revenue analysis, and forecast outlook. Our insights help businesses to make data-backed strategic decisions with ongoing market dynamics. Our analysts track relevent industries related to the Jordan Silica Sand For Glass Making Market, allowing our clients with actionable intelligence and reliable forecasts tailored to emerging regional needs.
Yes, we provide customisation as per your requirements. To learn more, feel free to contact us on sales@6wresearch.com
1 Executive Summary |
2 Introduction |
2.1 Key Highlights of the Report |
2.2 Report Description |
2.3 Market Scope & Segmentation |
2.4 Research Methodology |
2.5 Assumptions |
3 Jordan Silica Sand For Glass Making Market Overview |
3.1 Jordan Country Macro Economic Indicators |
3.2 Jordan Silica Sand For Glass Making Market Revenues & Volume, 2022 & 2032F |
3.3 Jordan Silica Sand For Glass Making Market - Industry Life Cycle |
3.4 Jordan Silica Sand For Glass Making Market - Porter's Five Forces |
3.5 Jordan Silica Sand For Glass Making Market Revenues & Volume Share, By Application, 2022 & 2032F |
3.6 Jordan Silica Sand For Glass Making Market Revenues & Volume Share, By Purity, 2022 & 2032F |
4 Jordan Silica Sand For Glass Making Market Dynamics |
4.1 Impact Analysis |
4.2 Market Drivers |
4.2.1 Growing demand for glass products in various industries such as construction, automotive, and electronics. |
4.2.2 Technological advancements in glass manufacturing processes leading to increased use of high-quality silica sand. |
4.2.3 Favorable government regulations and policies supporting the glass industry in Jordan. |
4.3 Market Restraints |
4.3.1 Fluctuating prices of raw materials impacting the production cost of silica sand for glass making. |
4.3.2 Environmental concerns related to silica sand mining and processing leading to regulatory challenges. |
5 Jordan Silica Sand For Glass Making Market Trends |
6 Jordan Silica Sand For Glass Making Market, By Types |
6.1 Jordan Silica Sand For Glass Making Market, By Application |
6.1.1 Overview and Analysis |
6.1.2 Jordan Silica Sand For Glass Making Market Revenues & Volume, By Application, 2022-2032F |
6.1.3 Jordan Silica Sand For Glass Making Market Revenues & Volume, By Flat Glass, 2022-2032F |
6.1.4 Jordan Silica Sand For Glass Making Market Revenues & Volume, By Fiber Glass, 2022-2032F |
6.1.5 Jordan Silica Sand For Glass Making Market Revenues & Volume, By Glass Containers, 2022-2032F |
6.1.6 Jordan Silica Sand For Glass Making Market Revenues & Volume, By Special & Technical, 2022-2032F |
6.1.7 Jordan Silica Sand For Glass Making Market Revenues & Volume, By Tableware Glass, 2022-2032F |
6.1.8 Jordan Silica Sand For Glass Making Market Revenues & Volume, By Others, 2022-2032F |
6.2 Jordan Silica Sand For Glass Making Market, By Purity |
6.2.1 Overview and Analysis |
6.2.2 Jordan Silica Sand For Glass Making Market Revenues & Volume, By High Purity, 2022-2032F |
6.2.3 Jordan Silica Sand For Glass Making Market Revenues & Volume, By Ultra High Purity, 2022-2032F |
7 Jordan Silica Sand For Glass Making Market Import-Export Trade Statistics |
7.1 Jordan Silica Sand For Glass Making Market Export to Major Countries |
7.2 Jordan Silica Sand For Glass Making Market Imports from Major Countries |
8 Jordan Silica Sand For Glass Making Market Key Performance Indicators |
8.1 Energy efficiency of silica sand extraction and processing. |
8.2 Percentage of silica sand meeting industry quality standards. |
8.3 Innovation and research investment in developing new glass products utilizing Jordan silica sand. |
9 Jordan Silica Sand For Glass Making Market - Opportunity Assessment |
9.1 Jordan Silica Sand For Glass Making Market Opportunity Assessment, By Application, 2022 & 2032F |
9.2 Jordan Silica Sand For Glass Making Market Opportunity Assessment, By Purity, 2022 & 2032F |
10 Jordan Silica Sand For Glass Making Market - Competitive Landscape |
10.1 Jordan Silica Sand For Glass Making Market Revenue Share, By Companies, 2025 |
10.2 Jordan Silica Sand For Glass Making Market Competitive Benchmarking, By Operating and Technical Parameters |
11 Company Profiles |
12 Recommendations |
13 Disclaimer |
Global Go To Market Strategy - 2030
Export potential enables firms to identify high-growth global markets with greater confidence by combining advanced trade intelligence with a structured quantitative methodology. The framework analyzes emerging demand trends and country-level import patterns while integrating macroeconomic and trade datasets such as GDP and population forecasts, bilateral import–export flows, tariff structures, elasticity differentials between developed and developing economies, geographic distance, and import demand projections. Using weighted trade values from 2020–2024 as the base period to project country-to-country export potential for 2030, these inputs are operationalized through calculated drivers such as gravity model parameters, tariff impact factors, and projected GDP per-capita growth. Through an analysis of hidden potentials, demand hotspots, and market conditions that are most favorable to success, this method enables firms to focus on target countries, maximize returns, and global expansion with data, backed by accuracy.
By factoring in the projected importer demand gap that is currently unmet and could be potential opportunity, it identifies the potential for the Exporter (Country) among 190 countries, against the general trade analysis, which identifies the biggest importer or exporter.
To discover high-growth global markets and optimize your business strategy:
Click Here
Pricing
- Single User License$ 1,995
- Department License$ 2,400
- Site License$ 3,120
- Global License$ 3,795

Leadership Perspectives from Industry Events
Search
Thought Leadership and Analyst Meet


Our Clients
6WResearch In News
- India Air Conditioner Market Set for Strong Rebound in 2026 After Weather-Led Correction and GST-Driven Recovery: 6Wresearch
- ADAS in India: How Automatic Emergency Braking, Blind Spot Detection & Driver Monitoring are Transforming Road Safety
- Doha a strategic location for EV manufacturing hub: IPA Qatar
- Demand for luxury TVs surging in the GCC, says Samsung
- Empowering Growth: The Thriving Journey of Bangladesh’s Cable Industry
- Demand for luxury TVs surging in the GCC, says Samsung
Latest Reports
- Nicaragua RPG Gaming Market (2026-2032)
- New Zealand RPG Gaming Market (2026-2032)
- Netherlands RPG Gaming Market (2026-2032)
- Nauru RPG Gaming Market (2026-2032)
- Namibia RPG Gaming Market (2026-2032)
- Mozambique RPG Gaming Market (2026-2032)
- Montenegro RPG Gaming Market (2026-2032)
- Mongolia RPG Gaming Market (2026-2032)
- Monaco RPG Gaming Market (2026-2032)
- Micronesia RPG Gaming Market (2026-2032)
Industry Events and Analyst Meet

EV India Expo 2026

HIMTEX 2026

India Refining Summit 2026

India EV Show 2026

EV tech India Expo 2026
Whitepaper
- Middle East & Africa Commercial Security Market Click here to view more.
- Middle East & Africa Fire Safety Systems & Equipment Market Click here to view more.
- GCC Drone Market Click here to view more.
- Middle East Lighting Fixture Market Click here to view more.
- GCC Physical & Perimeter Security Market Click here to view more.