Kazakhstan Canned Vegetables Market (2026 - 2032) | Size, Growth, Trends, Forecast, Industry, Value, Share, Revenue, Companies, COVID-19 IMPACT & Analysis
Market Forecast By Type (Tomatoes, Carrot, Peas, Corn, Spinach, Vegetable Blend, Others), By Category (Organic, Conventional), By Distribution Channel (Store-Based, Non-Store-Based) And Competitive Landscape
| Product Code: ETC175457 | Publication Date: Jan 2022 | Updated Date: Mar 2026 | Product Type: Market Research Report | |
| Publisher: 6Wresearch | Author: Ravi Bhandari | No. of Pages: 70 | No. of Figures: 35 | No. of Tables: 5 |
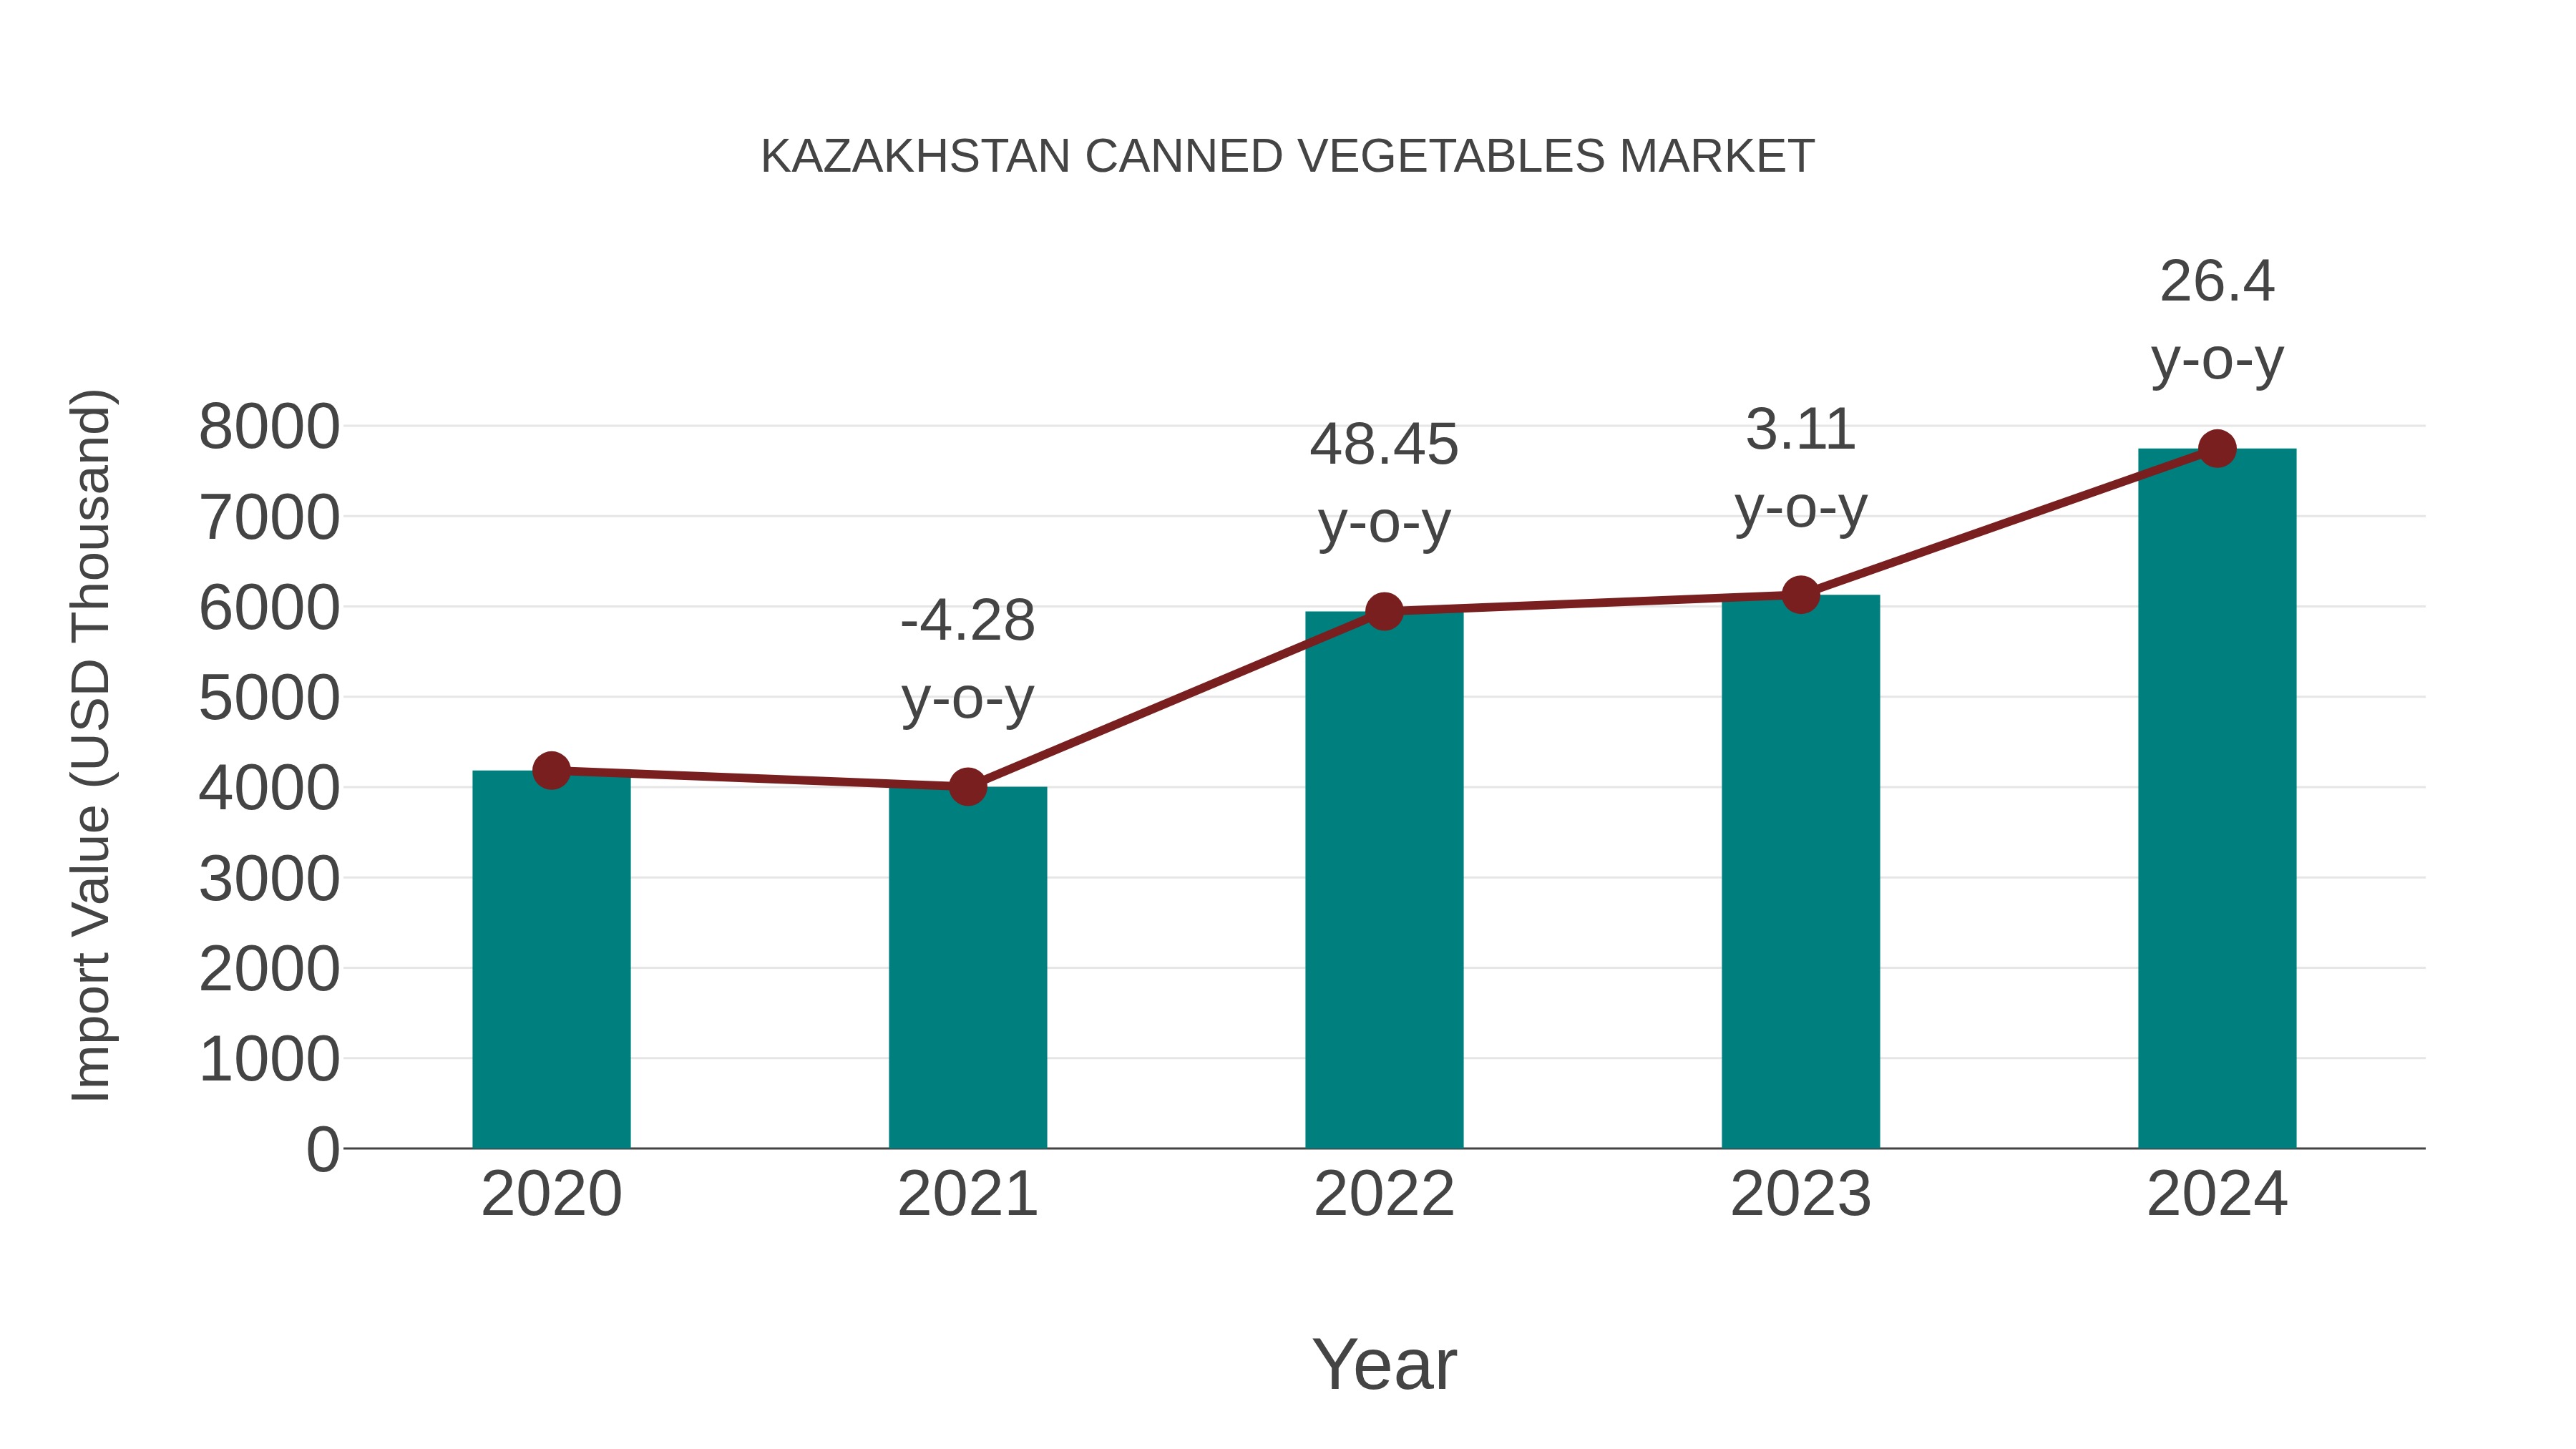
Kazakhstan Canned Vegetables Market: Import Trend Analysis
In the Kazakhstan canned vegetables market, the import trend showed a notable growth rate of 26.4% from 2023 to 2024, with a compound annual growth rate (CAGR) of 16.66% for the period 2020-2024. This significant increase in imports can be attributed to a shift in consumer preferences towards convenience foods, driving demand for canned vegetables in the market.
Kazakhstan Canned Vegetables Market Overview
The market for Canned Vegetables in Kazakhstan is driven by the demand for convenient and nutritious food options. The urban population`s busy lifestyle leads to a preference for ready-to-eat vegetables. Additionally, the efforts to reduce food wastage and extend the shelf life of vegetables support the market`s growth.
Drivers of the market
The canned vegetables market in Kazakhstan is influenced by various factors. Convenience, longer shelf life, and ease of storage and transportation are key drivers of market growth. Moreover, increasing awareness regarding the nutritional benefits of canned vegetables and their availability throughout the year contribute to the rising demand for these products.
Challenges of the market
One challenge in the canned vegetables market is preserving the nutritional value and texture of vegetables during the canning process. Additionally, consumer preferences for fresh and minimally processed foods may impact demand for canned vegetables.
Government Policy of the market
The canned vegetables market benefits from government initiatives to boost local agriculture. Policies include financial support for vegetable growers, investment in processing facilities, and incentives for using modern agricultural techniques. Import regulations are structured to encourage local production.
Key Highlights of the Report:
- Kazakhstan Canned Vegetables Market Outlook
- Market Size of Kazakhstan Canned Vegetables Market, 2025
- Forecast of Kazakhstan Canned Vegetables Market, 2032
- Historical Data and Forecast of Kazakhstan Canned Vegetables Revenues & Volume for the Period 2022-2032F
- Kazakhstan Canned Vegetables Market Trend Evolution
- Kazakhstan Canned Vegetables Market Drivers and Challenges
- Kazakhstan Canned Vegetables Price Trends
- Kazakhstan Canned Vegetables Porter's Five Forces
- Kazakhstan Canned Vegetables Industry Life Cycle
- Historical Data and Forecast of Kazakhstan Canned Vegetables Market Revenues & Volume By Type for the Period 2022-2032F
- Historical Data and Forecast of Kazakhstan Canned Vegetables Market Revenues & Volume By Tomatoes for the Period 2022-2032F
- Historical Data and Forecast of Kazakhstan Canned Vegetables Market Revenues & Volume By Carrot for the Period 2022-2032F
- Historical Data and Forecast of Kazakhstan Canned Vegetables Market Revenues & Volume By Peas for the Period 2022-2032F
- Historical Data and Forecast of Kazakhstan Canned Vegetables Market Revenues & Volume By Corn for the Period 2022-2032F
- Historical Data and Forecast of Kazakhstan Canned Vegetables Market Revenues & Volume By Spinach for the Period 2022-2032F
- Historical Data and Forecast of Kazakhstan Canned Vegetables Market Revenues & Volume By Vegetable Blend for the Period 2022-2032F
- Historical Data and Forecast of Kazakhstan Canned Vegetables Market Revenues & Volume By Others for the Period 2022-2032F
- Historical Data and Forecast of Kazakhstan Canned Vegetables Market Revenues & Volume By Category for the Period 2022-2032F
- Historical Data and Forecast of Kazakhstan Canned Vegetables Market Revenues & Volume By Organic for the Period 2022-2032F
- Historical Data and Forecast of Kazakhstan Canned Vegetables Market Revenues & Volume By Conventional for the Period 2022-2032F
- Historical Data and Forecast of Kazakhstan Canned Vegetables Market Revenues & Volume By Distribution Channel for the Period 2022-2032F
- Historical Data and Forecast of Kazakhstan Canned Vegetables Market Revenues & Volume By Store-Based for the Period 2022-2032F
- Historical Data and Forecast of Kazakhstan Canned Vegetables Market Revenues & Volume By Non-Store-Based for the Period 2022-2032F
- Kazakhstan Canned Vegetables Import Export Trade Statistics
- Market Opportunity Assessment By Type
- Market Opportunity Assessment By Category
- Market Opportunity Assessment By Distribution Channel
- Kazakhstan Canned Vegetables Top Companies Market Share
- Kazakhstan Canned Vegetables Competitive Benchmarking By Technical and Operational Parameters
- Kazakhstan Canned Vegetables Company Profiles
- Kazakhstan Canned Vegetables Key Strategic Recommendations
Kazakhstan Canned Vegetables Market (2026 - 2032): FAQs
6Wresearch actively monitors the Kazakhstan Canned Vegetables Market and publishes its comprehensive annual report, highlighting emerging trends, growth drivers, revenue analysis, and forecast outlook. Our insights help businesses to make data-backed strategic decisions with ongoing market dynamics. Our analysts track relevent industries related to the Kazakhstan Canned Vegetables Market, allowing our clients with actionable intelligence and reliable forecasts tailored to emerging regional needs.
Yes, we provide customisation as per your requirements. To learn more, feel free to contact us on sales@6wresearch.com
1 Executive Summary |
2 Introduction |
2.1 Key Highlights of the Report |
2.2 Report Description |
2.3 Market Scope & Segmentation |
2.4 Research Methodology |
2.5 Assumptions |
3 Kazakhstan Canned Vegetables Market Overview |
3.1 Kazakhstan Country Macro Economic Indicators |
3.2 Kazakhstan Canned Vegetables Market Revenues & Volume, 2022 & 2032F |
3.3 Kazakhstan Canned Vegetables Market - Industry Life Cycle |
3.4 Kazakhstan Canned Vegetables Market - Porter's Five Forces |
3.5 Kazakhstan Canned Vegetables Market Revenues & Volume Share, By Type, 2022 & 2032F |
3.6 Kazakhstan Canned Vegetables Market Revenues & Volume Share, By Category, 2022 & 2032F |
3.7 Kazakhstan Canned Vegetables Market Revenues & Volume Share, By Distribution Channel, 2022 & 2032F |
4 Kazakhstan Canned Vegetables Market Dynamics |
4.1 Impact Analysis |
4.2 Market Drivers |
4.2.1 Increasing consumer awareness about the benefits of canned vegetables for convenience and nutrition. |
4.2.2 Growing demand for ready-to-eat food products due to busy lifestyles. |
4.2.3 Expanding distribution channels and retail presence for canned vegetables in Kazakhstan. |
4.3 Market Restraints |
4.3.1 Concerns over the quality and freshness of canned vegetables compared to fresh produce. |
4.3.2 Fluctuating prices of raw materials impacting the production cost of canned vegetables. |
4.3.3 Competition from other convenient food options like frozen vegetables or fresh-cut produce. |
5 Kazakhstan Canned Vegetables Market Trends |
6 Kazakhstan Canned Vegetables Market, By Types |
6.1 Kazakhstan Canned Vegetables Market, By Type |
6.1.1 Overview and Analysis |
6.1.2 Kazakhstan Canned Vegetables Market Revenues & Volume, By Type, 2022 - 2032F |
6.1.3 Kazakhstan Canned Vegetables Market Revenues & Volume, By Tomatoes, 2022 - 2032F |
6.1.4 Kazakhstan Canned Vegetables Market Revenues & Volume, By Carrot, 2022 - 2032F |
6.1.5 Kazakhstan Canned Vegetables Market Revenues & Volume, By Peas, 2022 - 2032F |
6.1.6 Kazakhstan Canned Vegetables Market Revenues & Volume, By Corn, 2022 - 2032F |
6.1.7 Kazakhstan Canned Vegetables Market Revenues & Volume, By Spinach, 2022 - 2032F |
6.1.8 Kazakhstan Canned Vegetables Market Revenues & Volume, By Vegetable Blend, 2022 - 2032F |
6.2 Kazakhstan Canned Vegetables Market, By Category |
6.2.1 Overview and Analysis |
6.2.2 Kazakhstan Canned Vegetables Market Revenues & Volume, By Organic, 2022 - 2032F |
6.2.3 Kazakhstan Canned Vegetables Market Revenues & Volume, By Conventional, 2022 - 2032F |
6.3 Kazakhstan Canned Vegetables Market, By Distribution Channel |
6.3.1 Overview and Analysis |
6.3.2 Kazakhstan Canned Vegetables Market Revenues & Volume, By Store-Based, 2022 - 2032F |
6.3.3 Kazakhstan Canned Vegetables Market Revenues & Volume, By Non-Store-Based, 2022 - 2032F |
7 Kazakhstan Canned Vegetables Market Import-Export Trade Statistics |
7.1 Kazakhstan Canned Vegetables Market Export to Major Countries |
7.2 Kazakhstan Canned Vegetables Market Imports from Major Countries |
8 Kazakhstan Canned Vegetables Market Key Performance Indicators |
8.1 Consumer satisfaction index with the quality and variety of canned vegetable products. |
8.2 Market penetration rate of canned vegetables in urban vs. rural areas in Kazakhstan. |
8.3 Percentage of repeat purchases or customer loyalty for canned vegetable brands. |
8.4 Average shelf space allocated to canned vegetables in supermarkets and grocery stores. |
8.5 Number of new product innovations and launches in the canned vegetable segment. |
9 Kazakhstan Canned Vegetables Market - Opportunity Assessment |
9.1 Kazakhstan Canned Vegetables Market Opportunity Assessment, By Type, 2022 & 2032F |
9.2 Kazakhstan Canned Vegetables Market Opportunity Assessment, By Category, 2022 & 2032F |
9.3 Kazakhstan Canned Vegetables Market Opportunity Assessment, By Distribution Channel, 2022 & 2032F |
10 Kazakhstan Canned Vegetables Market - Competitive Landscape |
10.1 Kazakhstan Canned Vegetables Market Revenue Share, By Companies, 2025 |
10.2 Kazakhstan Canned Vegetables Market Competitive Benchmarking, By Operating and Technical Parameters |
11 Company Profiles |
12 Recommendations |
13 Disclaimer |
Global Go To Market Strategy - 2030
Export potential enables firms to identify high-growth global markets with greater confidence by combining advanced trade intelligence with a structured quantitative methodology. The framework analyzes emerging demand trends and country-level import patterns while integrating macroeconomic and trade datasets such as GDP and population forecasts, bilateral import–export flows, tariff structures, elasticity differentials between developed and developing economies, geographic distance, and import demand projections. Using weighted trade values from 2020–2024 as the base period to project country-to-country export potential for 2030, these inputs are operationalized through calculated drivers such as gravity model parameters, tariff impact factors, and projected GDP per-capita growth. Through an analysis of hidden potentials, demand hotspots, and market conditions that are most favorable to success, this method enables firms to focus on target countries, maximize returns, and global expansion with data, backed by accuracy.
By factoring in the projected importer demand gap that is currently unmet and could be potential opportunity, it identifies the potential for the Exporter (Country) among 190 countries, against the general trade analysis, which identifies the biggest importer or exporter.
To discover high-growth global markets and optimize your business strategy:
Click Here
Pricing
- Single User License$ 1,995
- Department License$ 2,400
- Site License$ 3,120
- Global License$ 3,795

Leadership Perspectives from Industry Events
Search
Thought Leadership and Analyst Meet


Our Clients
6WResearch In News
- India Export Attractiveness Tracker 2026
- India Air Conditioner Market Set for Strong Rebound in 2026 After Weather-Led Correction and GST-Driven Recovery: 6Wresearch
- ADAS in India: How Automatic Emergency Braking, Blind Spot Detection & Driver Monitoring are Transforming Road Safety
- Doha a strategic location for EV manufacturing hub: IPA Qatar
- Demand for luxury TVs surging in the GCC, says Samsung
- Empowering Growth: The Thriving Journey of Bangladesh’s Cable Industry
Latest Reports
- Nicaragua RPG Gaming Market (2026-2032)
- New Zealand RPG Gaming Market (2026-2032)
- Netherlands RPG Gaming Market (2026-2032)
- Nauru RPG Gaming Market (2026-2032)
- Namibia RPG Gaming Market (2026-2032)
- Mozambique RPG Gaming Market (2026-2032)
- Montenegro RPG Gaming Market (2026-2032)
- Mongolia RPG Gaming Market (2026-2032)
- Monaco RPG Gaming Market (2026-2032)
- Micronesia RPG Gaming Market (2026-2032)
Industry Events and Analyst Meet

EV India Expo 2026

HIMTEX 2026

India Refining Summit 2026

India EV Show 2026

EV tech India Expo 2026
Whitepaper
- Middle East & Africa Commercial Security Market Click here to view more.
- Middle East & Africa Fire Safety Systems & Equipment Market Click here to view more.
- GCC Drone Market Click here to view more.
- Middle East Lighting Fixture Market Click here to view more.
- GCC Physical & Perimeter Security Market Click here to view more.