Kazakhstan Chlorine Market (2026-2032) Outlook | Trends, Industry, Revenue, Value, Analysis, Share, Forecast, Size, Growth & Companies
Market Forecast By Application (EDC/PVC, Isocyanates and Oxygenates, Chloromethanes, Solvents and Epichlorohydrin, Inorganic Chemicals, Other Applications), By End-user Industry (Water Treatment, Pharmaceutical, Chemicals, Paper and Pulp, Plastic, Pesticides, Other End-user Industries) And Competitive Landscape
| Product Code: ETC191290 | Publication Date: May 2022 | Updated Date: Mar 2026 | Product Type: Market Research Report | |
| Publisher: 6Wresearch | Author: Ravi Bhandari | No. of Pages: 60 | No. of Figures: 40 | No. of Tables: 7 |
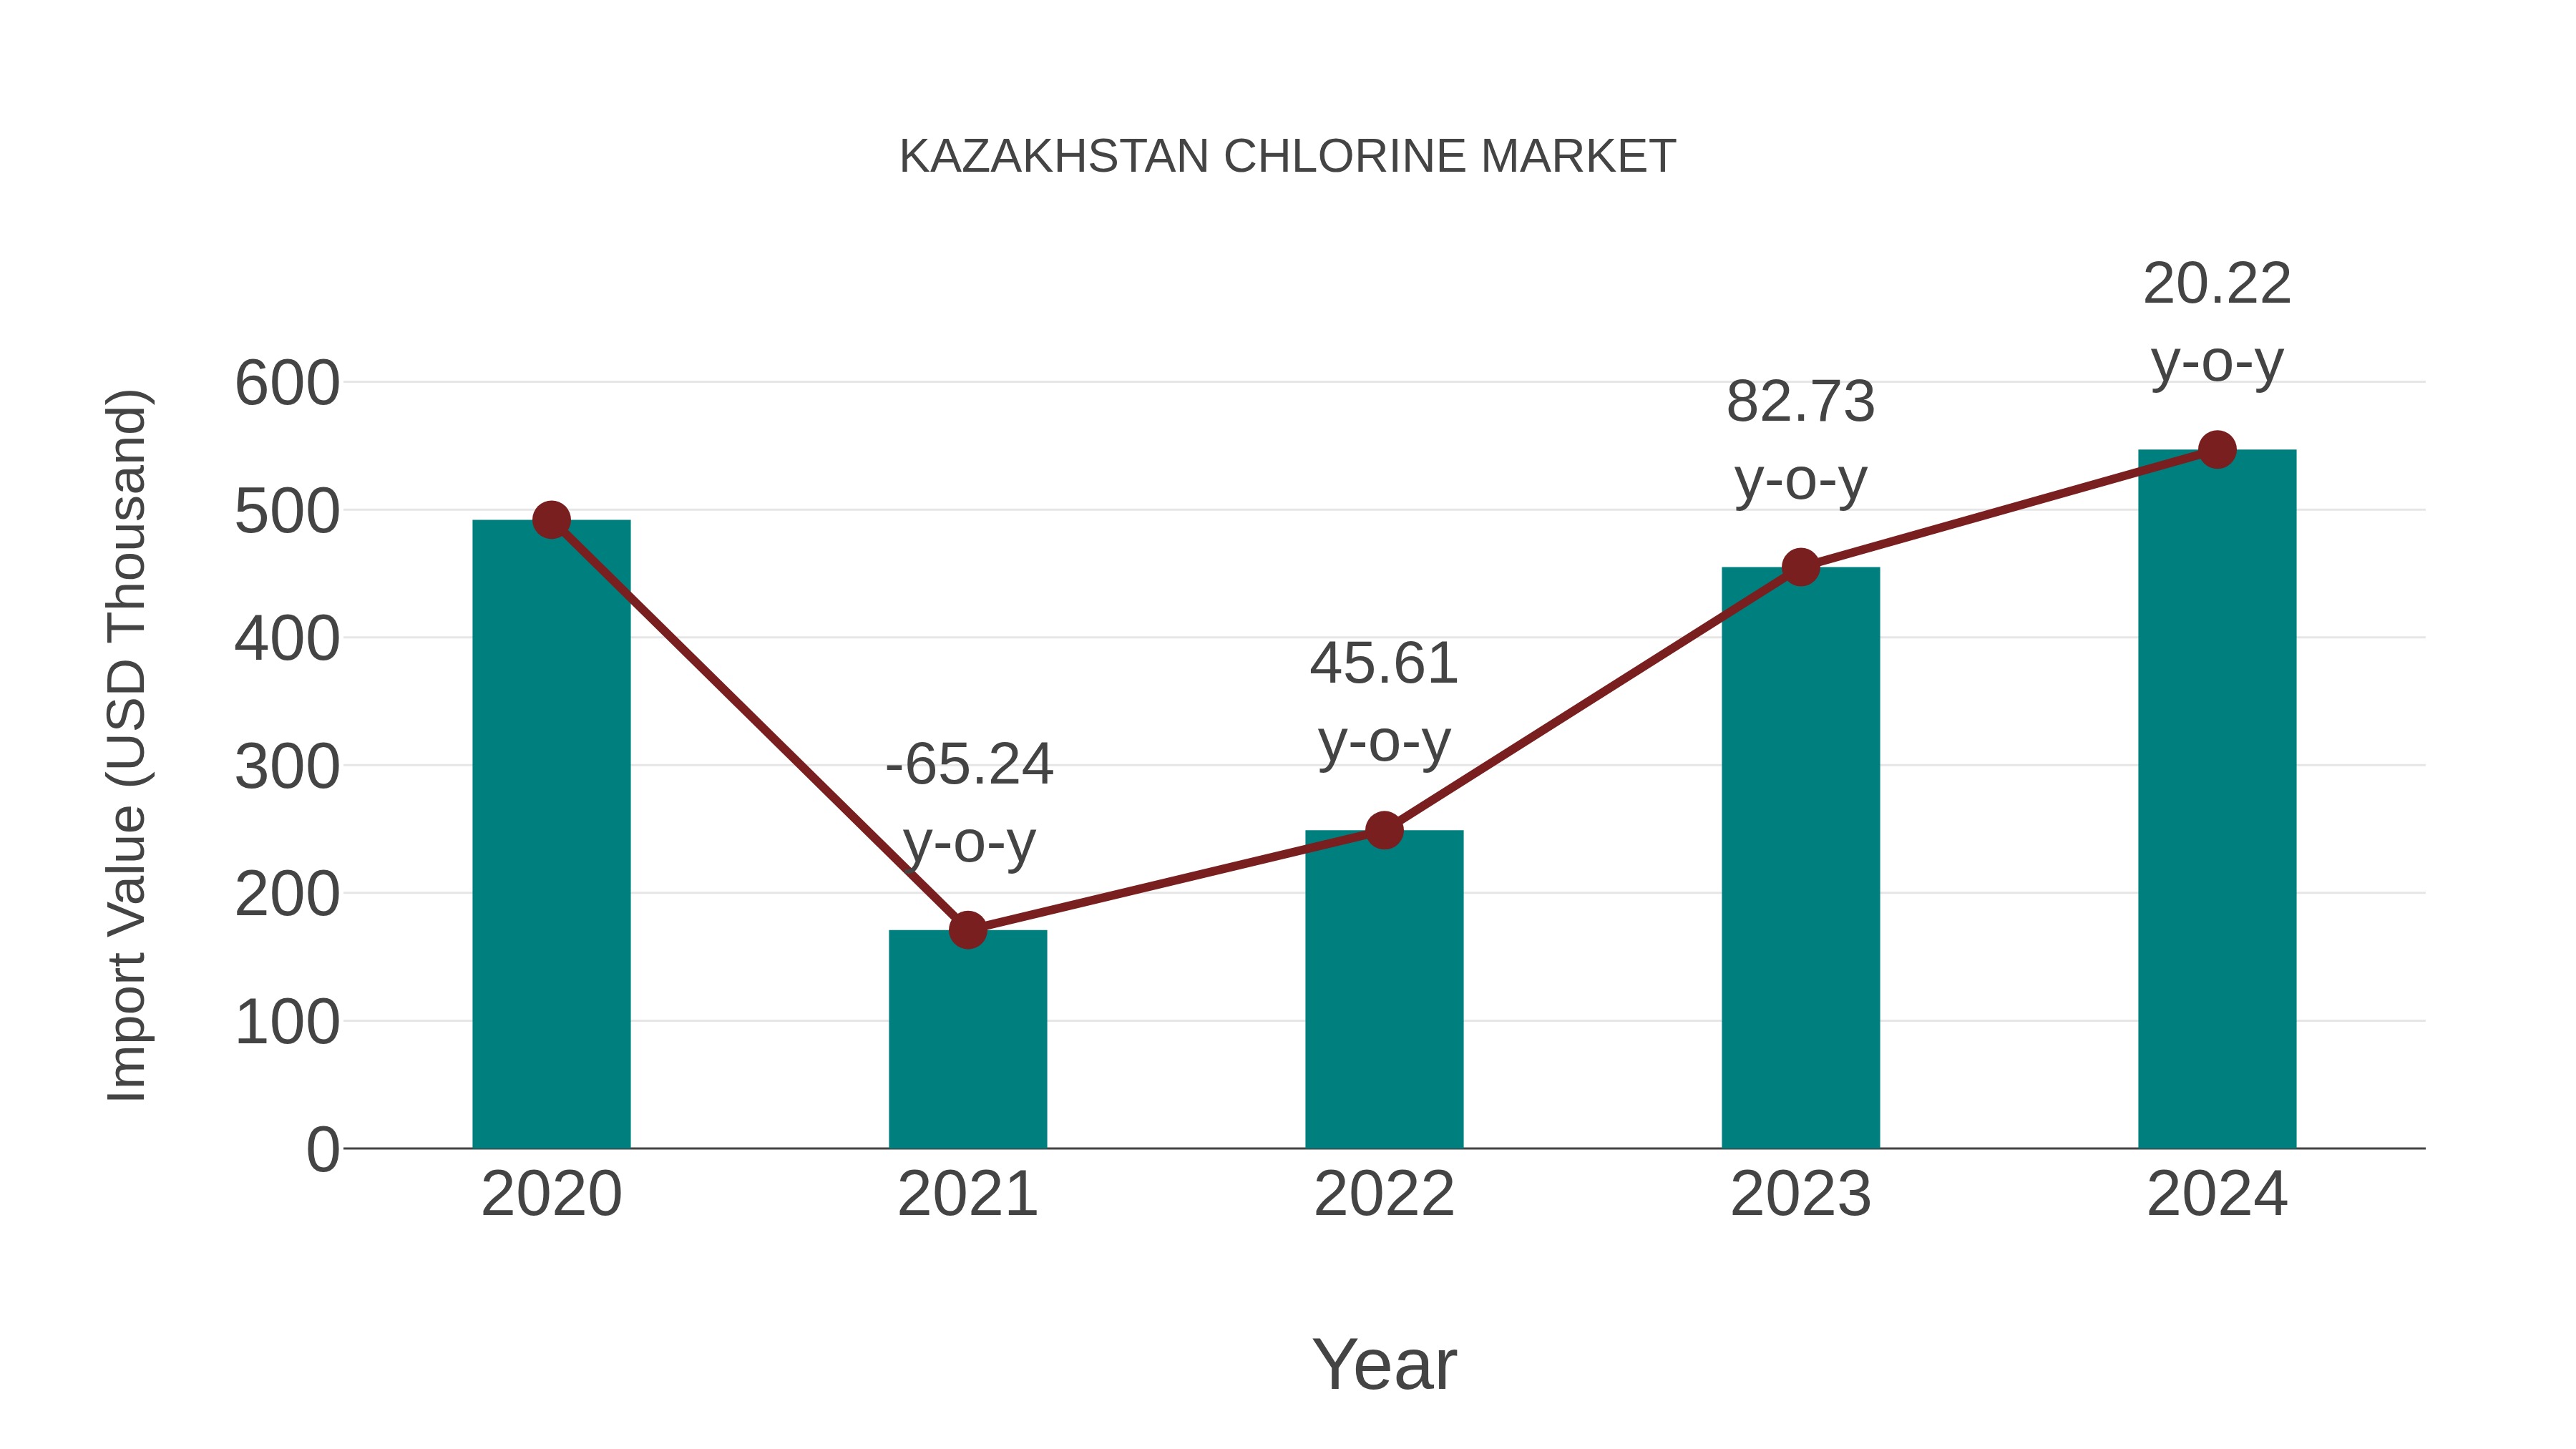
Kazakhstan Chlorine Market: Import Trend Analysis
In the Kazakhstan chlorine market, the import trend showed a notable growth rate of 20.22% from 2023 to 2024, with a compound annual growth rate (CAGR) of 2.68% from 2020 to 2024. This import momentum can be attributed to shifting demand dynamics or evolving trade policies within the market, influencing its overall stability and competitiveness.
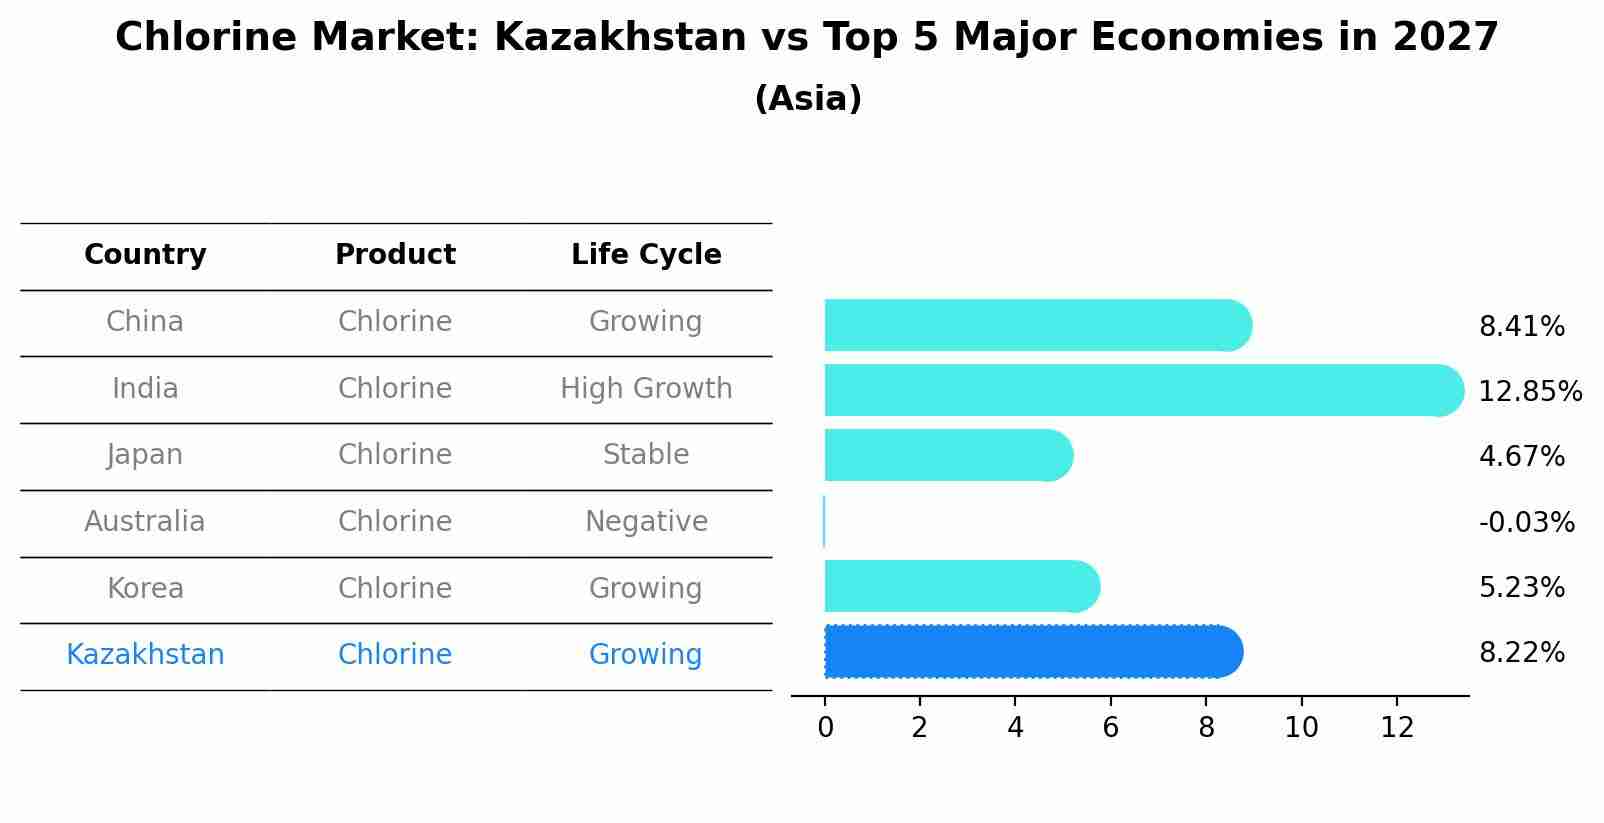
Chlorine Market: Kazakhstan vs Top 5 Major Economies in 2027 (Asia)
The Chlorine market in Kazakhstan is projected to grow at a growing growth rate of 8.22% by 2027, highlighting the country's increasing focus on advanced technologies within the Asia region, where China holds the dominant position, followed closely by India, Japan, Australia and South Korea, shaping overall regional demand.
Kazakhstan Chlorine Market Overview
Chlorine is a crucial chemical used in water treatment, disinfection, and the production of various chemical products. The chlorine market in Kazakhstan is driven by the growing demand for clean water and the expansion of the chemical industry. Investments in production facilities and the adoption of advanced chlorination technologies are key trends shaping this market.
Drivers of the market
The chlorine market in Kazakhstan is influenced by the country`s chemical industry, which relies heavily on chlorine for the production of a wide range of chemicals such as PVC, chlorinated solvents, and chlorinated intermediates. The growing construction, water treatment, and textile sectors further contribute to the demand for chlorine in the country.
Challenges of the market
One challenge in the Kazakhstan chlorine market may be the environmental concerns associated with chlorine production and usage, particularly regarding waste disposal and emissions control. Additionally, fluctuations in raw material prices, such as salt, and energy costs could pose challenges to market stability.
Government Policy of the market
To support industrial applications, government policies focus on enhancing manufacturing capabilities for equipment like chlorine compressors. This includes financial incentives for modernizing production plants.
Key Highlights of the Report:
- Kazakhstan Chlorine Market Outlook
- Market Size of Kazakhstan Chlorine Market, 2025
- Forecast of Kazakhstan Chlorine Market, 2032
- Historical Data and Forecast of Kazakhstan Chlorine Revenues & Volume for the Period 2022-2032F
- Kazakhstan Chlorine Market Trend Evolution
- Kazakhstan Chlorine Market Drivers and Challenges
- Kazakhstan Chlorine Price Trends
- Kazakhstan Chlorine Porter's Five Forces
- Kazakhstan Chlorine Industry Life Cycle
- Historical Data and Forecast of Kazakhstan Chlorine Market Revenues & Volume By Application for the Period 2022-2032F
- Historical Data and Forecast of Kazakhstan Chlorine Market Revenues & Volume By EDC/PVC for the Period 2022-2032F
- Historical Data and Forecast of Kazakhstan Chlorine Market Revenues & Volume By Isocyanates and Oxygenates for the Period 2022-2032F
- Historical Data and Forecast of Kazakhstan Chlorine Market Revenues & Volume By Chloromethanes for the Period 2022-2032F
- Historical Data and Forecast of Kazakhstan Chlorine Market Revenues & Volume By Solvents and Epichlorohydrin for the Period 2022-2032F
- Historical Data and Forecast of Kazakhstan Chlorine Market Revenues & Volume By Inorganic Chemicals for the Period 2022-2032F
- Historical Data and Forecast of Kazakhstan Chlorine Market Revenues & Volume By Other Applications for the Period 2022-2032F
- Historical Data and Forecast of Kazakhstan Chlorine Market Revenues & Volume By End-user Industry for the Period 2022-2032F
- Historical Data and Forecast of Kazakhstan Chlorine Market Revenues & Volume By Water Treatment for the Period 2022-2032F
- Historical Data and Forecast of Kazakhstan Chlorine Market Revenues & Volume By Pharmaceutical for the Period 2022-2032F
- Historical Data and Forecast of Kazakhstan Chlorine Market Revenues & Volume By Chemicals for the Period 2022-2032F
- Historical Data and Forecast of Kazakhstan Chlorine Market Revenues & Volume By Paper and Pulp for the Period 2022-2032F
- Historical Data and Forecast of Kazakhstan Chlorine Market Revenues & Volume By Plastic for the Period 2022-2032F
- Historical Data and Forecast of Kazakhstan Chlorine Market Revenues & Volume By Pesticides for the Period 2022-2032F
- Historical Data and Forecast of Kazakhstan Chlorine Market Revenues & Volume By Other End-user Industries for the Period 2022-2032F
- Kazakhstan Chlorine Import Export Trade Statistics
- Market Opportunity Assessment By Application
- Market Opportunity Assessment By End-user Industry
- Kazakhstan Chlorine Top Companies Market Share
- Kazakhstan Chlorine Competitive Benchmarking By Technical and Operational Parameters
- Kazakhstan Chlorine Company Profiles
- Kazakhstan Chlorine Key Strategic Recommendations
Kazakhstan Chlorine Market (2026-2032): FAQs
6Wresearch actively monitors the Kazakhstan Chlorine Market and publishes its comprehensive annual report, highlighting emerging trends, growth drivers, revenue analysis, and forecast outlook. Our insights help businesses to make data-backed strategic decisions with ongoing market dynamics. Our analysts track relevent industries related to the Kazakhstan Chlorine Market, allowing our clients with actionable intelligence and reliable forecasts tailored to emerging regional needs.
Yes, we provide customisation as per your requirements. To learn more, feel free to contact us on sales@6wresearch.com
1 Executive Summary |
2 Introduction |
2.1 Key Highlights of the Report |
2.2 Report Description |
2.3 Market Scope & Segmentation |
2.4 Research Methodology |
2.5 Assumptions |
3 Kazakhstan Chlorine Market Overview |
3.1 Kazakhstan Country Macro Economic Indicators |
3.2 Kazakhstan Chlorine Market Revenues & Volume, 2022 & 2032F |
3.3 Kazakhstan Chlorine Market - Industry Life Cycle |
3.4 Kazakhstan Chlorine Market - Porter's Five Forces |
3.5 Kazakhstan Chlorine Market Revenues & Volume Share, By Application, 2022 & 2032F |
3.6 Kazakhstan Chlorine Market Revenues & Volume Share, By End-user Industry, 2022 & 2032F |
4 Kazakhstan Chlorine Market Dynamics |
4.1 Impact Analysis |
4.2 Market Drivers |
4.2.1 Growing demand for chlorine-based products in industries such as water treatment, chemicals, and pharmaceuticals. |
4.2.2 Increasing investments in infrastructure projects and industrial development in Kazakhstan. |
4.2.3 Favorable government regulations supporting the use of chlorine for various applications. |
4.3 Market Restraints |
4.3.1 Fluctuations in raw material prices, such as salt and electricity, impacting the production cost of chlorine. |
4.3.2 Environmental concerns related to the use of chlorine and its by-products, leading to stricter regulations. |
4.3.3 Competition from alternative water treatment technologies and substitutes for chlorine products. |
5 Kazakhstan Chlorine Market Trends |
6 Kazakhstan Chlorine Market, By Types |
6.1 Kazakhstan Chlorine Market, By Application |
6.1.1 Overview and Analysis |
6.1.2 Kazakhstan Chlorine Market Revenues & Volume, By Application, 2022-2032F |
6.1.3 Kazakhstan Chlorine Market Revenues & Volume, By EDC/PVC, 2022-2032F |
6.1.4 Kazakhstan Chlorine Market Revenues & Volume, By Isocyanates and Oxygenates, 2022-2032F |
6.1.5 Kazakhstan Chlorine Market Revenues & Volume, By Chloromethanes, 2022-2032F |
6.1.6 Kazakhstan Chlorine Market Revenues & Volume, By Solvents and Epichlorohydrin, 2022-2032F |
6.1.7 Kazakhstan Chlorine Market Revenues & Volume, By Inorganic Chemicals, 2022-2032F |
6.1.8 Kazakhstan Chlorine Market Revenues & Volume, By Other Applications, 2022-2032F |
6.2 Kazakhstan Chlorine Market, By End-user Industry |
6.2.1 Overview and Analysis |
6.2.2 Kazakhstan Chlorine Market Revenues & Volume, By Water Treatment, 2022-2032F |
6.2.3 Kazakhstan Chlorine Market Revenues & Volume, By Pharmaceutical, 2022-2032F |
6.2.4 Kazakhstan Chlorine Market Revenues & Volume, By Chemicals, 2022-2032F |
6.2.5 Kazakhstan Chlorine Market Revenues & Volume, By Paper and Pulp, 2022-2032F |
6.2.6 Kazakhstan Chlorine Market Revenues & Volume, By Plastic, 2022-2032F |
6.2.7 Kazakhstan Chlorine Market Revenues & Volume, By Pesticides, 2022-2032F |
7 Kazakhstan Chlorine Market Import-Export Trade Statistics |
7.1 Kazakhstan Chlorine Market Export to Major Countries |
7.2 Kazakhstan Chlorine Market Imports from Major Countries |
8 Kazakhstan Chlorine Market Key Performance Indicators |
8.1 Energy efficiency of chlorine production processes. |
8.2 Adoption rate of chlorine-based solutions in different industries. |
8.3 Compliance with environmental standards and regulations for chlorine usage. |
9 Kazakhstan Chlorine Market - Opportunity Assessment |
9.1 Kazakhstan Chlorine Market Opportunity Assessment, By Application, 2022 & 2032F |
9.2 Kazakhstan Chlorine Market Opportunity Assessment, By End-user Industry, 2022 & 2032F |
10 Kazakhstan Chlorine Market - Competitive Landscape |
10.1 Kazakhstan Chlorine Market Revenue Share, By Companies, 2025 |
10.2 Kazakhstan Chlorine Market Competitive Benchmarking, By Operating and Technical Parameters |
11 Company Profiles |
12 Recommendations |
13 Disclaimer |
Global Go To Market Strategy - 2030
Export potential enables firms to identify high-growth global markets with greater confidence by combining advanced trade intelligence with a structured quantitative methodology. The framework analyzes emerging demand trends and country-level import patterns while integrating macroeconomic and trade datasets such as GDP and population forecasts, bilateral import–export flows, tariff structures, elasticity differentials between developed and developing economies, geographic distance, and import demand projections. Using weighted trade values from 2020–2024 as the base period to project country-to-country export potential for 2030, these inputs are operationalized through calculated drivers such as gravity model parameters, tariff impact factors, and projected GDP per-capita growth. Through an analysis of hidden potentials, demand hotspots, and market conditions that are most favorable to success, this method enables firms to focus on target countries, maximize returns, and global expansion with data, backed by accuracy.
By factoring in the projected importer demand gap that is currently unmet and could be potential opportunity, it identifies the potential for the Exporter (Country) among 190 countries, against the general trade analysis, which identifies the biggest importer or exporter.
To discover high-growth global markets and optimize your business strategy:
Click Here
Pricing
- Single User License$ 1,995
- Department License$ 2,400
- Site License$ 3,120
- Global License$ 3,795

Leadership Perspectives from Industry Events
Search
Thought Leadership and Analyst Meet


Our Clients
6WResearch In News
- India Export Attractiveness Tracker 2026
- India Air Conditioner Market Set for Strong Rebound in 2026 After Weather-Led Correction and GST-Driven Recovery: 6Wresearch
- ADAS in India: How Automatic Emergency Braking, Blind Spot Detection & Driver Monitoring are Transforming Road Safety
- Doha a strategic location for EV manufacturing hub: IPA Qatar
- Demand for luxury TVs surging in the GCC, says Samsung
- Empowering Growth: The Thriving Journey of Bangladesh’s Cable Industry
Latest Reports
- Nicaragua RPG Gaming Market (2026-2032)
- New Zealand RPG Gaming Market (2026-2032)
- Netherlands RPG Gaming Market (2026-2032)
- Nauru RPG Gaming Market (2026-2032)
- Namibia RPG Gaming Market (2026-2032)
- Mozambique RPG Gaming Market (2026-2032)
- Montenegro RPG Gaming Market (2026-2032)
- Mongolia RPG Gaming Market (2026-2032)
- Monaco RPG Gaming Market (2026-2032)
- Micronesia RPG Gaming Market (2026-2032)
Industry Events and Analyst Meet

EV India Expo 2026

HIMTEX 2026

India Refining Summit 2026

India EV Show 2026

EV tech India Expo 2026
Whitepaper
- Middle East & Africa Commercial Security Market Click here to view more.
- Middle East & Africa Fire Safety Systems & Equipment Market Click here to view more.
- GCC Drone Market Click here to view more.
- Middle East Lighting Fixture Market Click here to view more.
- GCC Physical & Perimeter Security Market Click here to view more.