Kenya Agricultural Tractors Market (2026-2032) | Industry, Revenue, Trends, Outlook, Analysis, Companies, Share, Value, Size, Forecast & Growth
Market Forecast By Drive Type (Two-wheel drive, Four-wheel drive), By System Type (Without loaders, Front loaders, Backhoe loaders), By Design Type (Tractor without CAB, Tractor with CAB), By Power Output (<30 hp, 31-100 hp, 101-200 hp, 201-300 hp, >300 hp), By Applications (Row Crop Tractors, Orchard Tractors, Other Applications) And Competitive Landscape
| Product Code: ETC025570 | Publication Date: Oct 2020 | Updated Date: Jun 2026 | Product Type: Report | |
| Publisher: 6Wresearch | Author: Bhawna Singh | No. of Pages: 70 | No. of Figures: 35 | No. of Tables: 5 |
Kenya Agricultural Tractors Market Summary
The kenya agricultural tractors market was estimated at USD 463 Million in 2025 and is projected to reach USD 629 Million by 2032, growing at a CAGR of 5.5% from 2026 to 2032.
Kenya Agricultural Tractors Market Year-wise Growth Rate and Key Drivers
This graph highlights how the Kenya Agricultural Tractors Market has steadily grown over the past five years, supported by major growth factors.
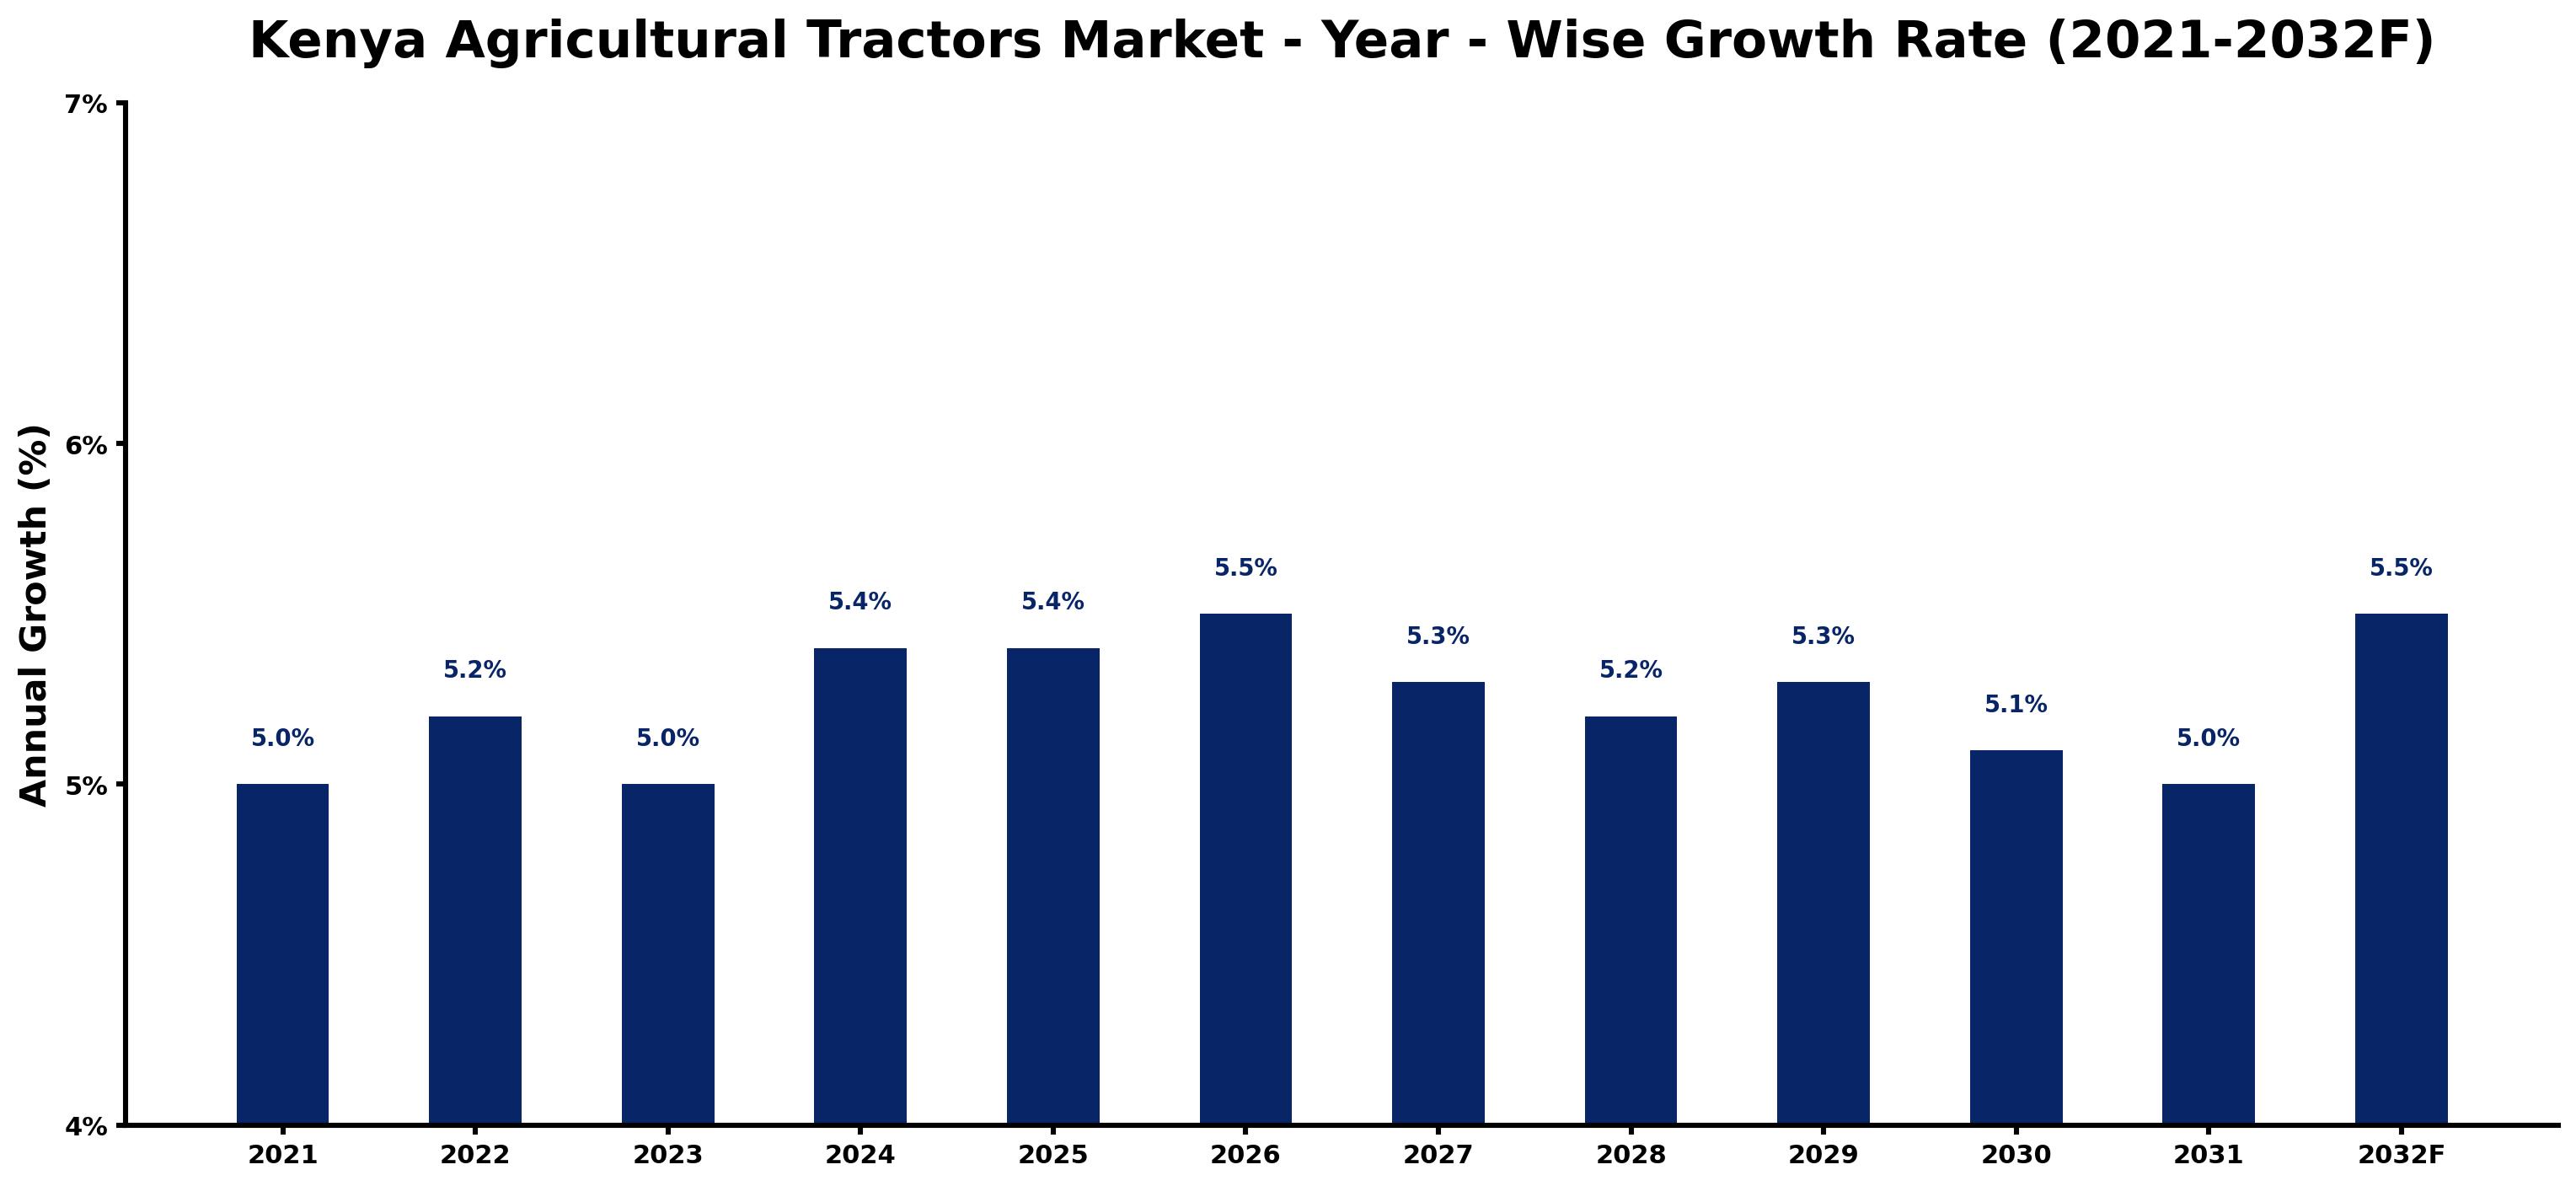
The table below presents the year wise growth rates along with the key drivers influencing the market
| Year | Growth Rate | Major Drivers |
| 2021 | 5.0% | Farm mechanization efforts have led to increased tractor utilization in smallholder agriculture. |
| 2022 | 5.2% | Rising food security concerns push farmers towards more efficient agricultural practices. |
| 2023 | 5.0% | Technological innovations in tractor design are enhancing productivity for Kenyan farmers. |
| 2024 | 5.4% | Access to affordable financing options enables more farmers to purchase tractors. |
| 2025 | 5.4% | Emerging agribusiness models create new demand for specialized agricultural equipment. |
| 2026 | 5.5% | Climate change adaptability drives farmers to invest in more resilient farming machinery. |
| 2027 | 5.3% | The expansion of irrigation projects encourages tractor usage in previously untapped regions. |
| 2028 | 5.2% | Partnerships with local suppliers enhance the availability of tractor maintenance services. |
| 2029 | 5.3% | Youth engagement in agriculture promotes the need for modern farming equipment. |
| 2030 | 5.1% | Increased export opportunities for agricultural products boost investment in machinery. |
| 2031 | 5.0% | The digitalization of farming leads to demand for smart, connected tractor technologies. |
| 2032 | 5.5% | A growing awareness of sustainable practices influences tractor purchasing decisions. |
Note - Market size estimations and growth projections presented in this report are based on 6Wresearch's advanced forecasting approach, validated with industry datasets as of June 2026.
Kenya Agricultural Tractors Market Synopsis
The Kenya Agricultural Tractors Market is projected to reach 5.5% and witness significant growth during the forecast period (2026-2032). The ongoing trend towards mechanization in agriculture is reshaping the landscape of farming in Kenya, where small-scale farmers are increasingly investing in tractors to enhance their efficiency and productivity. This growth trajectory is further bolstered by various government initiatives that support agricultural mechanization and favorable financial frameworks for farmers.
Kenya Agricultural Tractors Market Growth Drivers
The growth of the Kenya Agricultural Tractors Market is driven by several key factors:
- The rising mechanization trend in agriculture is a significant driver, as farmers adopt modern practices to boost their crop yields and operational efficiency.
- Government initiatives aimed at promoting agricultural mechanization provide a conducive environment for growth, offering subsidies and incentives that lower the cost of acquiring tractors.
- Access to financing options for smallholder farmers enables more producers to invest in tractors, thereby improving their farming capabilities.
- The increasing demand for food security necessitates enhanced agricultural output, further stimulating the need for modern farming equipment.
- Technological advancements in tractor design, including the integration of GPS and precision farming capabilities, attract farmers looking to optimize their farming practices.
Kenya Agricultural Tractors Market Trends and Opportunities
The Kenya Agricultural Tractors Market is witnessing distinct trends that present attractive opportunities:
- There is a notable shift towards smaller, more compact tractors that cater to the needs of smallholder farmers, who often operate on limited land.
- Farmers are increasingly interested in tractors that incorporate sustainable technologies, such as electric or hybrid models, aligning with global sustainability trends.
- The demand for precision farming techniques drives interest in tractors that integrate smart technologies to improve crop management and yield.
- As the agricultural sector becomes more mechanized, there is growing demand for associated services such as maintenance and repair, creating additional business opportunities.
- Investments in local manufacturing and assembly of tractors could capitalize on government initiatives aimed at reducing import dependency.
Kenya Agricultural Tractors Market Challenges and Restraints
Despite the positive growth outlook, the Kenya Agricultural Tractors Market faces several challenges:
- Limited access to credit remains a significant barrier for many smallholder farmers, hindering their ability to purchase tractors.
- High import duties and taxes on agricultural machinery contribute to elevated costs, making it difficult for farmers to invest in new tractors.
- Inadequate infrastructure, particularly poor road conditions, affects the distribution and effectiveness of tractor usage across various regions.
- A lack of technical skills among farmers regarding tractor operation and maintenance further limits effective usage and productivity.
- The fragmented market structure, with numerous small-scale dealers, complicates the supply chain and can result in inefficiencies for manufacturers.
Kenya Agricultural Tractors Market Government Investment and Initiatives
Government policies and initiatives play a crucial role in the Kenya Agricultural Tractors Market. Key governmental frameworks include:
- The National Agricultural Mechanization Policy, aimed at enhancing access to affordable agricultural machinery, including tractors, to boost productivity and food security.
- The implementation of subsidies and other financial incentives to encourage farmers and cooperatives to adopt mechanized farming practices.
- Periodic reviews of import duties and taxes on agricultural machinery support local manufacturing and aim to reduce the financial burden on farmers.
- Investment in rural infrastructure development is also a priority, as improved roads and storage facilities enhance the distribution and utilization of tractors.
- Government-sponsored training programs aim to equip farmers with the necessary skills to operate and maintain tractors effectively.
Kenya Agricultural Tractors Market Latest Developments (May 2025 - June 2026)
During the period from May 2025 to June 2026, the Kenya Agricultural Tractors Market has seen several notable developments:
- An increased focus on local assembly of tractors has emerged, with several initiatives aimed at promoting domestic manufacturing capabilities.
- Innovations in tractor technology have gained traction, with farmers showing heightened interest in precision farming technologies to enhance agricultural output.
- Government incentives aimed at supporting farmers in acquiring tractors continue to stimulate market activity and engagement.
- Public-private partnerships have begun to form, aimed at improving access to finance for smallholder farmers to facilitate equipment purchases.
- An increase in awareness about the benefits of mechanization has contributed to a greater acceptance of tractor use among traditional farming communities.
Kenya Agricultural Tractors Market - Key Attractiveness of the Report
- 10 Years of Market Numbers
- Historical Data Starting from 2022 to 2025
- Base Year: 2025
- Forecast Data until 2032
- Key Performance Indicators Impacting the Market
- Major Upcoming Developments and Projects
Key Highlights of the Report:
- Kenya Agricultural Tractors Market Outlook
- Market Size of Kenya Agricultural Tractors Market, 2025
- Forecast of Kenya Agricultural Tractors Market, 2032F
- Historical Data and Forecast of Kenya Agricultural Tractors Revenues & Volume for the Period 2022-2032F
- Kenya Agricultural Tractors Market Trend Evolution
- Kenya Agricultural Tractors Market Drivers and Challenges
- Kenya Agricultural Tractors Price Trends
- Kenya Agricultural Tractors Porter's Five Forces
- Kenya Agricultural Tractors Industry Life Cycle
- Historical Data and Forecast of Kenya Agricultural Tractors Market Revenues & Volume By Drive Type for the Period 2022-2032F
- Historical Data and Forecast of Kenya Agricultural Tractors Market Revenues & Volume By Two-wheel drive for the Period 2022-2032F
- Historical Data and Forecast of Kenya Agricultural Tractors Market Revenues & Volume By Four-wheel drive for the Period 2022-2032F
- Historical Data and Forecast of Kenya Agricultural Tractors Market Revenues & Volume By System Type for the Period 2022-2032F
- Historical Data and Forecast of Kenya Agricultural Tractors Market Revenues & Volume By Without loaders for the Period 2022-2032F
- Historical Data and Forecast of Kenya Agricultural Tractors Market Revenues & Volume By Front loaders for the Period 2022-2032F
- Historical Data and Forecast of Kenya Agricultural Tractors Market Revenues & Volume By Backhoe loaders for the Period 2022-2032F
- Historical Data and Forecast of Kenya Agricultural Tractors Market Revenues & Volume By Design Type for the Period 2022-2032F
- Historical Data and Forecast of Kenya Agricultural Tractors Market Revenues & Volume By Tractor without CAB for the Period 2022-2032F
- Historical Data and Forecast of Kenya Agricultural Tractors Market Revenues & Volume By Tractor with CAB for the Period 2022-2032F
- Historical Data and Forecast of Kenya Agricultural Tractors Market Revenues & Volume By Power Output for the Period 2022-2032F
- Historical Data and Forecast of Kenya Agricultural Tractors Market Revenues & Volume By <30 hp for the Period 2022-2032F
- Historical Data and Forecast of Kenya Agricultural Tractors Market Revenues & Volume By 31-100 hp for the Period 2022-2032F
- Historical Data and Forecast of Kenya Agricultural Tractors Market Revenues & Volume By 101-200 hp for the Period 2022-2032F
- Historical Data and Forecast of Kenya Agricultural Tractors Market Revenues & Volume By 201-300 hp for the Period 2022-2032F
- Historical Data and Forecast of Kenya Agricultural Tractors Market Revenues & Volume By >300 hp for the Period 2022-2032F
- Historical Data and Forecast of Kenya Agricultural Tractors Market Revenues & Volume By Applications for the Period 2022-2032F
- Historical Data and Forecast of Kenya Agricultural Tractors Market Revenues & Volume By Row Crop Tractors for the Period 2022-2032F
- Historical Data and Forecast of Kenya Agricultural Tractors Market Revenues & Volume By Orchard Tractors for the Period 2022-2032F
- Historical Data and Forecast of Kenya Agricultural Tractors Market Revenues & Volume By Other Applications for the Period 2022-2032F
- Kenya Agricultural Tractors Import Export Trade Statistics
- Market Opportunity Assessment By Drive Type
- Market Opportunity Assessment By System Type
- Market Opportunity Assessment By Design Type
- Market Opportunity Assessment By Power Output
- Market Opportunity Assessment By Applications
- Kenya Agricultural Tractors Top Companies Market Share
- Kenya Agricultural Tractors Competitive Benchmarking By Technical and Operational Parameters
- Kenya Agricultural Tractors Company Profiles
- Kenya Agricultural Tractors Key Strategic Recommendations
Frequently Asked Questions About the Market Study (FAQs):
The growth of the Kenya Agricultural Tractors Market is primarily driven by increasing mechanization in farming, government support initiatives, and a rising demand for food security.
Farmers often face challenges such as limited access to credit, high import duties, inadequate infrastructure, and a lack of technical skills related to tractor operation.
The government supports the market through various policies, including subsidies, the National Agricultural Mechanization Policy, and incentives aimed at promoting the adoption of agricultural machinery.
Key trends include the adoption of compact tractors, integration of smart technologies for precision farming, and a growing interest in sustainable farming practices like electric tractors.
6Wresearch actively monitors the Kenya Agricultural Tractors Market and publishes its comprehensive annual report, highlighting emerging trends, growth drivers, revenue analysis, and forecast outlook. Our insights help businesses to make data-backed strategic decisions with ongoing market dynamics. Our analysts track relevent industries related to the Kenya Agricultural Tractors Market, allowing our clients with actionable intelligence and reliable forecasts tailored to emerging regional needs.
Yes, we provide customisation as per your requirements. To learn more, feel free to contact us on sales@6wresearch.com
1 Executive Summary |
2 Introduction |
2.1 Key Highlights of the Report |
2.2 Report Description |
2.3 Market Scope & Segmentation |
2.4 Research Methodology |
2.5 Assumptions |
3 Kenya Agricultural Tractors Market Overview |
3.1 Kenya Country Macro Economic Indicators |
3.2 Kenya Agricultural Tractors Market Revenues & Volume, 2022 & 2032F |
3.3 Kenya Agricultural Tractors Market - Industry Life Cycle |
3.4 Kenya Agricultural Tractors Market - Porter's Five Forces |
3.5 Kenya Agricultural Tractors Market Revenues & Volume Share, By Drive Type, 2022 & 2032F |
3.6 Kenya Agricultural Tractors Market Revenues & Volume Share, By System Type, 2022 & 2032F |
3.7 Kenya Agricultural Tractors Market Revenues & Volume Share, By Design Type, 2022 & 2032F |
3.8 Kenya Agricultural Tractors Market Revenues & Volume Share, By Power Output, 2022 & 2032F |
3.9 Kenya Agricultural Tractors Market Revenues & Volume Share, By Applications, 2022 & 2032F |
4 Kenya Agricultural Tractors Market Dynamics |
4.1 Impact Analysis |
4.2 Market Drivers |
4.3 Market Restraints |
5 Kenya Agricultural Tractors Market Trends |
6 Kenya Agricultural Tractors Market, By Types |
6.1 Kenya Agricultural Tractors Market, By Drive Type |
6.1.1 Overview and Analysis |
6.1.2 Kenya Agricultural Tractors Market Revenues & Volume, By Drive Type, 2022-2032F |
6.1.3 Kenya Agricultural Tractors Market Revenues & Volume, By Two-wheel drive, 2022-2032F |
6.1.4 Kenya Agricultural Tractors Market Revenues & Volume, By Four-wheel drive, 2022-2032F |
6.2 Kenya Agricultural Tractors Market, By System Type |
6.2.1 Overview and Analysis |
6.2.2 Kenya Agricultural Tractors Market Revenues & Volume, By Without loaders, 2022-2032F |
6.2.3 Kenya Agricultural Tractors Market Revenues & Volume, By Front loaders, 2022-2032F |
6.2.4 Kenya Agricultural Tractors Market Revenues & Volume, By Backhoe loaders, 2022-2032F |
6.3 Kenya Agricultural Tractors Market, By Design Type |
6.3.1 Overview and Analysis |
6.3.2 Kenya Agricultural Tractors Market Revenues & Volume, By Tractor without CAB, 2022-2032F |
6.3.3 Kenya Agricultural Tractors Market Revenues & Volume, By Tractor with CAB, 2022-2032F |
6.4 Kenya Agricultural Tractors Market, By Power Output |
6.4.1 Overview and Analysis |
6.4.2 Kenya Agricultural Tractors Market Revenues & Volume, By <30 hp, 2022-2032F |
6.4.3 Kenya Agricultural Tractors Market Revenues & Volume, By 31-100 hp, 2022-2032F |
6.4.4 Kenya Agricultural Tractors Market Revenues & Volume, By 101-200 hp, 2022-2032F |
6.4.5 Kenya Agricultural Tractors Market Revenues & Volume, By 201-300 hp, 2022-2032F |
6.4.6 Kenya Agricultural Tractors Market Revenues & Volume, By >300 hp, 2022-2032F |
6.5 Kenya Agricultural Tractors Market, By Applications |
6.5.1 Overview and Analysis |
6.5.2 Kenya Agricultural Tractors Market Revenues & Volume, By Row Crop Tractors, 2022-2032F |
6.5.3 Kenya Agricultural Tractors Market Revenues & Volume, By Orchard Tractors, 2022-2032F |
6.5.4 Kenya Agricultural Tractors Market Revenues & Volume, By Other Applications, 2022-2032F |
7 Kenya Agricultural Tractors Market Import-Export Trade Statistics |
7.1 Kenya Agricultural Tractors Market Export to Major Countries |
7.2 Kenya Agricultural Tractors Market Imports from Major Countries |
8 Kenya Agricultural Tractors Market Key Performance Indicators |
9 Kenya Agricultural Tractors Market - Opportunity Assessment |
9.1 Kenya Agricultural Tractors Market Opportunity Assessment, By Drive Type, 2022 & 2032F |
9.2 Kenya Agricultural Tractors Market Opportunity Assessment, By System Type, 2022 & 2032F |
9.3 Kenya Agricultural Tractors Market Opportunity Assessment, By Design Type, 2022 & 2032F |
9.4 Kenya Agricultural Tractors Market Opportunity Assessment, By Power Output, 2022 & 2032F |
9.5 Kenya Agricultural Tractors Market Opportunity Assessment, By Applications, 2022 & 2032F |
10 Kenya Agricultural Tractors Market - Competitive Landscape |
10.1 Kenya Agricultural Tractors Market Revenue Share, By Companies, 2025 |
10.2 Kenya Agricultural Tractors Market Competitive Benchmarking, By Operating and Technical Parameters |
11 Company Profiles |
12 Recommendations |
13 Disclaimer |
Global Go To Market Strategy - 2030
Export potential enables firms to identify high-growth global markets with greater confidence by combining advanced trade intelligence with a structured quantitative methodology. The framework analyzes emerging demand trends and country-level import patterns while integrating macroeconomic and trade datasets such as GDP and population forecasts, bilateral import–export flows, tariff structures, elasticity differentials between developed and developing economies, geographic distance, and import demand projections. Using weighted trade values from 2020–2024 as the base period to project country-to-country export potential for 2030, these inputs are operationalized through calculated drivers such as gravity model parameters, tariff impact factors, and projected GDP per-capita growth. Through an analysis of hidden potentials, demand hotspots, and market conditions that are most favorable to success, this method enables firms to focus on target countries, maximize returns, and global expansion with data, backed by accuracy.
By factoring in the projected importer demand gap that is currently unmet and could be potential opportunity, it identifies the potential for the Exporter (Country) among 190 countries, against the general trade analysis, which identifies the biggest importer or exporter.
To discover high-growth global markets and optimize your business strategy:
Click Here
Pricing
- Single User License$ 1,995
- Department License$ 2,400
- Site License$ 3,120
- Global License$ 3,795

Leadership Perspectives from Industry Events
Search
Thought Leadership and Analyst Meet


Our Clients
6WResearch In News
- India Air Conditioner Market Set for Strong Rebound in 2026 After Weather-Led Correction and GST-Driven Recovery: 6Wresearch
- ADAS in India: How Automatic Emergency Braking, Blind Spot Detection & Driver Monitoring are Transforming Road Safety
- Doha a strategic location for EV manufacturing hub: IPA Qatar
- Demand for luxury TVs surging in the GCC, says Samsung
- Empowering Growth: The Thriving Journey of Bangladesh’s Cable Industry
- Demand for luxury TVs surging in the GCC, says Samsung
Latest Reports
- Nicaragua RPG Gaming Market (2026-2032)
- New Zealand RPG Gaming Market (2026-2032)
- Netherlands RPG Gaming Market (2026-2032)
- Nauru RPG Gaming Market (2026-2032)
- Namibia RPG Gaming Market (2026-2032)
- Mozambique RPG Gaming Market (2026-2032)
- Montenegro RPG Gaming Market (2026-2032)
- Mongolia RPG Gaming Market (2026-2032)
- Monaco RPG Gaming Market (2026-2032)
- Micronesia RPG Gaming Market (2026-2032)
Industry Events and Analyst Meet

EV India Expo 2026

HIMTEX 2026

India Refining Summit 2026

India EV Show 2026

EV tech India Expo 2026
Whitepaper
- Middle East & Africa Commercial Security Market Click here to view more.
- Middle East & Africa Fire Safety Systems & Equipment Market Click here to view more.
- GCC Drone Market Click here to view more.
- Middle East Lighting Fixture Market Click here to view more.
- GCC Physical & Perimeter Security Market Click here to view more.