Kenya Core Plate Varnishes Market (2026-2032) Outlook | Value, Size, Revenue, Share, Trends, Companies, Analysis, Industry, Growth & Forecast
Market Forecast By Application (Motor, Generator, Transformer, Electromagnetic Poles, Others), By Chemical Material (Alkyd Phenolic, Polyurethane, Polyester, Others), By Type (Pigmented, Un-pigmented, Others) And Competitive Landscape
| Product Code: ETC320570 | Publication Date: Aug 2022 | Updated Date: Jul 2026 | Product Type: Market Research Report | |
| Publisher: 6Wresearch | Author: Ravi Bhandari | No. of Pages: 75 | No. of Figures: 35 | No. of Tables: 20 |
Kenya Core Plate Varnishes Market Size, Share & Growth Rate
The Kenya Core Plate Varnishes Market was estimated at USD 1223 Million in 2025 and is projected to reach USD 1737 Million by 2032, growing at a CAGR of 5.1% from 2026 to 2032. This upward trajectory is primarily fueled by the expanding printing and packaging sector, which increasingly demands advanced varnish solutions for enhanced print quality. As manufacturers focus on reducing operational downtime and improving overall efficiency, investment in high-performance core plate varnishes is becoming a strategic priority.
Kenya Core Plate Varnishes Market Year-wise Growth Rate and Key Drivers
This graph highlights how the Kenya Core Plate Varnishes Market has steadily grown over the years, supported by major growth factors.
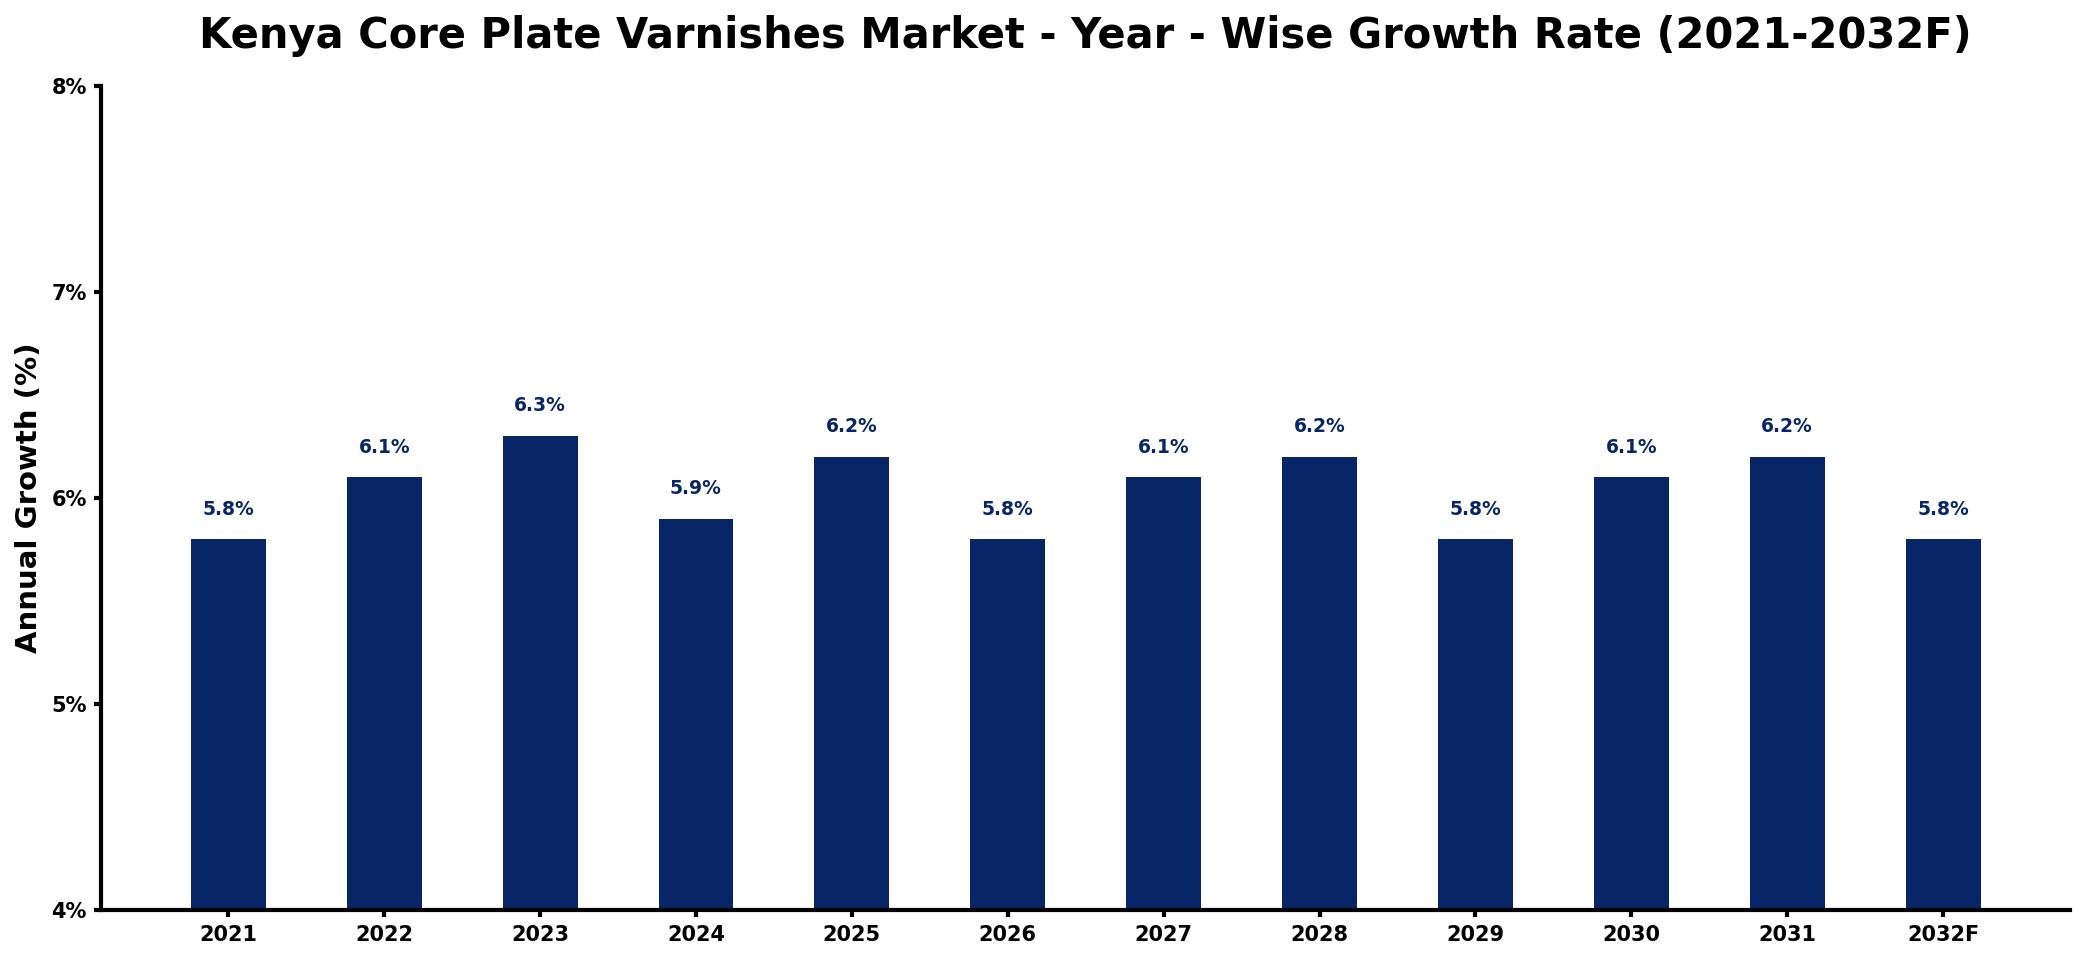
The table below presents the year‑wise growth rates along with the key drivers influencing the market
| Year | Growth Rate | Major Drivers |
| 2021 | 5.8% | Rising construction sector activities |
| 2022 | 6.1% | Increased automotive manufacturing demand |
| 2023 | 6.3% | Growing furniture production requirements |
| 2024 | 5.9% | Expansion in packaging industry needs |
| 2025 | 6.2% | Higher consumer electronics sales surge |
| 2026 | 5.8% | Boost in home renovation projects |
| 2027 | 6.1% | Emergence of eco-friendly initiatives |
| 2028 | 6.2% | Technological advancements in manufacturing |
| 2029 | 5.8% | Increased exports to neighboring countries |
| 2030 | 6.1% | Surge in DIY home projects |
| 2031 | 6.2% | Growing demand from hospitality sector |
| 2032 | 5.8% | Rising interest in sustainable products |
Note: Market size estimations and growth projections presented in this report are based on 6Wresearch's proprietary forecasting methodology, utilizing the latest available industry data, government publications, and primary research inputs.
Kenya Core Plate Varnishes Market Synopsis
A significant force shaping the Kenya Core Plate Varnishes Market is the burgeoning demand for high-resolution printing. This growth is closely linked to the rising consumer preferences for quality packaging, compelling printers and manufacturers to adopt advanced varnish technologies. The robust development in the energy sector and infrastructure projects further drive the need for high-performance varnishes, particularly in electrical applications.
Additionally, technological advancements are enhancing varnish properties, such as heat resistance and electrical insulation. As competition intensifies, the market is witnessing a wave of innovation, as companies strive to provide solutions that not only meet but exceed customer expectations while adhering to safety and environmental regulations.
Kenya Core Plate Varnishes Market Key Takeaways
- The market is propelled by the growth of the printing and packaging industry, which demands superior varnishes.
- Technological advancements are essential in meeting the evolving needs for high-performance core plate varnishes.
- Increased construction and energy projects are boosting demand for varnishes used in electrical applications.
- Manufacturers face challenges related to raw material costs and compliance with environmental standards.
- Government initiatives may enhance local production capabilities and set quality regulations to ensure market growth.
Evaluation of Restraints in Kenya Core Plate Varnishes Market
Despite the favorable market conditions, several constraints affect the growth of the Kenya Core Plate Varnishes Market. Fluctuating raw material prices present a significant challenge, as they can impact production costs and profitability for manufacturers. Furthermore, stringent regulations concerning volatile organic compounds (VOCs) necessitate that companies invest in compliance measures, which may divert resources from innovation and product development. This scenario underscores the need for manufacturers to adapt while maintaining quality and performance standards.
Kenya Core Plate Varnishes Market Trends
The Kenya Core Plate Varnishes Market is currently influenced by trends such as the shift towards sustainable manufacturing practices. Companies are increasingly looking to develop eco-friendly varnish formulations that comply with environmental regulations while meeting performance criteria. Additionally, the demand for customized varnish solutions is on the rise, reflecting the need for specialized products tailored to specific applications in printing and packaging.
Moreover, advancements in digital printing technologies are reshaping the landscape, as printers seek varnishes that can enhance print durability and visual appeal. As the market evolves, these trends will continue to drive innovation and shape customer preferences.
Kenya Core Plate Varnishes Market Opportunities
Significant growth and investment opportunities exist within the Kenya Core Plate Varnishes Market, particularly in sectors aligned with technological innovation. As the demand for high-quality electrical insulation varnishes rises alongside infrastructural developments, manufacturers that invest in R&D for new varnish technologies can establish a competitive edge. Furthermore, expanding local production capacity can open doors for collaboration with multinational corporations aiming to enter or expand within the Kenyan market.
Government Initiatives in the Kenya Core Plate Varnishes Market
The Kenyan government is likely to implement policies aimed at regulating the core plate varnishes market. These regulations may include safety requirements and quality standards that manufacturers must adhere to. Additionally, initiatives to promote sustainable manufacturing practices and support local production capabilities could play a critical role in enhancing the sector's competitiveness. Ensuring compliance with health and safety standards will also be prioritized to protect workers and the environment.
Future Insights of the Kenya Core Plate Varnishes Market
Looking ahead to the period from 2026 to 2032, the Kenya Core Plate Varnishes Market is poised for robust growth, driven by the anticipated expansion of the printing and packaging sectors. As technological advancements continue to improve varnish performance, there will be increased opportunities for innovation. Moreover, the alignment of government policies with industry needs may create a conducive environment for growth, ensuring that local manufacturers can compete effectively on a global scale.
Kenya Core Plate Varnishes Market Latest Developments (2025 - 2026)
Recent trends within the Kenya Core Plate Varnishes Market indicate a strong movement towards developing more environmentally friendly formulations. Several manufacturers are actively exploring new formulations that reduce volatile organic compounds while maintaining performance. Furthermore, ongoing collaborations between industry stakeholders aim to enhance local production capabilities, ensuring that domestic demand is met more sustainably and efficiently.
Kenya Core Plate Varnishes Market - Key Attractiveness of the Report
- 10 Years of Market Numbers
- Historical Data Starting from 2022 to 2025
- Base Year: 2025
- Forecast Data until 2032
- Key Performance Indicators Impacting the Market
- Major Upcoming Developments and Projects
Key Highlights of the Report:
- Kenya Core Plate Varnishes Market Outlook
- Market Size of Kenya Core Plate Varnishes Market, 2025
- Forecast of Kenya Core Plate Varnishes Market, 2032
- Historical Data and Forecast of Kenya Core Plate Varnishes Revenues & Volume for the Period 2022-2032F
- Kenya Core Plate Varnishes Market Trend Evolution
- Kenya Core Plate Varnishes Market Drivers and Challenges
- Kenya Core Plate Varnishes Price Trends
- Kenya Core Plate Varnishes Porter's Five Forces
- Kenya Core Plate Varnishes Industry Life Cycle
- Historical Data and Forecast of Kenya Core Plate Varnishes Market Revenues & Volume By Application for the Period 2022-2032F
- Historical Data and Forecast of Kenya Core Plate Varnishes Market Revenues & Volume By Motor for the Period 2022-2032F
- Historical Data and Forecast of Kenya Core Plate Varnishes Market Revenues & Volume By Generator for the Period 2022-2032F
- Historical Data and Forecast of Kenya Core Plate Varnishes Market Revenues & Volume By Transformer for the Period 2022-2032F
- Historical Data and Forecast of Kenya Core Plate Varnishes Market Revenues & Volume By Electromagnetic Poles for the Period 2022-2032F
- Historical Data and Forecast of Kenya Core Plate Varnishes Market Revenues & Volume By Others for the Period 2022-2032F
- Historical Data and Forecast of Kenya Core Plate Varnishes Market Revenues & Volume By Chemical Material for the Period 2022-2032F
- Historical Data and Forecast of Kenya Core Plate Varnishes Market Revenues & Volume By Alkyd Phenolic for the Period 2022-2032F
- Historical Data and Forecast of Kenya Core Plate Varnishes Market Revenues & Volume By Polyurethane for the Period 2022-2032F
- Historical Data and Forecast of Kenya Core Plate Varnishes Market Revenues & Volume By Polyester for the Period 2022-2032F
- Historical Data and Forecast of Kenya Core Plate Varnishes Market Revenues & Volume By Others for the Period 2022-2032F
- Historical Data and Forecast of Kenya Core Plate Varnishes Market Revenues & Volume By Type for the Period 2022-2032F
- Historical Data and Forecast of Kenya Core Plate Varnishes Market Revenues & Volume By Pigmented for the Period 2022-2032F
- Historical Data and Forecast of Kenya Core Plate Varnishes Market Revenues & Volume By Un-pigmented for the Period 2022-2032F
- Historical Data and Forecast of Kenya Core Plate Varnishes Market Revenues & Volume By Others for the Period 2022-2032F
- Kenya Core Plate Varnishes Import Export Trade Statistics
- Market Opportunity Assessment By Application
- Market Opportunity Assessment By Chemical Material
- Market Opportunity Assessment By Type
- Kenya Core Plate Varnishes Top Companies Market Share
- Kenya Core Plate Varnishes Competitive Benchmarking By Technical and Operational Parameters
- Kenya Core Plate Varnishes Company Profiles
- Kenya Core Plate Varnishes Key Strategic Recommendations
Frequently Asked Questions About the Market Study (FAQs):
The Kenya Core Plate Varnishes Market is projected to reach USD 1737 Million by 2032, growing from an estimated USD 1223 Million in 2025, at a CAGR of 5.1% from 2026 to 2032.
Technological advancements are pivotal, as they lead to the development of varnishes with improved properties such as heat resistance and enhanced electrical insulation, which are critical in various applications.
The printing and packaging sector is a primary driver of growth, as the increasing consumer demand for high-quality prints necessitates advanced core plate varnishes to achieve superior outcomes.
Manufacturers face significant challenges such as fluctuating raw material costs and the need for compliance with stringent environmental regulations related to VOCs, which can affect operational efficiency.
Yes, the Kenyan government is expected to implement regulations that will standardize varnish quality and safety requirements, as well as promote sustainable manufacturing practices.
6Wresearch actively monitors the Kenya Core Plate Varnishes Market and publishes its comprehensive annual report, highlighting emerging trends, growth drivers, revenue analysis, and forecast outlook. Our insights help businesses to make data-backed strategic decisions with ongoing market dynamics. Our analysts track relevent industries related to the Kenya Core Plate Varnishes Market, allowing our clients with actionable intelligence and reliable forecasts tailored to emerging regional needs.
Yes, we provide customisation as per your requirements. To learn more, feel free to contact us on sales@6wresearch.com
1 Executive Summary |
2 Introduction |
2.1 Key Highlights of the Report |
2.2 Report Description |
2.3 Market Scope & Segmentation |
2.4 Research Methodology |
2.5 Assumptions |
3 Kenya Core Plate Varnishes Market Overview |
3.1 Kenya Country Macro Economic Indicators |
3.2 Kenya Core Plate Varnishes Market Revenues & Volume, 2022 & 2032F |
3.3 Kenya Core Plate Varnishes Market - Industry Life Cycle |
3.4 Kenya Core Plate Varnishes Market - Porter's Five Forces |
3.5 Kenya Core Plate Varnishes Market Revenues & Volume Share, By Application, 2022 & 2032F |
3.6 Kenya Core Plate Varnishes Market Revenues & Volume Share, By Chemical Material, 2022 & 2032F |
3.7 Kenya Core Plate Varnishes Market Revenues & Volume Share, By Type, 2022 & 2032F |
4 Kenya Core Plate Varnishes Market Dynamics |
4.1 Impact Analysis |
4.2 Market Drivers |
4.2.1 Increasing demand for electricity infrastructure development in Kenya |
4.2.2 Growth of industrial sector leading to higher demand for core plate varnishes |
4.2.3 Rising investments in renewable energy projects driving the market growth |
4.3 Market Restraints |
4.3.1 Fluctuating raw material prices impacting production costs |
4.3.2 Limited availability of skilled labor for manufacturing core plate varnishes |
4.3.3 Stringent government regulations on environmental sustainability affecting production processes |
5 Kenya Core Plate Varnishes Market Trends |
6 Kenya Core Plate Varnishes Market, By Types |
6.1 Kenya Core Plate Varnishes Market, By Application |
6.1.1 Overview and Analysis |
6.1.2 Kenya Core Plate Varnishes Market Revenues & Volume, By Application, 2022-2032F |
6.1.3 Kenya Core Plate Varnishes Market Revenues & Volume, By Motor, 2022-2032F |
6.1.4 Kenya Core Plate Varnishes Market Revenues & Volume, By Generator, 2022-2032F |
6.1.5 Kenya Core Plate Varnishes Market Revenues & Volume, By Transformer, 2022-2032F |
6.1.6 Kenya Core Plate Varnishes Market Revenues & Volume, By Electromagnetic Poles, 2022-2032F |
6.1.7 Kenya Core Plate Varnishes Market Revenues & Volume, By Others, 2022-2032F |
6.2 Kenya Core Plate Varnishes Market, By Chemical Material |
6.2.1 Overview and Analysis |
6.2.2 Kenya Core Plate Varnishes Market Revenues & Volume, By Alkyd Phenolic, 2022-2032F |
6.2.3 Kenya Core Plate Varnishes Market Revenues & Volume, By Polyurethane, 2022-2032F |
6.2.4 Kenya Core Plate Varnishes Market Revenues & Volume, By Polyester, 2022-2032F |
6.2.5 Kenya Core Plate Varnishes Market Revenues & Volume, By Others, 2022-2032F |
6.3 Kenya Core Plate Varnishes Market, By Type |
6.3.1 Overview and Analysis |
6.3.2 Kenya Core Plate Varnishes Market Revenues & Volume, By Pigmented, 2022-2032F |
6.3.3 Kenya Core Plate Varnishes Market Revenues & Volume, By Un-pigmented, 2022-2032F |
6.3.4 Kenya Core Plate Varnishes Market Revenues & Volume, By Others, 2022-2032F |
7 Kenya Core Plate Varnishes Market Import-Export Trade Statistics |
7.1 Kenya Core Plate Varnishes Market Export to Major Countries |
7.2 Kenya Core Plate Varnishes Market Imports from Major Countries |
8 Kenya Core Plate Varnishes Market Key Performance Indicators |
8.1 Percentage increase in renewable energy projects in Kenya |
8.2 Adoption rate of advanced manufacturing technologies in core plate varnish production |
8.3 Number of new product innovations in the core plate varnishes market |
9 Kenya Core Plate Varnishes Market - Opportunity Assessment |
9.1 Kenya Core Plate Varnishes Market Opportunity Assessment, By Application, 2022 & 2032F |
9.2 Kenya Core Plate Varnishes Market Opportunity Assessment, By Chemical Material, 2022 & 2032F |
9.3 Kenya Core Plate Varnishes Market Opportunity Assessment, By Type, 2022 & 2032F |
10 Kenya Core Plate Varnishes Market - Competitive Landscape |
10.1 Kenya Core Plate Varnishes Market Revenue Share, By Companies, 2025 |
10.2 Kenya Core Plate Varnishes Market Competitive Benchmarking, By Operating and Technical Parameters |
11 Company Profiles |
12 Recommendations |
13 Disclaimer |
Global Go To Market Strategy - 2030
Export potential enables firms to identify high-growth global markets with greater confidence by combining advanced trade intelligence with a structured quantitative methodology. The framework analyzes emerging demand trends and country-level import patterns while integrating macroeconomic and trade datasets such as GDP and population forecasts, bilateral import–export flows, tariff structures, elasticity differentials between developed and developing economies, geographic distance, and import demand projections. Using weighted trade values from 2020–2024 as the base period to project country-to-country export potential for 2030, these inputs are operationalized through calculated drivers such as gravity model parameters, tariff impact factors, and projected GDP per-capita growth. Through an analysis of hidden potentials, demand hotspots, and market conditions that are most favorable to success, this method enables firms to focus on target countries, maximize returns, and global expansion with data, backed by accuracy.
By factoring in the projected importer demand gap that is currently unmet and could be potential opportunity, it identifies the potential for the Exporter (Country) among 190 countries, against the general trade analysis, which identifies the biggest importer or exporter.
To discover high-growth global markets and optimize your business strategy:
Click Here
Pricing
- Single User License$ 1,995
- Department License$ 2,400
- Site License$ 3,120
- Global License$ 3,795

Leadership Perspectives from Industry Events
Search
Thought Leadership and Analyst Meet


Our Clients
6WResearch In News
- India Export Attractiveness Tracker 2026
- India Air Conditioner Market Set for Strong Rebound in 2026 After Weather-Led Correction and GST-Driven Recovery: 6Wresearch
- ADAS in India: How Automatic Emergency Braking, Blind Spot Detection & Driver Monitoring are Transforming Road Safety
- Doha a strategic location for EV manufacturing hub: IPA Qatar
- Demand for luxury TVs surging in the GCC, says Samsung
- Empowering Growth: The Thriving Journey of Bangladesh’s Cable Industry
Latest Reports
- Nicaragua RPG Gaming Market (2026-2032)
- New Zealand RPG Gaming Market (2026-2032)
- Netherlands RPG Gaming Market (2026-2032)
- Nauru RPG Gaming Market (2026-2032)
- Namibia RPG Gaming Market (2026-2032)
- Mozambique RPG Gaming Market (2026-2032)
- Montenegro RPG Gaming Market (2026-2032)
- Mongolia RPG Gaming Market (2026-2032)
- Monaco RPG Gaming Market (2026-2032)
- Micronesia RPG Gaming Market (2026-2032)
Industry Events and Analyst Meet

EV India Expo 2026

HIMTEX 2026

India Refining Summit 2026

India EV Show 2026

EV tech India Expo 2026
Whitepaper
- Middle East & Africa Commercial Security Market Click here to view more.
- Middle East & Africa Fire Safety Systems & Equipment Market Click here to view more.
- GCC Drone Market Click here to view more.
- Middle East Lighting Fixture Market Click here to view more.
- GCC Physical & Perimeter Security Market Click here to view more.