Kenya Crystal Lighting Market (2026-2032) | Share, Value, Forecast, Analysis, Revenue, Companies, Growth, Industry, Size, Outlook & Trends
Market Forecast By Product Type (Ceiling Crystal Lights, Crystal Chandeliers, Others), By Applications (Commercial, Designer, Superior Residential) And Competitive Landscape
| Product Code: ETC006310 | Publication Date: Sep 2020 | Updated Date: Jun 2026 | Product Type: Report | |
| Publisher: 6Wresearch | Author: Ravi Bhandari | No. of Pages: 70 | No. of Figures: 35 | No. of Tables: 5 |
Kenya Crystal Lighting Market Summary
The kenya crystal lighting market was estimated at USD 1452 Million in 2025 and is projected to reach USD 2109 Million by 2032, growing at a CAGR of 6.1% from 2026 to 2032.
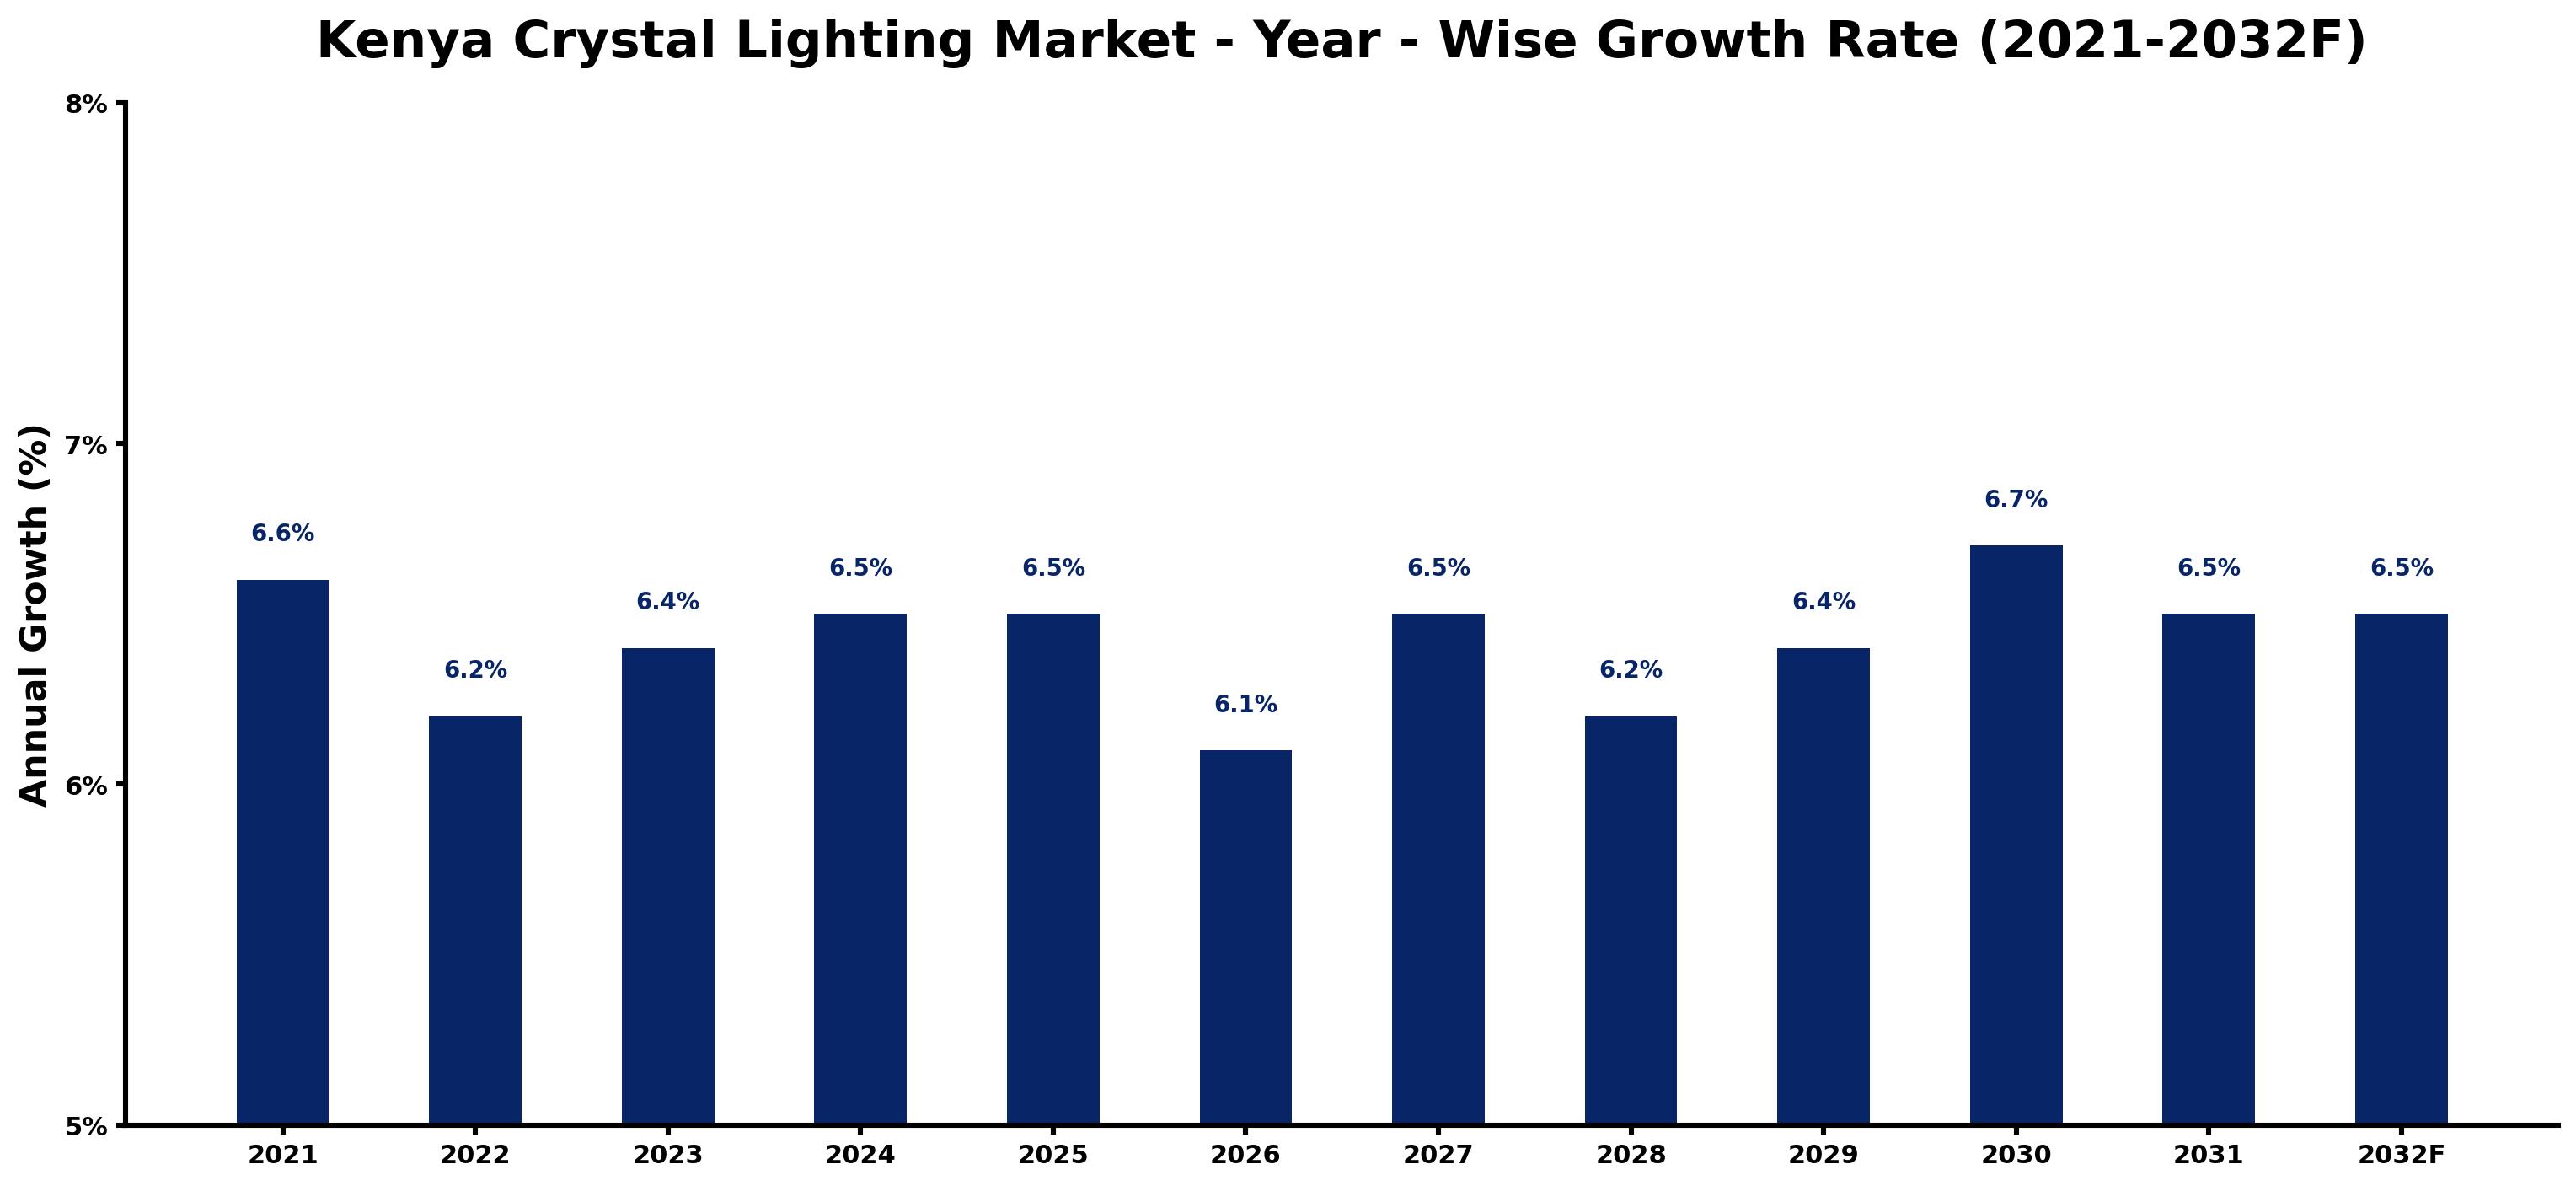
Kenya Crystal Lighting Market Growth Rate Analysis (2021-2032)
The Kenya Crystal Lighting market has experienced stable growth, with an annual increase of 6.6% in 2021 gradually stabilizing around 6.5% by 2024 and 2025. This growth can be attributed to rising consumer demand for aesthetically appealing lighting solutions, alongside increased investments in infrastructure development and urbanization. The decline to 6.1% in 2026 can largely be linked to economic fluctuations and shifts in consumer spending. However, a resurgence to 6.7% in 2030 indicates a rebound driven by new technological advancements and the ongoing energy transition, as consumers lean toward more sustainable and efficient lighting options. Overall, the market remains resilient, supported by innovation and evolving consumer preferences.
Kenya Crystal Lighting Market Year-wise Growth Rate and Key Drivers
This graph highlights how the Kenya Crystal Lighting Market has steadily grown over the past five years, supported by major growth factors.
The table below presents the year‑wise growth rates along with the key drivers influencing the market
| Year | Growth Rate | Major Drivers |
| 2021 | 6.6% | Post-pandemic recovery spurred investments in commercial and residential lighting projects. |
| 2022 | 6.2% | Urbanization trends led to increased demand for energy-efficient lighting solutions. |
| 2023 | 6.4% | Technological innovations improved local manufacturing capabilities for crystal lighting products. |
| 2024 | 6.5% | Infrastructural developments expanded access to electricity in rural communities. |
| 2025 | 6.5% | Consumer preferences shifted toward sustainable and aesthetically pleasing lighting options. |
| 2026 | 6.1% | Access to financing options enabled more households to acquire crystal lighting fixtures. |
| 2027 | 6.5% | Collaboration between local artisans and manufacturers enhanced product diversity in the market. |
| 2028 | 6.2% | Growing awareness of energy conservation drove interest in LED crystal lighting alternatives. |
| 2029 | 6.4% | High-profile events and exhibitions showcased the benefits of crystal lighting designs. |
| 2030 | 6.7% | Corporate social responsibility initiatives encouraged businesses to invest in eco-friendly lighting. |
| 2031 | 6.5% | Technological advancements in smart home systems integrated seamlessly with lighting solutions. |
| 2032 | 6.5% | A vibrant construction sector created a strong demand for upscale residential lighting. |
Note - Market size estimations and growth projections presented in this report are based on 6Wresearch's advanced forecasting approach, validated with industry datasets as of June 2026.
Key Highlights of the Report:
- Kenya Crystal Lighting Market Outlook
- Market Size of Kenya Crystal Lighting Market, 2025
- Forecast of Kenya Crystal Lighting Market, 2032F
- Historical Data and Forecast of Kenya Crystal Lighting Revenues & Volume for the Period 2022-2032F
- Kenya Crystal Lighting Market Trend Evolution
- Kenya Crystal Lighting Market Drivers and Challenges
- Kenya Crystal Lighting Price Trends
- Kenya Crystal Lighting Porter's Five Forces
- Kenya Crystal Lighting Industry Life Cycle
- Historical Data and Forecast of Kenya Crystal Lighting Market Revenues & Volume By Product Type for the Period 2022-2032F
- Historical Data and Forecast of Kenya Crystal Lighting Market Revenues & Volume By Ceiling Crystal Lights for the Period 2022-2032F
- Historical Data and Forecast of Kenya Crystal Lighting Market Revenues & Volume By Crystal Chandeliers for the Period 2022-2032F
- Historical Data and Forecast of Kenya Crystal Lighting Market Revenues & Volume By Others for the Period 2022-2032F
- Historical Data and Forecast of Kenya Crystal Lighting Market Revenues & Volume By Applications for the Period 2022-2032F
- Historical Data and Forecast of Kenya Crystal Lighting Market Revenues & Volume By Commercial for the Period 2022-2032F
- Historical Data and Forecast of Kenya Crystal Lighting Market Revenues & Volume By Designer for the Period 2022-2032F
- Historical Data and Forecast of Kenya Crystal Lighting Market Revenues & Volume By Superior Residential for the Period 2022-2032F
- Kenya Crystal Lighting Import Export Trade Statistics
- Market Opportunity Assessment By Product Type
- Market Opportunity Assessment By Applications
- Kenya Crystal Lighting Top Companies Market Share
- Kenya Crystal Lighting Competitive Benchmarking By Technical and Operational Parameters
- Kenya Crystal Lighting Company Profiles
- Kenya Crystal Lighting Key Strategic Recommendations
Frequently Asked Questions About the Market Study (FAQs):
6Wresearch actively monitors the Kenya Crystal Lighting Market and publishes its comprehensive annual report, highlighting emerging trends, growth drivers, revenue analysis, and forecast outlook. Our insights help businesses to make data-backed strategic decisions with ongoing market dynamics. Our analysts track relevent industries related to the Kenya Crystal Lighting Market, allowing our clients with actionable intelligence and reliable forecasts tailored to emerging regional needs.
Yes, we provide customisation as per your requirements. To learn more, feel free to contact us on sales@6wresearch.com
1 Executive Summary |
2 Introduction |
2.1 Key Highlights of the Report |
2.2 Report Description |
2.3 Market Scope & Segmentation |
2.4 Research Methodology |
2.5 Assumptions |
3 Kenya Crystal Lighting Market Overview |
3.1 Kenya Country Macro Economic Indicators |
3.2 Kenya Crystal Lighting Market Revenues & Volume, 2022 & 2032F |
3.3 Kenya Crystal Lighting Market - Industry Life Cycle |
3.4 Kenya Crystal Lighting Market - Porter's Five Forces |
3.5 Kenya Crystal Lighting Market Revenues & Volume Share, By Product Type, 2022 & 2032F |
3.6 Kenya Crystal Lighting Market Revenues & Volume Share, By Applications, 2022 & 2032F |
4 Kenya Crystal Lighting Market Dynamics |
4.1 Impact Analysis |
4.2 Market Drivers |
4.3 Market Restraints |
5 Kenya Crystal Lighting Market Trends |
6 Kenya Crystal Lighting Market, By Types |
6.1 Kenya Crystal Lighting Market, By Product Type |
6.1.1 Overview and Analysis |
6.1.2 Kenya Crystal Lighting Market Revenues & Volume, By Product Type, 2022 - 2032F |
6.1.3 Kenya Crystal Lighting Market Revenues & Volume, By Ceiling Crystal Lights, 2022 - 2032F |
6.1.4 Kenya Crystal Lighting Market Revenues & Volume, By Crystal Chandeliers, 2022 - 2032F |
6.1.5 Kenya Crystal Lighting Market Revenues & Volume, By Others, 2022 - 2032F |
6.2 Kenya Crystal Lighting Market, By Applications |
6.2.1 Overview and Analysis |
6.2.2 Kenya Crystal Lighting Market Revenues & Volume, By Commercial, 2022 - 2032F |
6.2.3 Kenya Crystal Lighting Market Revenues & Volume, By Designer, 2022 - 2032F |
6.2.4 Kenya Crystal Lighting Market Revenues & Volume, By Superior Residential, 2022 - 2032F |
7 Kenya Crystal Lighting Market Import-Export Trade Statistics |
7.1 Kenya Crystal Lighting Market Export to Major Countries |
7.2 Kenya Crystal Lighting Market Imports from Major Countries |
8 Kenya Crystal Lighting Market Key Performance Indicators |
9 Kenya Crystal Lighting Market - Opportunity Assessment |
9.1 Kenya Crystal Lighting Market Opportunity Assessment, By Product Type, 2022 & 2032F |
9.2 Kenya Crystal Lighting Market Opportunity Assessment, By Applications, 2022 & 2032F |
10 Kenya Crystal Lighting Market - Competitive Landscape |
10.1 Kenya Crystal Lighting Market Revenue Share, By Companies, 2025 |
10.2 Kenya Crystal Lighting Market Competitive Benchmarking, By Operating and Technical Parameters |
11 Company Profiles |
12 Recommendations |
13 Disclaimer |
Global Go To Market Strategy - 2030
Export potential enables firms to identify high-growth global markets with greater confidence by combining advanced trade intelligence with a structured quantitative methodology. The framework analyzes emerging demand trends and country-level import patterns while integrating macroeconomic and trade datasets such as GDP and population forecasts, bilateral import–export flows, tariff structures, elasticity differentials between developed and developing economies, geographic distance, and import demand projections. Using weighted trade values from 2020–2024 as the base period to project country-to-country export potential for 2030, these inputs are operationalized through calculated drivers such as gravity model parameters, tariff impact factors, and projected GDP per-capita growth. Through an analysis of hidden potentials, demand hotspots, and market conditions that are most favorable to success, this method enables firms to focus on target countries, maximize returns, and global expansion with data, backed by accuracy.
By factoring in the projected importer demand gap that is currently unmet and could be potential opportunity, it identifies the potential for the Exporter (Country) among 190 countries, against the general trade analysis, which identifies the biggest importer or exporter.
To discover high-growth global markets and optimize your business strategy:
Click Here
Pricing
- Single User License$ 1,995
- Department License$ 2,400
- Site License$ 3,120
- Global License$ 3,795

Leadership Perspectives from Industry Events
Search
Thought Leadership and Analyst Meet


Our Clients
6WResearch In News
- Doha a strategic location for EV manufacturing hub: IPA Qatar
- Demand for luxury TVs surging in the GCC, says Samsung
- Empowering Growth: The Thriving Journey of Bangladesh’s Cable Industry
- Demand for luxury TVs surging in the GCC, says Samsung
- Video call with a traditional healer? Once unthinkable, it’s now common in South Africa
- Intelligent Buildings To Smooth GCC’s Path To Net Zero
Latest Reports
- Taiwan Airport Wireless Infrastructure Market (2026-2032)
- Vietnam Airport Wireless Infrastructure Market (2026-2032)
- Thailand Airport Wireless Infrastructure Market (2026-2032)
- South Korea Airport Wireless Infrastructure Market (2026-2032)
- Romania Airport Wireless Infrastructure Market (2026-2032)
- Qatar Airport Wireless Infrastructure Market (2026-2032)
- Philippines Airport Wireless Infrastructure Market (2026-2032)
- Japan Airport Wireless Infrastructure Market (2026-2032)
- Taiwan Airport Winter Services Market (2026-2032)
- Vietnam Airport Winter Services Market (2026-2032)
Industry Events and Analyst Meet

HIMTEX 2026

India Refining Summit 2026

India EV Show 2026

EV tech India Expo 2026

Auto Tech Asia 2026
Whitepaper
- Middle East & Africa Commercial Security Market Click here to view more.
- Middle East & Africa Fire Safety Systems & Equipment Market Click here to view more.
- GCC Drone Market Click here to view more.
- Middle East Lighting Fixture Market Click here to view more.
- GCC Physical & Perimeter Security Market Click here to view more.