Lebanon Crystal Lighting Market (2026-2032) | Revenue, Forecast, Value, Companies, Industry, Growth, Size, Analysis, Trends, Outlook & Share
Market Forecast By Product Type (Ceiling Crystal Lights, Crystal Chandeliers, Others), By Applications (Commercial, Designer, Superior Residential) And Competitive Landscape
| Product Code: ETC006307 | Publication Date: Sep 2020 | Updated Date: Jun 2026 | Product Type: Report | |
| Publisher: 6Wresearch | Author: Ravi Bhandari | No. of Pages: 70 | No. of Figures: 35 | No. of Tables: 5 |
Lebanon Crystal Lighting Market Summary
The lebanon crystal lighting market was estimated at USD 435 Million in 2025 and is projected to reach USD 601 Million by 2032, growing at a CAGR of 5.2% from 2026 to 2032.
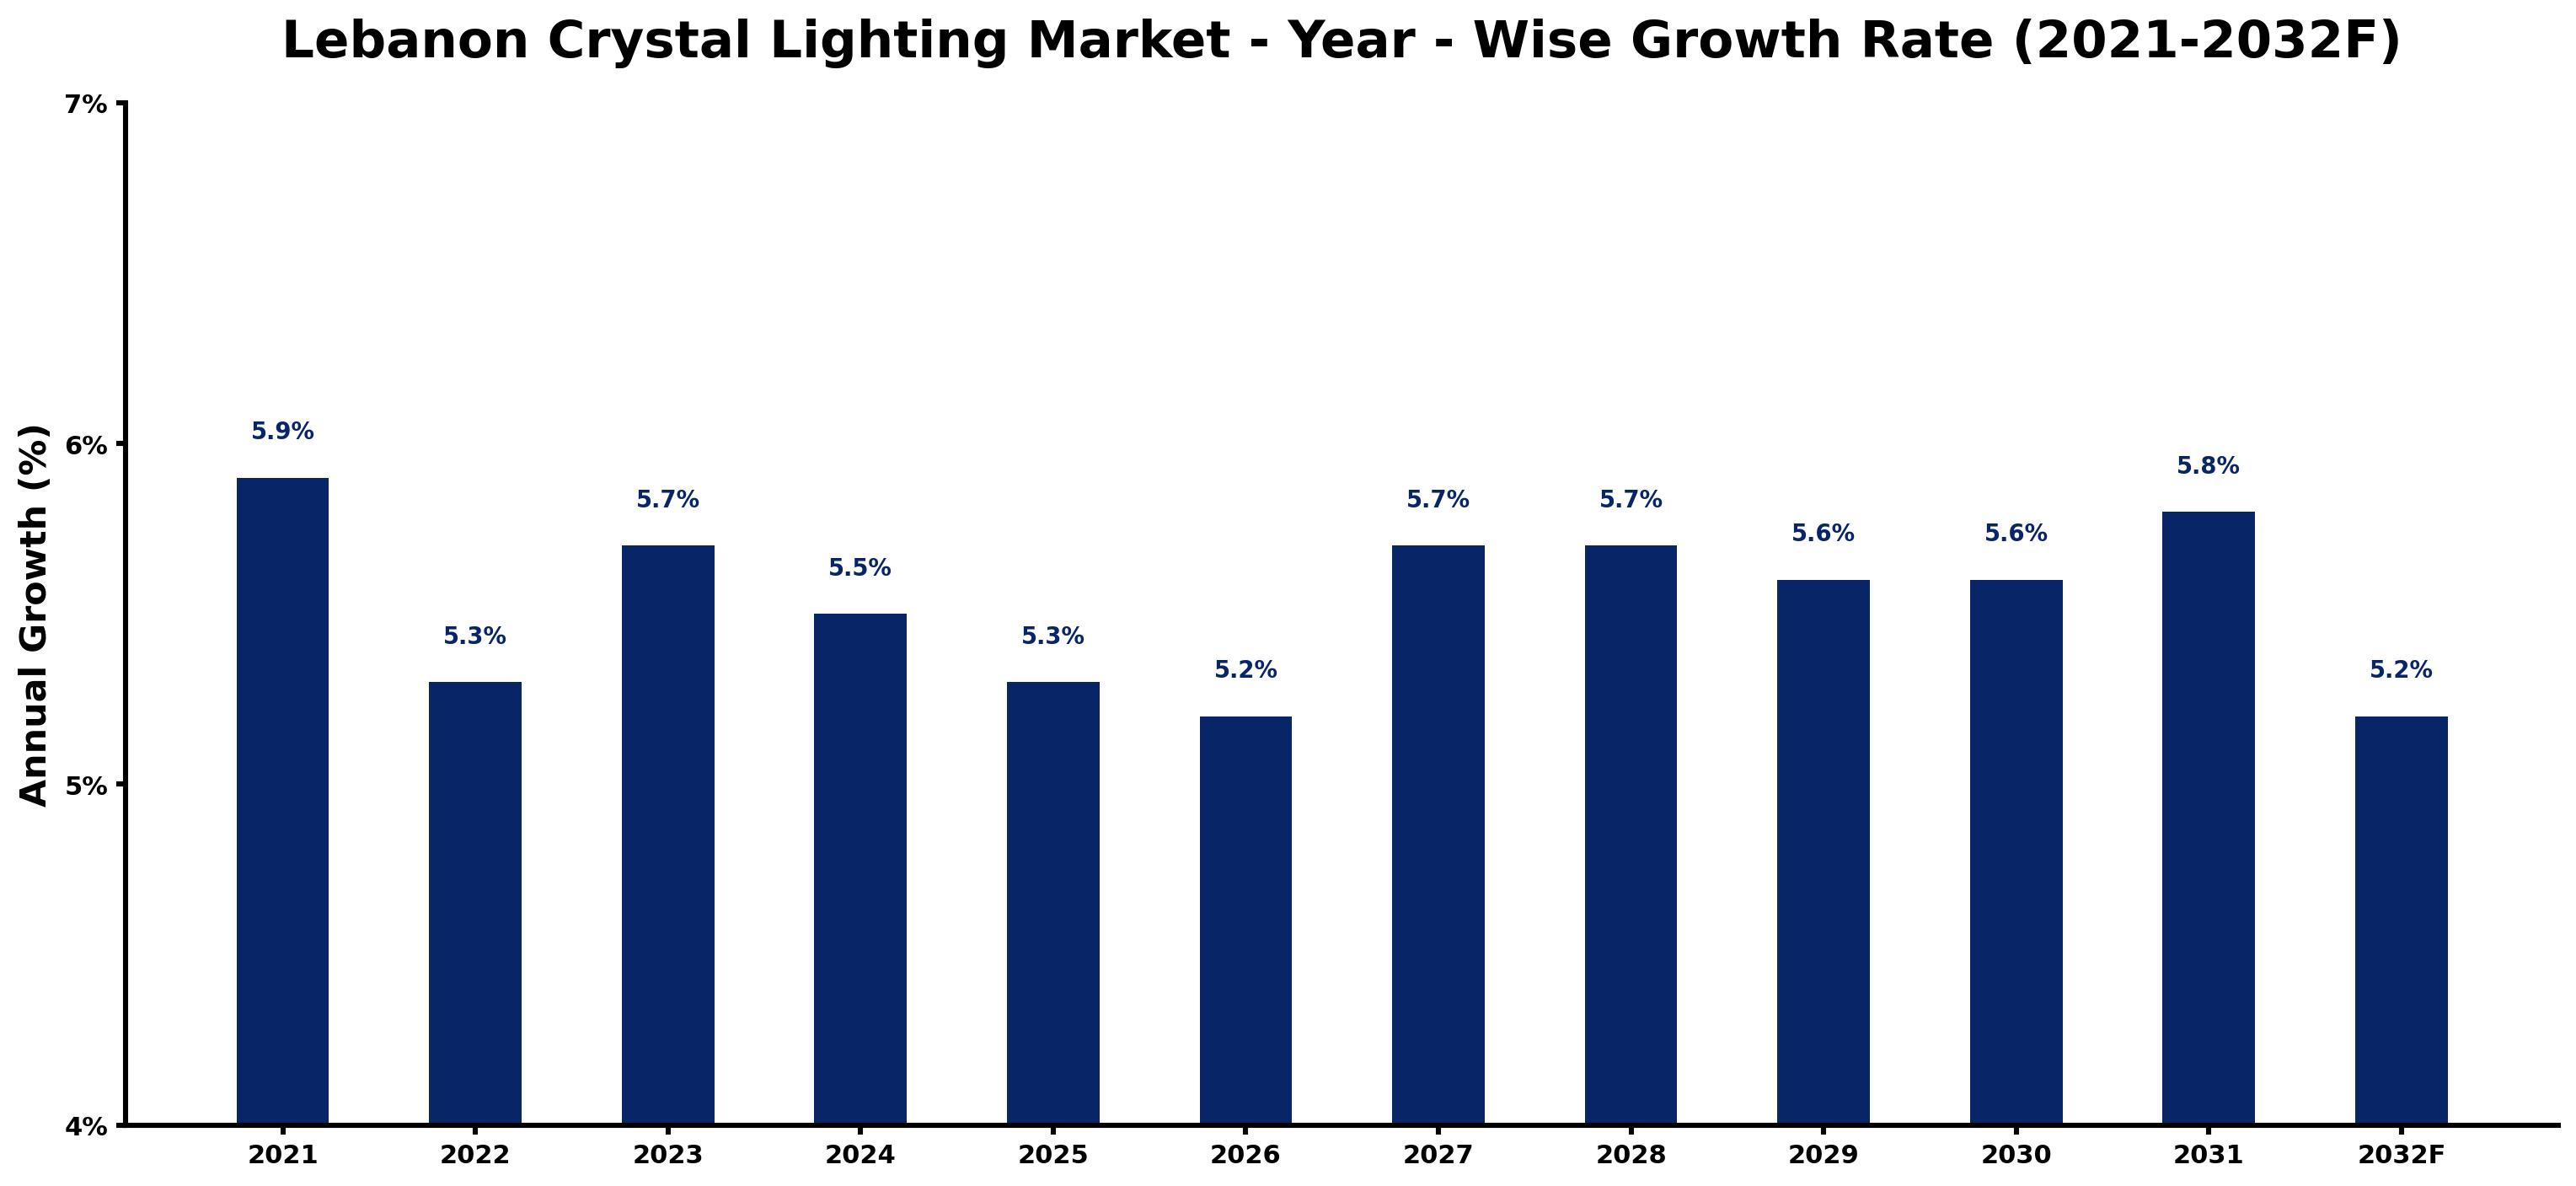
Lebanon Crystal Lighting Market Growth Rate Analysis (2021-2032)
The Lebanon crystal lighting market has showcased stable growth over the past few years, with yearly increases such as 5.9% in 2021 and a slight dip to 5.3% in 2022. This fluctuation can be attributed to shifting consumer preferences and economic challenges. However, a resurgence was noted in 2023 with growth re-stabilizing at 5.7%, driven by rising consumer demand for luxury aesthetic products and increased investments in home decor. From 2024 to 2026, the market maintained consistent growth around 5.5% to 5.3%, as infrastructure developments and digitalization efforts enhanced retail access. A notable uptick to 5.8% in 2031 suggests a renewed consumer interest, while shifts in energy policies appear to favor sustainable lighting solutions moving forward.
Lebanon Crystal Lighting Market Year-wise Growth Rate and Key Drivers
This graph highlights how the Lebanon Crystal Lighting Market has steadily grown over the past five years, supported by major growth factors.
The table below presents the year wise growth rates along with the key drivers influencing the market
| Year | Growth Rate | Major Drivers |
| 2021 | 5.9% | Post-lockdown retail projects triggered increased spending on decorative lighting solutions. |
| 2022 | 5.3% | Local artisans began integrating traditional designs into modern crystal lighting fixtures. |
| 2023 | 5.7% | Rising tourism in Lebanon encouraged hotels to enhance their interior lighting aesthetics. |
| 2024 | 5.5% | Economic recovery led to a surge in residential renovation and refurbishment projects. |
| 2025 | 5.3% | Emerging boutique hotels focused on unique lighting to attract upscale clientele. |
| 2026 | 5.2% | Technological innovations introduced energy-efficient crystal lighting options to market. |
| 2027 | 5.7% | Architectural trends favored dramatic lighting installations in commercial developments. |
| 2028 | 5.7% | Increased consumer awareness about sustainable products influenced purchasing decisions significantly. |
| 2029 | 5.6% | Collaboration between local brands and international designers expanded product diversity significantly. |
| 2030 | 5.6% | Luxury home sales correlated with enhanced lighting solutions tailored for high-end markets. |
| 2031 | 5.8% | Online retail platforms captured a larger share of the crystal lighting sales market. |
| 2032 | 5.2% | Urban development projects prioritized aesthetic lighting to enhance city landscapes and experiences. |
Note - Market size estimations and growth projections presented in this report are based on 6Wresearch's advanced forecasting approach, validated with industry datasets as of June 2026.
Key Highlights of the Report:
- Lebanon Crystal Lighting Market Outlook
- Market Size of Lebanon Crystal Lighting Market, 2025
- Forecast of Lebanon Crystal Lighting Market, 2032F
- Historical Data and Forecast of Lebanon Crystal Lighting Revenues & Volume for the Period 2022-2032F
- Lebanon Crystal Lighting Market Trend Evolution
- Lebanon Crystal Lighting Market Drivers and Challenges
- Lebanon Crystal Lighting Price Trends
- Lebanon Crystal Lighting Porter's Five Forces
- Lebanon Crystal Lighting Industry Life Cycle
- Historical Data and Forecast of Lebanon Crystal Lighting Market Revenues & Volume By Product Type for the Period 2022-2032F
- Historical Data and Forecast of Lebanon Crystal Lighting Market Revenues & Volume By Ceiling Crystal Lights for the Period 2022-2032F
- Historical Data and Forecast of Lebanon Crystal Lighting Market Revenues & Volume By Crystal Chandeliers for the Period 2022-2032F
- Historical Data and Forecast of Lebanon Crystal Lighting Market Revenues & Volume By Others for the Period 2022-2032F
- Historical Data and Forecast of Lebanon Crystal Lighting Market Revenues & Volume By Applications for the Period 2022-2032F
- Historical Data and Forecast of Lebanon Crystal Lighting Market Revenues & Volume By Commercial for the Period 2022-2032F
- Historical Data and Forecast of Lebanon Crystal Lighting Market Revenues & Volume By Designer for the Period 2022-2032F
- Historical Data and Forecast of Lebanon Crystal Lighting Market Revenues & Volume By Superior Residential for the Period 2022-2032F
- Lebanon Crystal Lighting Import Export Trade Statistics
- Market Opportunity Assessment By Product Type
- Market Opportunity Assessment By Applications
- Lebanon Crystal Lighting Top Companies Market Share
- Lebanon Crystal Lighting Competitive Benchmarking By Technical and Operational Parameters
- Lebanon Crystal Lighting Company Profiles
- Lebanon Crystal Lighting Key Strategic Recommendations
Frequently Asked Questions About the Market Study (FAQs):
6Wresearch actively monitors the Lebanon Crystal Lighting Market and publishes its comprehensive annual report, highlighting emerging trends, growth drivers, revenue analysis, and forecast outlook. Our insights help businesses to make data-backed strategic decisions with ongoing market dynamics. Our analysts track relevent industries related to the Lebanon Crystal Lighting Market, allowing our clients with actionable intelligence and reliable forecasts tailored to emerging regional needs.
Yes, we provide customisation as per your requirements. To learn more, feel free to contact us on sales@6wresearch.com
1 Executive Summary |
2 Introduction |
2.1 Key Highlights of the Report |
2.2 Report Description |
2.3 Market Scope & Segmentation |
2.4 Research Methodology |
2.5 Assumptions |
3 Lebanon Crystal Lighting Market Overview |
3.1 Lebanon Country Macro Economic Indicators |
3.2 Lebanon Crystal Lighting Market Revenues & Volume, 2022 & 2032F |
3.3 Lebanon Crystal Lighting Market - Industry Life Cycle |
3.4 Lebanon Crystal Lighting Market - Porter's Five Forces |
3.5 Lebanon Crystal Lighting Market Revenues & Volume Share, By Product Type, 2022 & 2032F |
3.6 Lebanon Crystal Lighting Market Revenues & Volume Share, By Applications, 2022 & 2032F |
4 Lebanon Crystal Lighting Market Dynamics |
4.1 Impact Analysis |
4.2 Market Drivers |
4.3 Market Restraints |
5 Lebanon Crystal Lighting Market Trends |
6 Lebanon Crystal Lighting Market, By Types |
6.1 Lebanon Crystal Lighting Market, By Product Type |
6.1.1 Overview and Analysis |
6.1.2 Lebanon Crystal Lighting Market Revenues & Volume, By Product Type, 2022 - 2032F |
6.1.3 Lebanon Crystal Lighting Market Revenues & Volume, By Ceiling Crystal Lights, 2022 - 2032F |
6.1.4 Lebanon Crystal Lighting Market Revenues & Volume, By Crystal Chandeliers, 2022 - 2032F |
6.1.5 Lebanon Crystal Lighting Market Revenues & Volume, By Others, 2022 - 2032F |
6.2 Lebanon Crystal Lighting Market, By Applications |
6.2.1 Overview and Analysis |
6.2.2 Lebanon Crystal Lighting Market Revenues & Volume, By Commercial, 2022 - 2032F |
6.2.3 Lebanon Crystal Lighting Market Revenues & Volume, By Designer, 2022 - 2032F |
6.2.4 Lebanon Crystal Lighting Market Revenues & Volume, By Superior Residential, 2022 - 2032F |
7 Lebanon Crystal Lighting Market Import-Export Trade Statistics |
7.1 Lebanon Crystal Lighting Market Export to Major Countries |
7.2 Lebanon Crystal Lighting Market Imports from Major Countries |
8 Lebanon Crystal Lighting Market Key Performance Indicators |
9 Lebanon Crystal Lighting Market - Opportunity Assessment |
9.1 Lebanon Crystal Lighting Market Opportunity Assessment, By Product Type, 2022 & 2032F |
9.2 Lebanon Crystal Lighting Market Opportunity Assessment, By Applications, 2022 & 2032F |
10 Lebanon Crystal Lighting Market - Competitive Landscape |
10.1 Lebanon Crystal Lighting Market Revenue Share, By Companies, 2025 |
10.2 Lebanon Crystal Lighting Market Competitive Benchmarking, By Operating and Technical Parameters |
11 Company Profiles |
12 Recommendations |
13 Disclaimer |
Global Go To Market Strategy - 2030
Export potential enables firms to identify high-growth global markets with greater confidence by combining advanced trade intelligence with a structured quantitative methodology. The framework analyzes emerging demand trends and country-level import patterns while integrating macroeconomic and trade datasets such as GDP and population forecasts, bilateral import–export flows, tariff structures, elasticity differentials between developed and developing economies, geographic distance, and import demand projections. Using weighted trade values from 2020–2024 as the base period to project country-to-country export potential for 2030, these inputs are operationalized through calculated drivers such as gravity model parameters, tariff impact factors, and projected GDP per-capita growth. Through an analysis of hidden potentials, demand hotspots, and market conditions that are most favorable to success, this method enables firms to focus on target countries, maximize returns, and global expansion with data, backed by accuracy.
By factoring in the projected importer demand gap that is currently unmet and could be potential opportunity, it identifies the potential for the Exporter (Country) among 190 countries, against the general trade analysis, which identifies the biggest importer or exporter.
To discover high-growth global markets and optimize your business strategy:
Click Here
Pricing
- Single User License$ 1,995
- Department License$ 2,400
- Site License$ 3,120
- Global License$ 3,795

Leadership Perspectives from Industry Events
Search
Thought Leadership and Analyst Meet


Our Clients
6WResearch In News
- India Air Conditioner Market Set for Strong Rebound in 2026 After Weather-Led Correction and GST-Driven Recovery: 6Wresearch
- ADAS in India: How Automatic Emergency Braking, Blind Spot Detection & Driver Monitoring are Transforming Road Safety
- Doha a strategic location for EV manufacturing hub: IPA Qatar
- Demand for luxury TVs surging in the GCC, says Samsung
- Empowering Growth: The Thriving Journey of Bangladesh’s Cable Industry
- Demand for luxury TVs surging in the GCC, says Samsung
Latest Reports
- Nicaragua RPG Gaming Market (2026-2032)
- New Zealand RPG Gaming Market (2026-2032)
- Netherlands RPG Gaming Market (2026-2032)
- Nauru RPG Gaming Market (2026-2032)
- Namibia RPG Gaming Market (2026-2032)
- Mozambique RPG Gaming Market (2026-2032)
- Montenegro RPG Gaming Market (2026-2032)
- Mongolia RPG Gaming Market (2026-2032)
- Monaco RPG Gaming Market (2026-2032)
- Micronesia RPG Gaming Market (2026-2032)
Industry Events and Analyst Meet

HIMTEX 2026

India Refining Summit 2026

India EV Show 2026

EV tech India Expo 2026

Auto Tech Asia 2026
Whitepaper
- Middle East & Africa Commercial Security Market Click here to view more.
- Middle East & Africa Fire Safety Systems & Equipment Market Click here to view more.
- GCC Drone Market Click here to view more.
- Middle East Lighting Fixture Market Click here to view more.
- GCC Physical & Perimeter Security Market Click here to view more.