Kenya Fin Fish Market (2026-2032) | Size, Trends, Industry, Outlook, Forecast, Value, Revenue, Companies, Analysis, Share & Growth
Market Forecast By Environment (Freshwater, Marine Water, Brackish Water), By Fish Type (Pompano, Snappers, Groupers, Salmon, Milkfish, Tuna, Catfish, Others) And Competitive Landscape
| Product Code: ETC038851 | Publication Date: Jan 2021 | Updated Date: Jun 2026 | Product Type: Report | |
| Publisher: 6Wresearch | Author: Vasudha | No. of Pages: 70 | No. of Figures: 35 | No. of Tables: 5 |
Kenya Fin Fish Market Summary
The kenya fin fish market was estimated at USD 489 Million in 2025 and is projected to reach USD 690 Million by 2032, growing at a CAGR of 6.2% from 2026 to 2032.
Kenya Fin Fish Market Growth Rate Analysis (2021-2032)
The Kenya Fin Fish market has exhibited a stable growth pattern, with annual increases hovering around 6% from 2021 through 2023, reflecting a steady rise in consumer demand and improved fishing practices. Notably, growth was 6.2% in 2021, supported by rising disposable incomes and a growing focus on protein-rich diets. A slight decline to 5.6% in 2024 can be attributed to regulatory adjustments affecting fishing quotas, but demand rebounded with a 6.1% growth in 2025 due to enhanced aquaculture technologies and investments in sustainable fishing methods. While fluctuations in growth rates, such as the drop to 5.7% in 2027, indicate market maturity, the continued focus on infrastructure and digitalization in supply chains promises a resilient market landscape through 2032.
Kenya Fin Fish Market Year-wise Growth Rate and Key Drivers
This graph highlights how the Kenya Fin Fish Market has steadily grown over the past five years, supported by major growth factors.
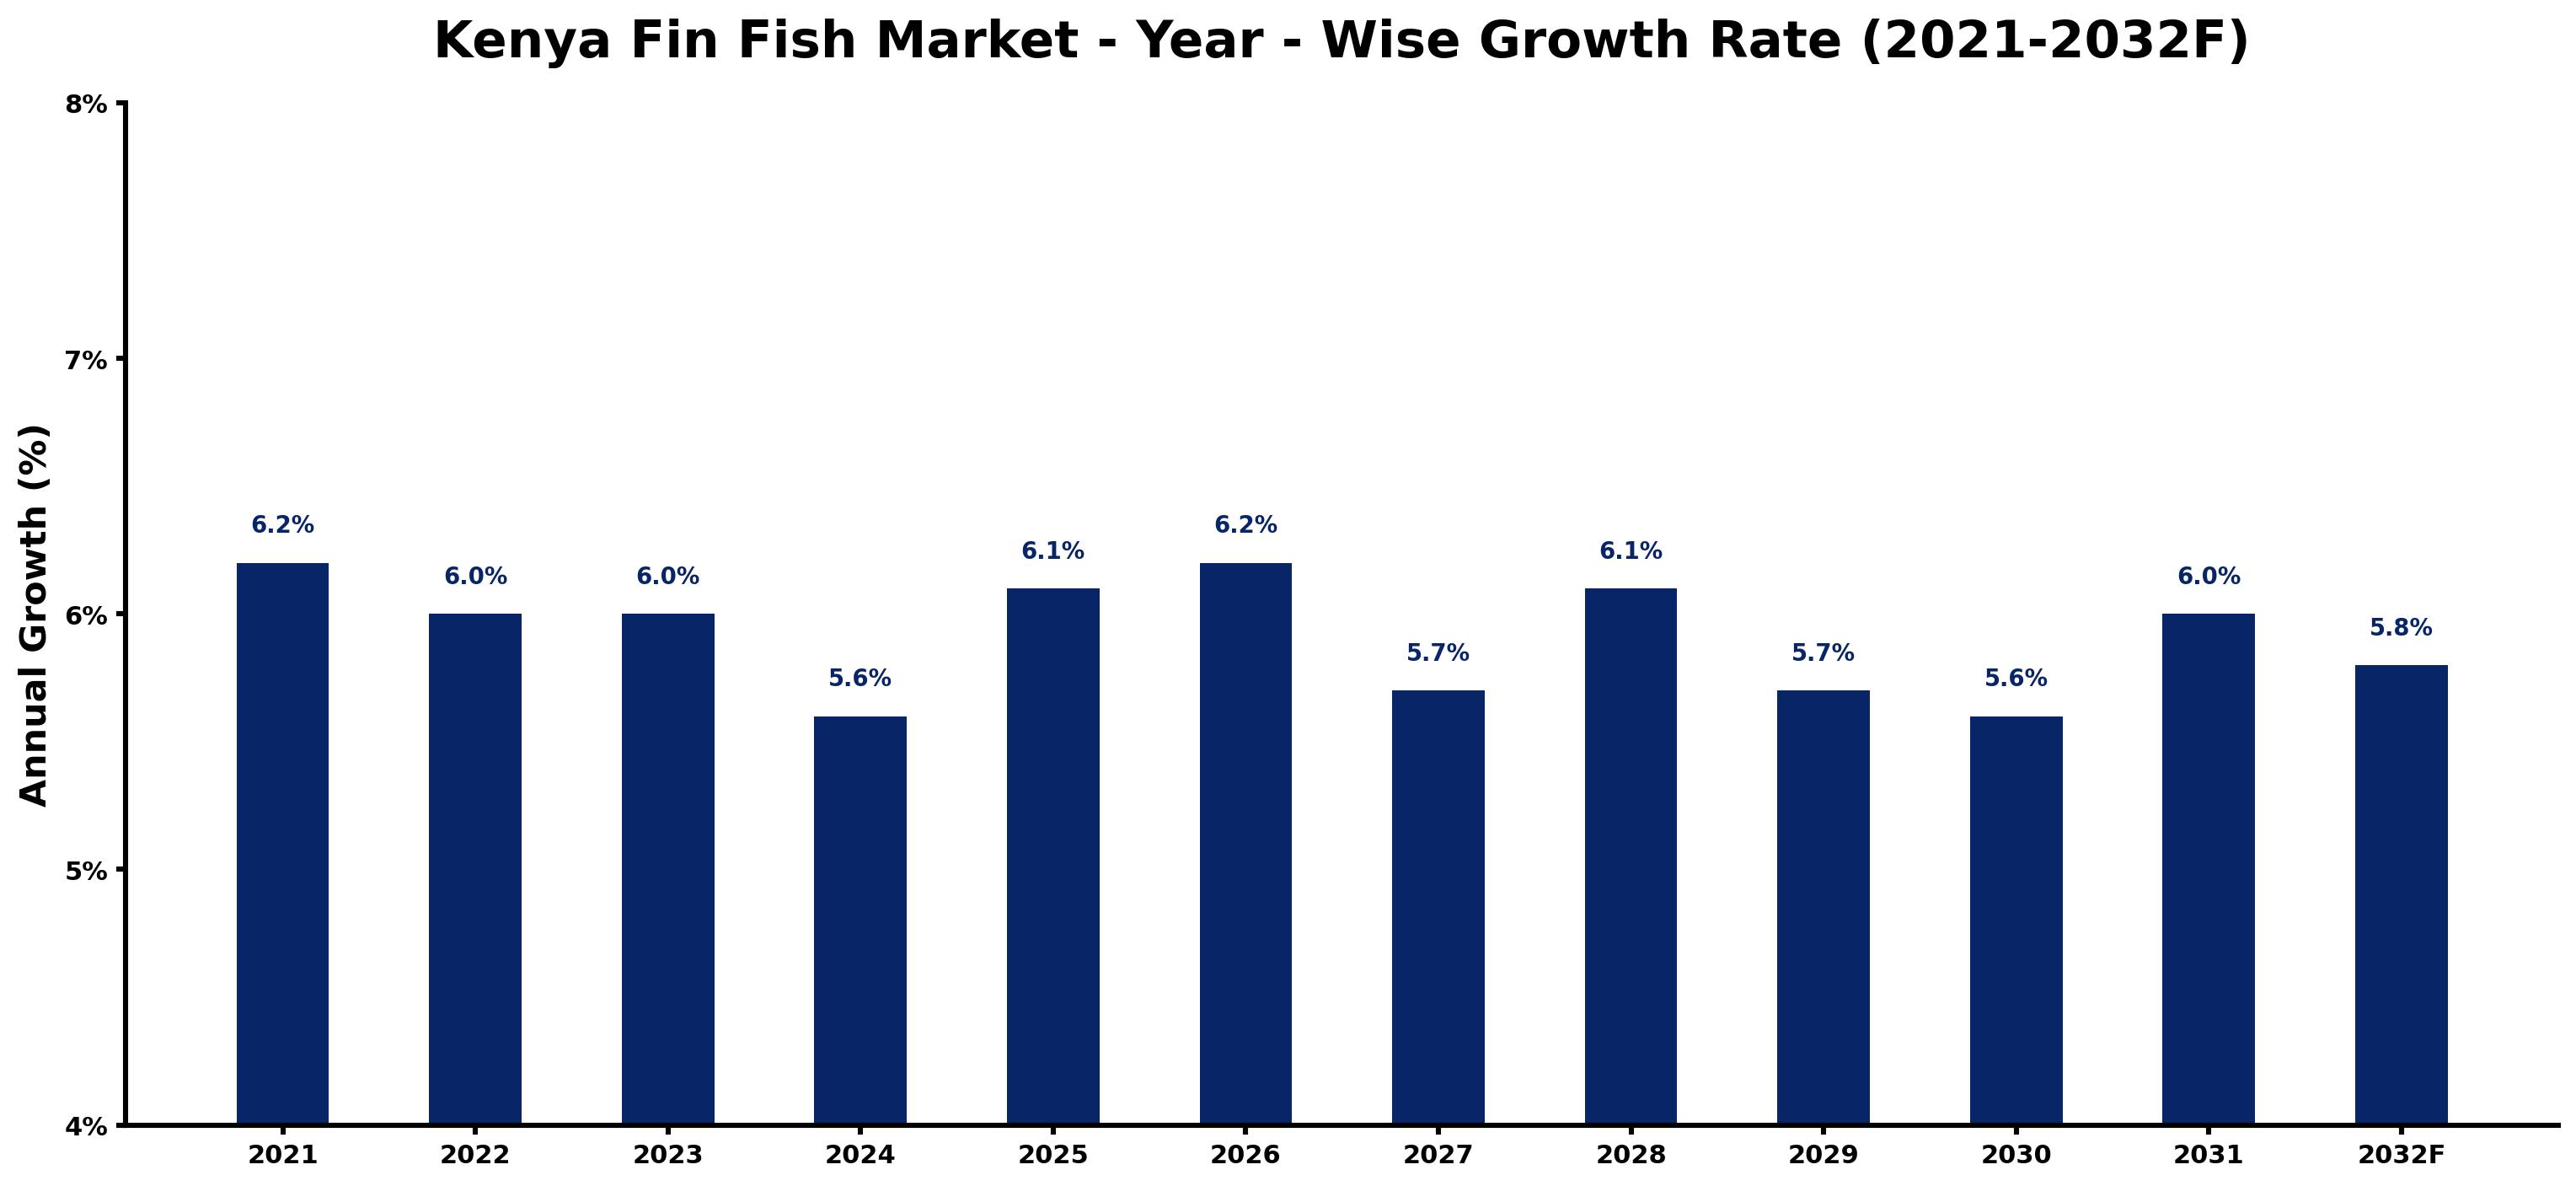
The table below presents the year‑wise growth rates along with the key drivers influencing the market
| Year | Growth Rate | Major Drivers |
| 2021 | 6.2% | A surge in local demand for fresh fish products supported market expansion efforts. |
| 2022 | 6.0% | Emerging aquaculture practices started to enhance fish production sustainability across Kenya. |
| 2023 | 6.0% | Increasing consumer awareness regarding health benefits of fish contributed to market interest. |
| 2024 | 5.6% | Investments in cold chain logistics improved fish distribution efficiency and reduced spoilage. |
| 2025 | 6.1% | Partnerships between local fishermen and distributors strengthened supply chain reliability significantly. |
| 2026 | 6.2% | Growing urban populations began shifting dietary preferences towards protein-rich fish options. |
| 2027 | 5.7% | Export opportunities to regional markets opened new revenue streams for local fishers. |
| 2028 | 6.1% | Innovative fish farming technologies emerged, improving yield and reducing operational costs. |
| 2029 | 5.7% | Community-based fish farming initiatives gained momentum, empowering local economies and livelihoods. |
| 2030 | 5.6% | Environmental sustainability practices became essential, attracting eco-conscious consumers and investors. |
| 2031 | 6.0% | Consumer preferences increasingly favored organic and sustainably sourced fish products in retail. |
| 2032 | 5.8% | Digital platforms for fish sales connected consumers directly with local fishers and products. |
Note - Market size estimations and growth projections presented in this report are based on 6Wresearch’s advanced forecasting approach, validated with industry datasets as of June 2026.
Kenya Fin Fish Market Synopsis
The Kenya Fin Fish Market is projected to reach 5.8% and witness significant growth during the forecast period (2026-2032). This market is characterized by robust demand for a variety of fish products, spurred by the country's rich coastal regions and numerous inland water systems. Tilapia, Nile perch, and tuna are among the most sought-after species, reflecting the culinary preferences of the Kenyan population. The market operates through a combination of artisanal and commercial fishing activities alongside a burgeoning aquaculture sector, which is crucial in meeting local consumption needs and export potential.
Kenya Fin Fish Market Growth Drivers
The growth of the Kenya Fin Fish Market is influenced by several key drivers:
- The increasing population in Kenya is leading to a heightened demand for protein-rich food sources, particularly fresh fish, which is considered both nutritious and healthy.
- Consumer preferences are shifting towards locally sourced products, enhancing the importance of regional fish species like tilapia and Nile perch in the local diet.
- Advancements in aquaculture practices have significantly boosted fish production, allowing for more sustainable and year-round supply of key species.
- The rise of urbanization has facilitated the growth of fish markets in cities, creating more accessible points of sale for consumers.
- Government initiatives aimed at promoting sustainable fishing practices are helping to secure both fish stocks and the broader ecosystem, thus supporting long-term market viability.
Kenya Fin Fish Market Trends and Opportunities
The landscape of the Kenya Fin Fish Market is evolving with the emergence of notable trends:
- A growing inclination toward value-added fish products, including fillets, smoked fish, and ready-to-cook fish burgers, is reshaping consumer purchasing habits.
- Technological integration in fish farming, such as the use of advanced aquaculture systems and monitoring tools, enhances productivity and sustainability.
- Increased awareness of the health benefits associated with fish consumption is motivating consumers to incorporate seafood into their diets more regularly.
- The expansion of e-commerce platforms is facilitating easier access to fresh fish products, catering to urban populations and busy consumers.
- Collaborative initiatives between local farmers and investors are paving the way for improved production methods, thereby enhancing market efficiency and output quality.
Kenya Fin Fish Market Challenges and Restraints
Despite promising growth, the Kenya Fin Fish Market faces several challenges that could impede its development:
- Inadequate cold storage and transportation infrastructure results in considerable post-harvest losses, affecting the profitability of fish harvesting and distribution.
- High production costs and limited access to financing can deter new entrants from investing in fish farming or processing ventures.
- Inconsistent government regulations may create uncertainty, making it difficult for producers to plan long-term investments.
- The lack of advanced technical skills and training among fish farmers limits the overall productivity and quality of fish harvested.
- Market access remains constrained for many farmers, leading to difficulties in reaching a wider customer base and maximizing sales potential.
Kenya Fin Fish Market Investment Opportunities
Investment opportunities in the Kenya Fin Fish Market are multifaceted and attractive:
- The ongoing expansion of aquaculture, particularly in tilapia farming, presents a viable option for investors looking to tap into the increasing domestic demand for fish.
- Value-added processing initiatives, such as the production of smoked fish and fish fillets, are generating interest due to their potential for higher profit margins.
- Opportunities exist for the development of innovative fish feed, crucial for enhancing aquaculture yields and addressing food security challenges.
- Public-private partnerships could be leveraged to upgrade infrastructure for cold chain logistics, improving the overall efficiency of fish distribution.
- Integrating technology in fish farming operations can elevate production standards, offering lucrative avenues for investors focused on modernization and sustainability.
Kenya Fin Fish Market Government Investment and Initiatives
The government of Kenya plays a pivotal role in shaping the fin fish market through various policies and initiatives:
- Regulatory frameworks are in place to oversee fishing quotas and gear restrictions, aimed at promoting sustainable fishing practices that protect marine biodiversity.
- Quality control measures are enforced across fish processing and distribution channels, ensuring high standards of hygiene and safety for consumers.
- Government investment in fisherfolk support programs includes training initiatives to improve practices in small-scale fishing and aquaculture.
- Financial incentives are offered to encourage local fish consumption, thereby fostering livelihoods among communities reliant on fishing.
- Collaborative efforts with international organizations aim to combat illegal fishing activities, enhancing the capacity for effective resource management and conservation.
Kenya Fin Fish Market Latest Developments (May 2025 - June 2026)
Recent developments within the Kenya Fin Fish Market signal a proactive shift towards modernization and sustainability:
- Innovative aquaculture techniques are being adopted, with farmers increasingly utilizing biofloc technology to enhance fish growth rates and reduce environmental impact.
- There has been a notable increase in training workshops targeting small-scale fish farmers, emphasizing best practices in sustainable fishing and processing.
- New policies aimed at reducing post-harvest losses are being implemented, focusing on improving cold chain logistics and storage solutions.
- The growth of online fish marketplaces has enabled consumers to access fresh fish more conveniently, reflecting a shift towards digital commerce in the sector.
- Public awareness campaigns are highlighting the health benefits of fish consumption, fostering a culture of seafood inclusion in everyday diets.
Kenya Fin Fish Market - Key Attractiveness of the Report
- 10 Years of Market Numbers
- Historical Data Starting from 2022 to 2025
- Base Year: 2025
- Forecast Data until 2032
- Key Performance Indicators Impacting the Market
- Major Upcoming Developments and Projects
Key Highlights of the Report:
- Kenya Fin Fish Market Outlook
- Market Size of Kenya Fin Fish Market, 2025
- Forecast of Kenya Fin Fish Market, 2032F
- Historical Data and Forecast of Kenya Fin Fish Revenues & Volume for the Period 2022-2032F
- Kenya Fin Fish Market Trend Evolution
- Kenya Fin Fish Market Drivers and Challenges
- Kenya Fin Fish Price Trends
- Kenya Fin Fish Porter's Five Forces
- Kenya Fin Fish Industry Life Cycle
- Historical Data and Forecast of Kenya Fin Fish Market Revenues & Volume By Environment for the Period 2022-2032F
- Historical Data and Forecast of Kenya Fin Fish Market Revenues & Volume By Freshwater for the Period 2022-2032F
- Historical Data and Forecast of Kenya Fin Fish Market Revenues & Volume By Marine Water for the Period 2022-2032F
- Historical Data and Forecast of Kenya Fin Fish Market Revenues & Volume By Brackish Water for the Period 2022-2032F
- Historical Data and Forecast of Kenya Fin Fish Market Revenues & Volume By Fish Type for the Period 2022-2032F
- Historical Data and Forecast of Kenya Fin Fish Market Revenues & Volume By Pompano for the Period 2022-2032F
- Historical Data and Forecast of Kenya Fin Fish Market Revenues & Volume By Snappers for the Period 2022-2032F
- Historical Data and Forecast of Kenya Fin Fish Market Revenues & Volume By Groupers for the Period 2022-2032F
- Historical Data and Forecast of Kenya Fin Fish Market Revenues & Volume By Salmon for the Period 2022-2032F
- Historical Data and Forecast of Kenya Fin Fish Market Revenues & Volume By Milkfish for the Period 2022-2032F
- Historical Data and Forecast of Kenya Fin Fish Market Revenues & Volume By Tuna for the Period 2022-2032F
- Historical Data and Forecast of Kenya Fin Fish Market Revenues & Volume By Catfish for the Period 2022-2032F
- Historical Data and Forecast of Kenya Fin Fish Market Revenues & Volume By Others for the Period 2022-2032F
- Kenya Fin Fish Import Export Trade Statistics
- Market Opportunity Assessment By Environment
- Market Opportunity Assessment By Fish Type
- Kenya Fin Fish Top Companies Market Share
- Kenya Fin Fish Competitive Benchmarking By Technical and Operational Parameters
- Kenya Fin Fish Company Profiles
- Kenya Fin Fish Key Strategic Recommendations
Frequently Asked Questions About the Market Study (FAQs):
The primary drivers include a rising population, increasing consumer preferences for locally sourced seafood, and advancements in aquaculture techniques.
Fish farmers encounter issues such as inadequate infrastructure, high production costs, and limited access to training and financing.
Investors can explore opportunities in aquaculture, value-added processing, and technology integration to enhance profitability.
The government implements regulations to ensure sustainable practices, invests in fisherfolk support, and promotes local consumption of fish products.
6Wresearch actively monitors the Kenya Fin Fish Market and publishes its comprehensive annual report, highlighting emerging trends, growth drivers, revenue analysis, and forecast outlook. Our insights help businesses to make data-backed strategic decisions with ongoing market dynamics. Our analysts track relevent industries related to the Kenya Fin Fish Market, allowing our clients with actionable intelligence and reliable forecasts tailored to emerging regional needs.
Yes, we provide customisation as per your requirements. To learn more, feel free to contact us on sales@6wresearch.com
1 Executive Summary |
2 Introduction |
2.1 Key Highlights of the Report |
2.2 Report Description |
2.3 Market Scope & Segmentation |
2.4 Research Methodology |
2.5 Assumptions |
3 Kenya Fin Fish Market Overview |
3.1 Kenya Country Macro Economic Indicators |
3.2 Kenya Fin Fish Market Revenues & Volume, 2022 & 2032F |
3.3 Kenya Fin Fish Market - Industry Life Cycle |
3.4 Kenya Fin Fish Market - Porter's Five Forces |
3.5 Kenya Fin Fish Market Revenues & Volume Share, By Environment, 2022 & 2032F |
3.6 Kenya Fin Fish Market Revenues & Volume Share, By Fish Type, 2022 & 2032F |
4 Kenya Fin Fish Market Dynamics |
4.1 Impact Analysis |
4.2 Market Drivers |
4.3 Market Restraints |
5 Kenya Fin Fish Market Trends |
6 Kenya Fin Fish Market, By Types |
6.1 Kenya Fin Fish Market, By Environment |
6.1.1 Overview and Analysis |
6.1.2 Kenya Fin Fish Market Revenues & Volume, By Environment, 2022-2032F |
6.1.3 Kenya Fin Fish Market Revenues & Volume, By Freshwater, 2022-2032F |
6.1.4 Kenya Fin Fish Market Revenues & Volume, By Marine Water, 2022-2032F |
6.1.5 Kenya Fin Fish Market Revenues & Volume, By Brackish Water, 2022-2032F |
6.2 Kenya Fin Fish Market, By Fish Type |
6.2.1 Overview and Analysis |
6.2.2 Kenya Fin Fish Market Revenues & Volume, By Pompano, 2022-2032F |
6.2.3 Kenya Fin Fish Market Revenues & Volume, By Snappers, 2022-2032F |
6.2.4 Kenya Fin Fish Market Revenues & Volume, By Groupers, 2022-2032F |
6.2.5 Kenya Fin Fish Market Revenues & Volume, By Salmon, 2022-2032F |
6.2.6 Kenya Fin Fish Market Revenues & Volume, By Milkfish, 2022-2032F |
6.2.7 Kenya Fin Fish Market Revenues & Volume, By Tuna, 2022-2032F |
6.2.8 Kenya Fin Fish Market Revenues & Volume, By Others, 2022-2032F |
6.2.9 Kenya Fin Fish Market Revenues & Volume, By Others, 2022-2032F |
7 Kenya Fin Fish Market Import-Export Trade Statistics |
7.1 Kenya Fin Fish Market Export to Major Countries |
7.2 Kenya Fin Fish Market Imports from Major Countries |
8 Kenya Fin Fish Market Key Performance Indicators |
9 Kenya Fin Fish Market - Opportunity Assessment |
9.1 Kenya Fin Fish Market Opportunity Assessment, By Environment, 2022 & 2032F |
9.2 Kenya Fin Fish Market Opportunity Assessment, By Fish Type, 2022 & 2032F |
10 Kenya Fin Fish Market - Competitive Landscape |
10.1 Kenya Fin Fish Market Revenue Share, By Companies, 2025 |
10.2 Kenya Fin Fish Market Competitive Benchmarking, By Operating and Technical Parameters |
11 Company Profiles |
12 Recommendations |
13 Disclaimer |
Global Go To Market Strategy - 2030
Export potential enables firms to identify high-growth global markets with greater confidence by combining advanced trade intelligence with a structured quantitative methodology. The framework analyzes emerging demand trends and country-level import patterns while integrating macroeconomic and trade datasets such as GDP and population forecasts, bilateral import–export flows, tariff structures, elasticity differentials between developed and developing economies, geographic distance, and import demand projections. Using weighted trade values from 2020–2024 as the base period to project country-to-country export potential for 2030, these inputs are operationalized through calculated drivers such as gravity model parameters, tariff impact factors, and projected GDP per-capita growth. Through an analysis of hidden potentials, demand hotspots, and market conditions that are most favorable to success, this method enables firms to focus on target countries, maximize returns, and global expansion with data, backed by accuracy.
By factoring in the projected importer demand gap that is currently unmet and could be potential opportunity, it identifies the potential for the Exporter (Country) among 190 countries, against the general trade analysis, which identifies the biggest importer or exporter.
To discover high-growth global markets and optimize your business strategy:
Click Here
Pricing
- Single User License$ 1,995
- Department License$ 2,400
- Site License$ 3,120
- Global License$ 3,795

Leadership Perspectives from Industry Events
Search
Thought Leadership and Analyst Meet


Our Clients
6WResearch In News
- Doha a strategic location for EV manufacturing hub: IPA Qatar
- Demand for luxury TVs surging in the GCC, says Samsung
- Empowering Growth: The Thriving Journey of Bangladesh’s Cable Industry
- Demand for luxury TVs surging in the GCC, says Samsung
- Video call with a traditional healer? Once unthinkable, it’s now common in South Africa
- Intelligent Buildings To Smooth GCC’s Path To Net Zero
Latest Reports
- Taiwan Airport Wireless Infrastructure Market (2026-2032)
- Vietnam Airport Wireless Infrastructure Market (2026-2032)
- Thailand Airport Wireless Infrastructure Market (2026-2032)
- South Korea Airport Wireless Infrastructure Market (2026-2032)
- Romania Airport Wireless Infrastructure Market (2026-2032)
- Qatar Airport Wireless Infrastructure Market (2026-2032)
- Philippines Airport Wireless Infrastructure Market (2026-2032)
- Japan Airport Wireless Infrastructure Market (2026-2032)
- Taiwan Airport Winter Services Market (2026-2032)
- Vietnam Airport Winter Services Market (2026-2032)
Industry Events and Analyst Meet

HIMTEX 2026

India Refining Summit 2026

India EV Show 2026

EV tech India Expo 2026

Auto Tech Asia 2026
Whitepaper
- Middle East & Africa Commercial Security Market Click here to view more.
- Middle East & Africa Fire Safety Systems & Equipment Market Click here to view more.
- GCC Drone Market Click here to view more.
- Middle East Lighting Fixture Market Click here to view more.
- GCC Physical & Perimeter Security Market Click here to view more.