Jordan Fin Fish Market (2026-2032) | Trends, Growth, Size, Value, Forecast, Share, Revenue, Analysis, Outlook, Companies & Industry
Market Forecast By Environment (Freshwater, Marine Water, Brackish Water), By Fish Type (Pompano, Snappers, Groupers, Salmon, Milkfish, Tuna, Catfish, Others) And Competitive Landscape
| Product Code: ETC038847 | Publication Date: Jan 2021 | Updated Date: Jun 2026 | Product Type: Report | |
| Publisher: 6Wresearch | Author: Sachin Kumar Rai | No. of Pages: 70 | No. of Figures: 35 | No. of Tables: 5 |
Jordan Fin Fish Market Summary
The jordan fin fish market was estimated at USD 290 Million in 2025 and is projected to reach USD 396 Million by 2032, growing at a CAGR of 5.6% from 2026 to 2032.
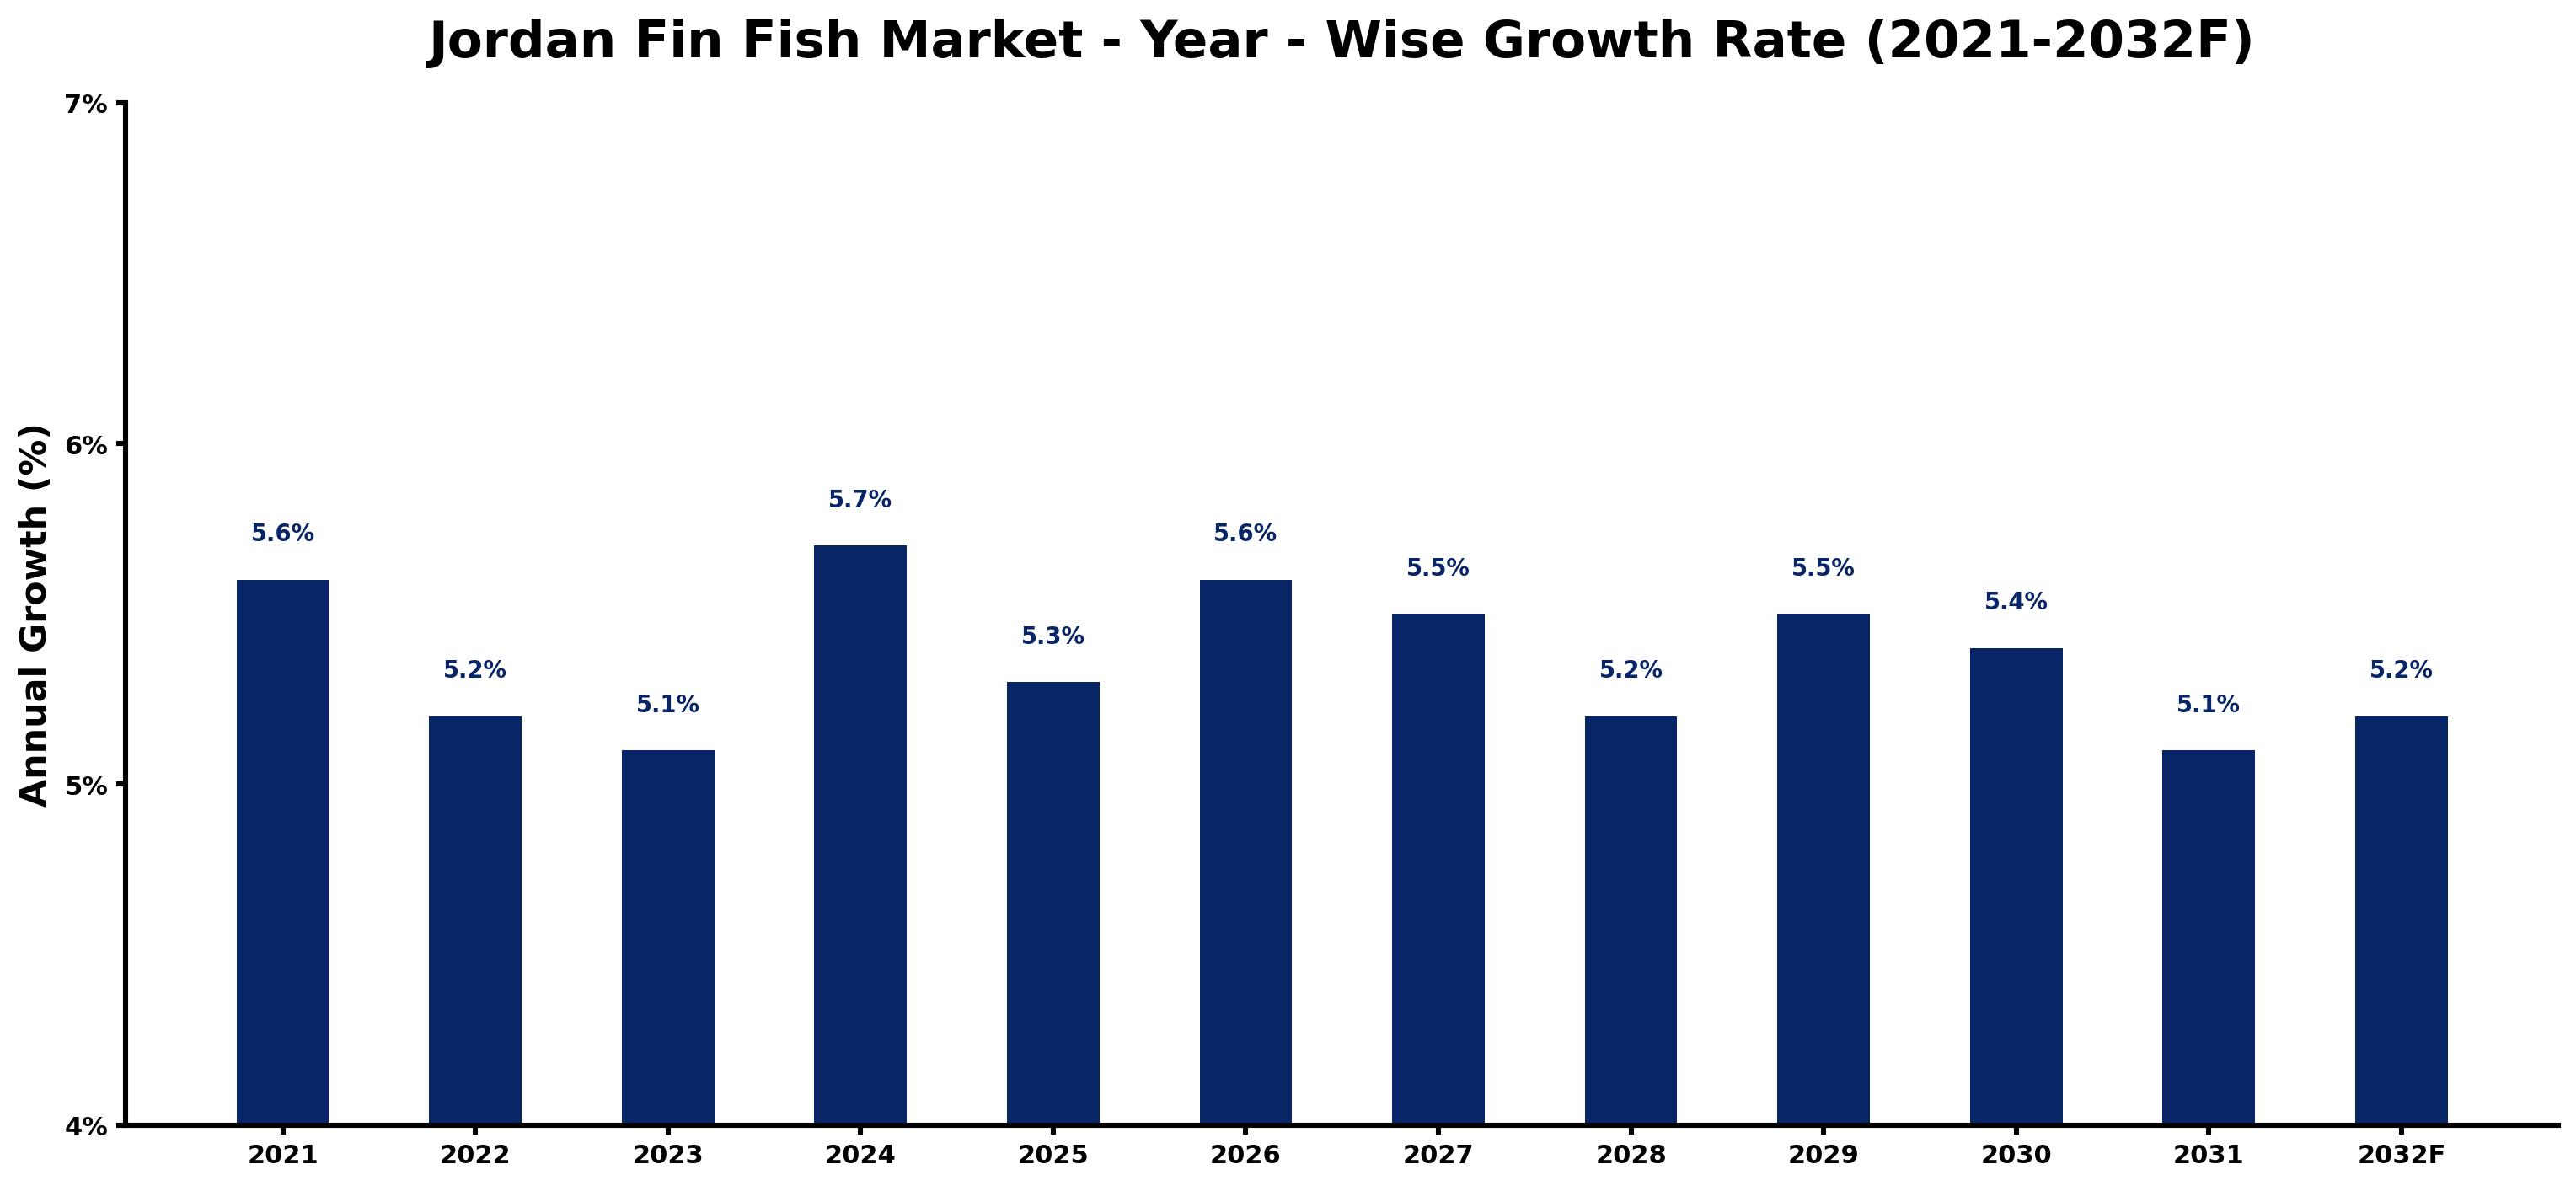
Jordan Fin Fish Market Growth Rate Analysis (2021-2032)
The Jordan Fin Fish market has shown stable growth, with annual increases ranging from 5.1% to 5.7% over the past few years. In 2021, the market grew by 5.6%, driven largely by rising consumer demand for sustainable seafood as awareness of health benefits gained traction. This demand slightly tapered to 5.2% in 2022, influenced by fluctuating supply chain dynamics and inflationary pressures. However, the market rebounded to 5.7% in 2024, as investments in aquaculture technology and enhanced fishing infrastructure took shape. By 2025, growth stood at 5.3%, reflecting ongoing digitalization efforts in seafood marketing and distribution that improved consumer access. Such trends are expected to stabilize at around 5.4% to 5.2% through 2032, indicating a robust, if slightly restrained, future.
Jordan Fin Fish Market Year-wise Growth Rate and Key Drivers
This graph highlights how the Jordan Fin Fish Market has steadily grown over the past five years, supported by major growth factors.
The table below presents the year wise growth rates along with the key drivers influencing the market
| Year | Growth Rate | Major Drivers |
| 2021 | 5.6% | The Jordanian fishing sector shows resilience amidst pandemic-related supply chain disruptions. |
| 2022 | 5.2% | Consumer preferences shift towards sustainable seafood, influencing market dynamics significantly. |
| 2023 | 5.1% | Local aquaculture initiatives gain traction, promoting domestic fish production and trading. |
| 2024 | 5.7% | Regional partnerships strengthen, enhancing cross-border fish trade opportunities across the GCC. |
| 2025 | 5.3% | Technological advancements in aquaculture improve yield, attracting new investors to the market. |
| 2026 | 5.6% | Export incentives introduced, positioning Jordan as a competitive player in global fish markets. |
| 2027 | 5.5% | Increasing tourism boosts local demand for fresh seafood, benefiting fishermen and retailers. |
| 2028 | 5.2% | Climate change impacts prompt a focus on resilient fishing practices and sustainable sourcing. |
| 2029 | 5.5% | Urbanization trends lead to higher seafood consumption in metropolitan areas like Amman. |
| 2030 | 5.4% | Collaboration between government and private sectors enhances infrastructure for fish distribution. |
| 2031 | 5.1% | Consumer awareness about health benefits drives interest in diverse fin fish varieties. |
| 2032 | 5.2% | Emerging markets in neighboring countries become vital for Jordan's fin fish exports. |
Note - Market size estimations and growth projections presented in this report are based on 6Wresearch's advanced forecasting approach, validated with industry datasets as of June 2026.
Jordan Fin Fish Market Synopsis
The Jordan Fin Fish Market is projected to reach 5.6% and witness significant growth during the forecast period (2026-2032). This growth can be attributed to a combination of increasing domestic demand for fresh fish, a heightened focus on sustainability, and the expansion of aquaculture operations. The market is primarily influenced by consumer preferences for local seafood and an increasing awareness of environmental issues surrounding fishing practices.
Jordan Fin Fish Market Growth Drivers
Several key factors are propelling growth within the Jordan Fin Fish Market. Firstly, the demand for local fish species such as seabream, seabass, and mullet remains strong, driven by their integral role in the Jordanian diet. Secondly, there is an increasing consumer inclination towards sustainable fishing practices and organic seafood options.
- The rise in consumer awareness regarding the origins and sustainability of seafood is encouraging more people to choose locally sourced fish over imported varieties.
- Technological advancements in aquaculture are facilitating improved production methods, leading to higher quality fish and more efficient operations.
- The convenience of online shopping for seafood is becoming increasingly popular, thereby attracting a younger demographic focused on ease of access.
- Government initiatives aimed at supporting sustainable practices are fostering a more favorable regulatory environment for fishery operations.
- Rising health consciousness among consumers is driving interest in seafood as a source of nutritious lean protein, further fueling market demand.
Jordan Fin Fish Market Trends and Opportunities
The Jordan Fin Fish Market is experiencing various emerging trends that offer significant opportunities for development. A notable trend is the increasing consumer preference for high-quality, wild-caught fish, which is perceived as healthier and more sustainable than farmed alternatives.
- Aquaculture facilities are expanding to meet the rising demand for fish species like tilapia and grouper, ensuring a steady supply of fresh fish to the market.
- The integration of innovative distribution channels, including home delivery services, is enhancing the consumer experience and growing market accessibility.
- Efforts to promote local fish farming techniques are fostering a culture of sustainability, which resonates well with environmentally conscious consumers.
- Emerging market players are beginning to explore the potential for value-added fish products, such as pre-packaged seafood and ready-to-cook options.
- Collaborations between stakeholders in the fishing industry are paving the way for knowledge sharing and innovation, which is vital for sustained growth.
Jordan Fin Fish Market Challenges and Restraints
While the prospects for the Jordan Fin Fish Market are encouraging, a number of challenges must be addressed for long-term success. Technological barriers and outdated infrastructure in fish farming can limit production efficiency and quality control.
- Limited access to modern farming techniques can hinder the ability of local fish farmers to compete effectively with imported seafood.
- Fluctuations in global fish prices can affect local markets, making it difficult for fish farmers to set stable prices.
- Environmental issues such as water scarcity and pollution further threaten the sustainability of aquaculture operations in Jordan.
- Regulatory challenges and compliance with international standards can create barriers for Jordanian fish products to access larger markets.
- Consumer habits shifting towards imported seafood can pose a risk to local fishers, who may struggle to maintain market share without substantial improvements.
Jordan Fin Fish Market Government Investment and Initiatives
The Jordan Fin Fish Market is influenced significantly by government policies that are aimed at fostering sustainable fishing practices. The Ministry of Agriculture and the Ministry of Environment oversee the regulations governing fishing quotas, aquaculture licensing, and seasonal fishing practices.
- The government promotes aquaculture as a viable alternative to traditional fishing, offering incentives to farmers for sustainable practices.
- Monitoring water quality and hygiene standards in processing facilities are critical government functions that ensure food safety in the seafood sector.
- Programs aimed at combating illegal fishing and protecting endangered species are vital to maintaining the ecological balance of Jordan's waters.
- Investment in research and development for sustainable fishing practices has become a priority for policymakers to bolster the local economy.
- There is a growing focus on public-private partnerships to enhance resources and capabilities within the aquaculture sector.
Jordan Fin Fish Market Latest Developments (May 2025 - June 2026)
Recent developments within the Jordan Fin Fish Market indicate a shift towards more sustainable fishing practices and improved aquaculture methods. During this period, there has been an increase in governmental support towards aquaculture, aimed at improving local fish production capabilities and encouraging environmentally friendly practices.
- New initiatives promoting local seafood have gained traction, enhancing consumer awareness and connection to regional fish species.
- The market has seen an increase in technological investments that aim to modernize fish farming practices and improve supply chain efficiencies.
- There is a noticeable rise in the number of fish processing facilities dedicated to maintaining quality and compliance with international standards.
- Emerging trends in online fish sales and home delivery services are becoming more prevalent, altering traditional purchasing behaviors among consumers.
- Efforts to engage local communities in sustainable fishing practices have been amplified, fostering a more environmentally conscious consumer base.
Jordan Fin Fish Market - Key Attractiveness of the Report
- 10 Years of Market Numbers
- Historical Data Starting from 2022 to 2025
- Base Year: 2025
- Forecast Data until 2032
- Key Performance Indicators Impacting the Market
- Major Upcoming Developments and Projects
Key Highlights of the Report:
- Jordan Fin Fish Market Outlook
- Market Size of Jordan Fin Fish Market, 2025
- Forecast of Jordan Fin Fish Market, 2032F
- Historical Data and Forecast of Jordan Fin Fish Revenues & Volume for the Period 2022-2032F
- Jordan Fin Fish Market Trend Evolution
- Jordan Fin Fish Market Drivers and Challenges
- Jordan Fin Fish Price Trends
- Jordan Fin Fish Porter's Five Forces
- Jordan Fin Fish Industry Life Cycle
- Historical Data and Forecast of Jordan Fin Fish Market Revenues & Volume By Environment for the Period 2022-2032F
- Historical Data and Forecast of Jordan Fin Fish Market Revenues & Volume By Freshwater for the Period 2022-2032F
- Historical Data and Forecast of Jordan Fin Fish Market Revenues & Volume By Marine Water for the Period 2022-2032F
- Historical Data and Forecast of Jordan Fin Fish Market Revenues & Volume By Brackish Water for the Period 2022-2032F
- Historical Data and Forecast of Jordan Fin Fish Market Revenues & Volume By Fish Type for the Period 2022-2032F
- Historical Data and Forecast of Jordan Fin Fish Market Revenues & Volume By Pompano for the Period 2022-2032F
- Historical Data and Forecast of Jordan Fin Fish Market Revenues & Volume By Snappers for the Period 2022-2032F
- Historical Data and Forecast of Jordan Fin Fish Market Revenues & Volume By Groupers for the Period 2022-2032F
- Historical Data and Forecast of Jordan Fin Fish Market Revenues & Volume By Salmon for the Period 2022-2032F
- Historical Data and Forecast of Jordan Fin Fish Market Revenues & Volume By Milkfish for the Period 2022-2032F
- Historical Data and Forecast of Jordan Fin Fish Market Revenues & Volume By Tuna for the Period 2022-2032F
- Historical Data and Forecast of Jordan Fin Fish Market Revenues & Volume By Catfish for the Period 2022-2032F
- Historical Data and Forecast of Jordan Fin Fish Market Revenues & Volume By Others for the Period 2022-2032F
- Jordan Fin Fish Import Export Trade Statistics
- Market Opportunity Assessment By Environment
- Market Opportunity Assessment By Fish Type
- Jordan Fin Fish Top Companies Market Share
- Jordan Fin Fish Competitive Benchmarking By Technical and Operational Parameters
- Jordan Fin Fish Company Profiles
- Jordan Fin Fish Key Strategic Recommendations
Frequently Asked Questions About the Market Study (FAQs):
Increasing domestic demand for fresh and sustainable seafood, technological advancements, and government support for aquaculture are primary drivers.
The government provides regulations, incentives for sustainable practices, funding for aquaculture, and initiatives to promote local seafood.
The main challenges include outdated technology in fish farming, competition with imported seafood, and environmental issues such as pollution and water scarcity.
Trends include a growing preference for organic fish, technological innovations in aquaculture, and shifts towards online purchasing and home delivery services.
6Wresearch actively monitors the Jordan Fin Fish Market and publishes its comprehensive annual report, highlighting emerging trends, growth drivers, revenue analysis, and forecast outlook. Our insights help businesses to make data-backed strategic decisions with ongoing market dynamics. Our analysts track relevent industries related to the Jordan Fin Fish Market, allowing our clients with actionable intelligence and reliable forecasts tailored to emerging regional needs.
Yes, we provide customisation as per your requirements. To learn more, feel free to contact us on sales@6wresearch.com
1 Executive Summary |
2 Introduction |
2.1 Key Highlights of the Report |
2.2 Report Description |
2.3 Market Scope & Segmentation |
2.4 Research Methodology |
2.5 Assumptions |
3 Jordan Fin Fish Market Overview |
3.1 Jordan Country Macro Economic Indicators |
3.2 Jordan Fin Fish Market Revenues & Volume, 2022 & 2032F |
3.3 Jordan Fin Fish Market - Industry Life Cycle |
3.4 Jordan Fin Fish Market - Porter's Five Forces |
3.5 Jordan Fin Fish Market Revenues & Volume Share, By Environment, 2022 & 2032F |
3.6 Jordan Fin Fish Market Revenues & Volume Share, By Fish Type, 2022 & 2032F |
4 Jordan Fin Fish Market Dynamics |
4.1 Impact Analysis |
4.2 Market Drivers |
4.3 Market Restraints |
5 Jordan Fin Fish Market Trends |
6 Jordan Fin Fish Market, By Types |
6.1 Jordan Fin Fish Market, By Environment |
6.1.1 Overview and Analysis |
6.1.2 Jordan Fin Fish Market Revenues & Volume, By Environment, 2022-2032F |
6.1.3 Jordan Fin Fish Market Revenues & Volume, By Freshwater, 2022-2032F |
6.1.4 Jordan Fin Fish Market Revenues & Volume, By Marine Water, 2022-2032F |
6.1.5 Jordan Fin Fish Market Revenues & Volume, By Brackish Water, 2022-2032F |
6.2 Jordan Fin Fish Market, By Fish Type |
6.2.1 Overview and Analysis |
6.2.2 Jordan Fin Fish Market Revenues & Volume, By Pompano, 2022-2032F |
6.2.3 Jordan Fin Fish Market Revenues & Volume, By Snappers, 2022-2032F |
6.2.4 Jordan Fin Fish Market Revenues & Volume, By Groupers, 2022-2032F |
6.2.5 Jordan Fin Fish Market Revenues & Volume, By Salmon, 2022-2032F |
6.2.6 Jordan Fin Fish Market Revenues & Volume, By Milkfish, 2022-2032F |
6.2.7 Jordan Fin Fish Market Revenues & Volume, By Tuna, 2022-2032F |
6.2.8 Jordan Fin Fish Market Revenues & Volume, By Others, 2022-2032F |
6.2.9 Jordan Fin Fish Market Revenues & Volume, By Others, 2022-2032F |
7 Jordan Fin Fish Market Import-Export Trade Statistics |
7.1 Jordan Fin Fish Market Export to Major Countries |
7.2 Jordan Fin Fish Market Imports from Major Countries |
8 Jordan Fin Fish Market Key Performance Indicators |
9 Jordan Fin Fish Market - Opportunity Assessment |
9.1 Jordan Fin Fish Market Opportunity Assessment, By Environment, 2022 & 2032F |
9.2 Jordan Fin Fish Market Opportunity Assessment, By Fish Type, 2022 & 2032F |
10 Jordan Fin Fish Market - Competitive Landscape |
10.1 Jordan Fin Fish Market Revenue Share, By Companies, 2025 |
10.2 Jordan Fin Fish Market Competitive Benchmarking, By Operating and Technical Parameters |
11 Company Profiles |
12 Recommendations |
13 Disclaimer |
Global Go To Market Strategy - 2030
Export potential enables firms to identify high-growth global markets with greater confidence by combining advanced trade intelligence with a structured quantitative methodology. The framework analyzes emerging demand trends and country-level import patterns while integrating macroeconomic and trade datasets such as GDP and population forecasts, bilateral import–export flows, tariff structures, elasticity differentials between developed and developing economies, geographic distance, and import demand projections. Using weighted trade values from 2020–2024 as the base period to project country-to-country export potential for 2030, these inputs are operationalized through calculated drivers such as gravity model parameters, tariff impact factors, and projected GDP per-capita growth. Through an analysis of hidden potentials, demand hotspots, and market conditions that are most favorable to success, this method enables firms to focus on target countries, maximize returns, and global expansion with data, backed by accuracy.
By factoring in the projected importer demand gap that is currently unmet and could be potential opportunity, it identifies the potential for the Exporter (Country) among 190 countries, against the general trade analysis, which identifies the biggest importer or exporter.
To discover high-growth global markets and optimize your business strategy:
Click Here
Pricing
- Single User License$ 1,995
- Department License$ 2,400
- Site License$ 3,120
- Global License$ 3,795

Leadership Perspectives from Industry Events
Search
Thought Leadership and Analyst Meet


Our Clients
6WResearch In News
- India Air Conditioner Market Set for Strong Rebound in 2026 After Weather-Led Correction and GST-Driven Recovery: 6Wresearch
- ADAS in India: How Automatic Emergency Braking, Blind Spot Detection & Driver Monitoring are Transforming Road Safety
- Doha a strategic location for EV manufacturing hub: IPA Qatar
- Demand for luxury TVs surging in the GCC, says Samsung
- Empowering Growth: The Thriving Journey of Bangladesh’s Cable Industry
- Demand for luxury TVs surging in the GCC, says Samsung
Latest Reports
- Poland Fire Protection Systems Market (2026-2032)
- Cape Verde Portable Hand-Thrown Extinguisher Market (2026-2032)
- Canada Portable Hand-Thrown Extinguisher Market (2026-2032)
- Cameroon Portable Hand-Thrown Extinguisher Market (2026-2032)
- Burundi Portable Hand-Thrown Extinguisher Market (2026-2032)
- Burkina Faso Portable Hand-Thrown Extinguisher Market (2026-2032)
- Bulgaria Portable Hand-Thrown Extinguisher Market (2026-2032)
- Brunei Portable Hand-Thrown Extinguisher Market (2026-2032)
- Botswana Portable Hand-Thrown Extinguisher Market (2026-2032)
- Bosnia and Herzegovina Portable Hand-Thrown Extinguisher Market (2026-2032)
Industry Events and Analyst Meet

HIMTEX 2026

India Refining Summit 2026

India EV Show 2026

EV tech India Expo 2026

Auto Tech Asia 2026
Whitepaper
- Middle East & Africa Commercial Security Market Click here to view more.
- Middle East & Africa Fire Safety Systems & Equipment Market Click here to view more.
- GCC Drone Market Click here to view more.
- Middle East Lighting Fixture Market Click here to view more.
- GCC Physical & Perimeter Security Market Click here to view more.