Kenya Fish Market Size, Share & Growth Rate
The Kenya Fish Market was estimated at USD 767 Million in 2025 and is projected to reach USD 1092 Million by 2032, growing at a CAGR of 5.2% from 2026 to 2032. This growth trajectory is largely driven by increasing urbanization and a rising population, which are intensifying the demand for affordable protein sources. Furthermore, the push for sustainable fishing and aquaculture practices is creating opportunities for increased local production, catering to both local and export markets.
Kenya Fish Market Year-wise Growth Rate and Key Drivers
This graph highlights how the Kenya Fish Market has steadily grown over the years, supported by major growth factors.
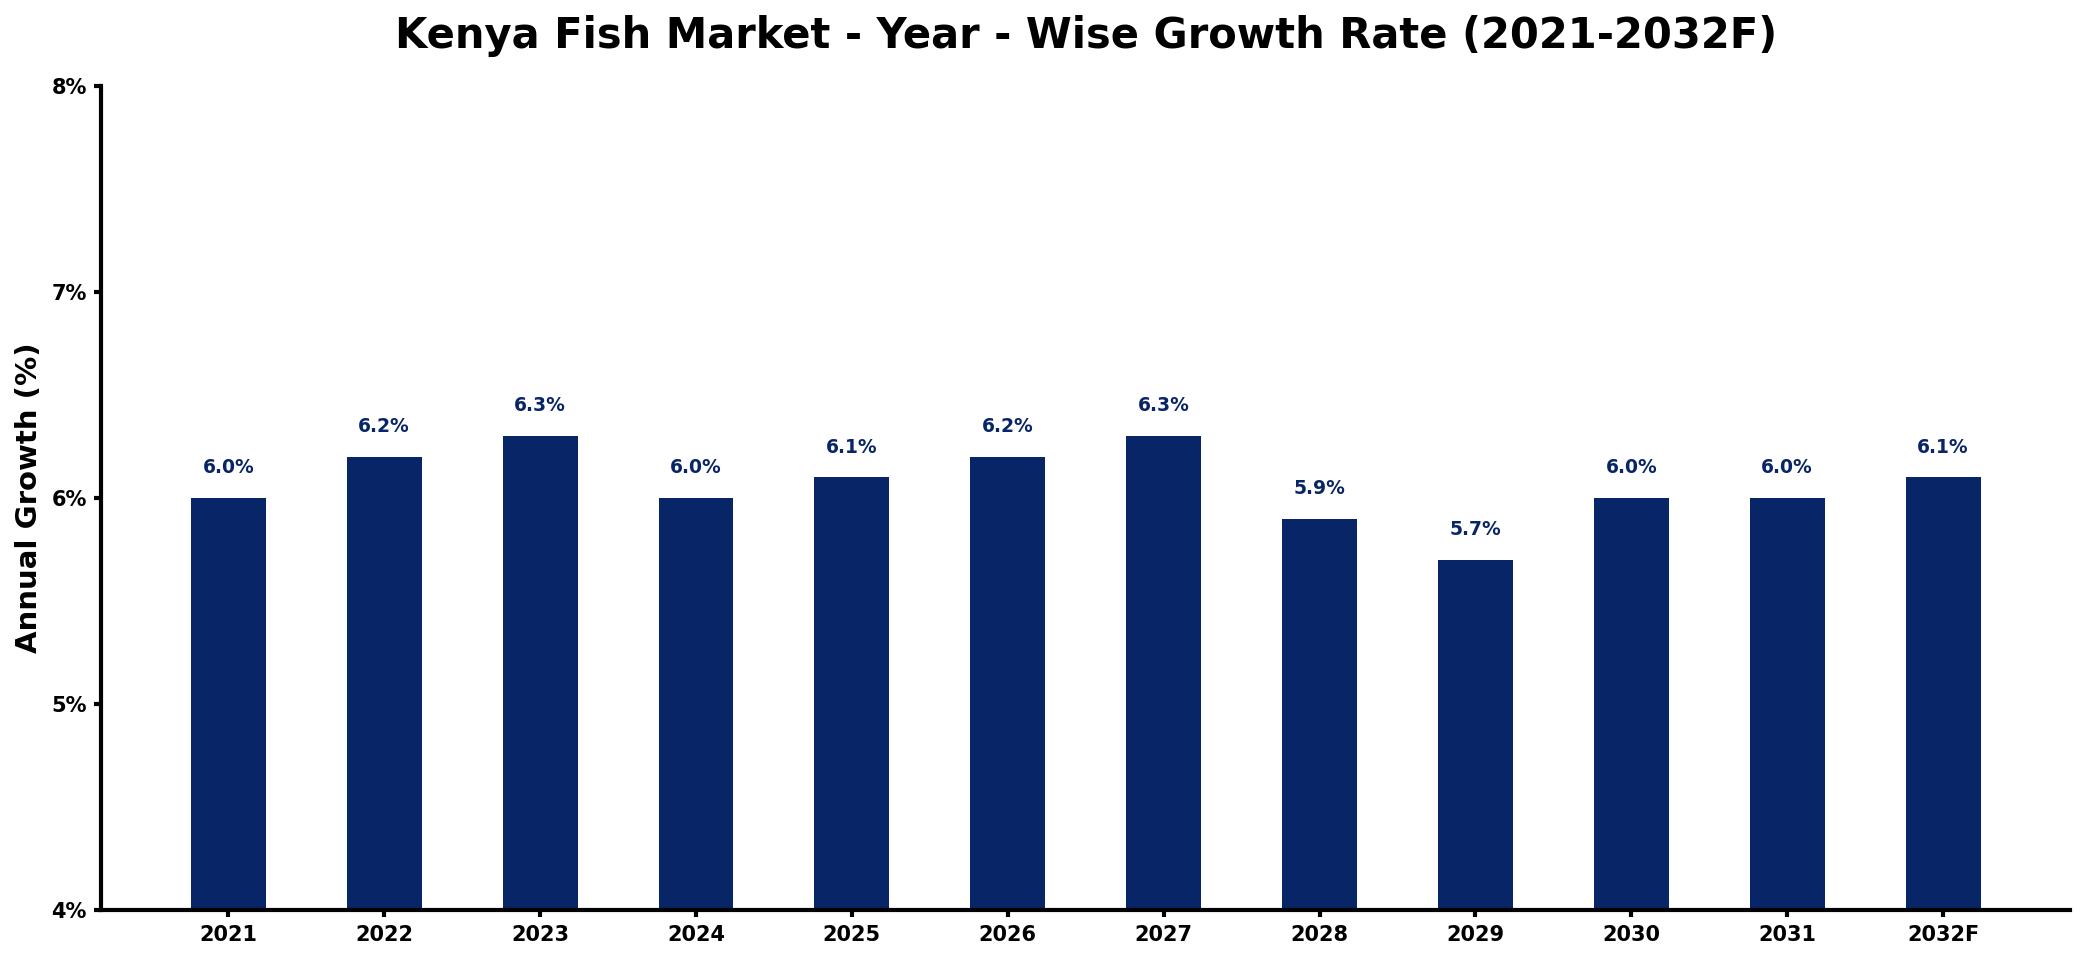
The table below presents the year‑wise growth rates along with the key drivers influencing the market
| Year | Growth Rate | Major Drivers |
| 2021 | 6.0% | Rising health consciousness among consumers |
| 2022 | 6.2% | Increased investment in aquaculture facilities |
| 2023 | 6.3% | Growing popularity of local cuisine |
| 2024 | 6.0% | Expansion of distribution networks |
| 2025 | 6.1% | Surge in export opportunities abroad |
| 2026 | 6.2% | Enhanced sustainability practices adopted |
| 2027 | 6.3% | Technological advancements in processing |
| 2028 | 5.9% | Diversification of product offerings available |
| 2029 | 5.7% | Strengthening of regulatory frameworks |
| 2030 | 6.0% | Boost in urban population demands |
| 2031 | 6.0% | Collaboration among industry stakeholders |
| 2032 | 6.1% | Rise in eco-friendly packaging solutions |
Note: Market size estimations and growth projections presented in this report are based on 6Wresearch's proprietary forecasting methodology, utilizing the latest available industry data, government publications, and primary research inputs.
Kenya Fish Market Synopsis
Sustainability is the strongest force shaping the Kenya Fish Market today. As consumers become increasingly environmentally conscious, the shift towards ethically sourced fish products is prompting changes throughout the supply chain, from harvesting to retail. This focus on sustainability aligns with the governments initiatives aimed at reducing overfishing and promoting responsible fishing practices.
In addition to sustainability, the market is experiencing a notable rise in demand for value-added fish products such as fillets, smoked fish, and ready-to-cook options. This trend reflects a broader consumer preference for convenience and quality, as households seek efficient ways to incorporate nutritious seafood into their diets.
Kenya Fish Market Key Takeaways
- The Kenya Fish Market is poised for significant growth, projected to reach USD 1092 Million by 2032.
- Sustainability and the promotion of aquaculture are transforming production practices within the industry.
- Consumers are increasingly demanding value-added fish products, influencing the market's direction.
- Investment in cold chain logistics and infrastructure is essential to reduce post-harvest losses.
- Government policies are supporting sustainable practices and enhancing the overall efficiency of the market.
Evaluation of Restraints in Kenya Fish Market
Despite the promising outlook, the Kenya Fish Market faces several constraints that could impede growth. Inconsistent supply, primarily due to overfishing and illegal fishing practices, leads to market volatility and affects pricing. Additionally, poor infrastructure hampers logistics, resulting in post-harvest losses that significantly impact profitability. The lack of access to credit and adequate market information further exacerbates the challenges for small-scale fishers and traders, limiting their ability to capitalize on emerging market opportunities.
Kenya Fish Market Trends
Current trends indicate a marked increase in consumer preference for sustainable and locally sourced seafood options. This shift is prompting businesses to adopt eco-friendly practices while promoting indigenous fish species. Moreover, the growing penetration of e-commerce platforms is revolutionizing how consumers access fish products, enabling greater convenience and improved market reach. Alongside these trends, the rising demand for processed fish products reflects a broader inclination towards healthier, ready-to-cook meals.
Kenya Fish Market Opportunities
The investment landscape in the Kenya Fish Market is ripe with opportunities. Aquaculture presents a sustainable solution to meet the increasing demand for fish products, while investment in processing facilities can enhance value addition and expand export potential. Furthermore, improving cold chain logistics will not only reduce post-harvest losses but also ensure quality retention. Technology solutions aimed at streamlining the supply chain will also prove vital for enhancing efficiency and competitiveness.
Government Initiatives in the Kenya Fish Market
The Kenyan government is actively engaged in enhancing the fish market through various policies and initiatives aimed at fostering sustainability. The Fisheries Management and Development Act regulates fisheries resources to ensure responsible practices, while the Fish Inspection and Quality Control Act guarantees the safety and quality of fish products. Investments are also being made in the infrastructure of fish landing sites and markets, thus improving hygiene and operational efficiency, which are critical for food security and market growth.
Future Insights of the Kenya Fish Market
Looking ahead to 2026-2032, the Kenya Fish Market is positioned for robust growth driven by demographic shifts and evolving consumer preferences. The increasing population and urbanization will further elevate the demand for fish as a vital protein source. The government's continued support for sustainable fishing and aquaculture initiatives is likely to bolster domestic production, reducing dependence on imports. However, addressing infrastructure challenges and ensuring quality control will be essential for the market's sustained growth in the coming years.
Kenya Fish Market Latest Developments (2025 - 2026)
Recent developments in the Kenya Fish Market highlight a shift towards modern retailing and e-commerce platforms that improve market access for consumers and suppliers alike. Additionally, initiatives promoting sustainable fishing practices are gaining traction, as awareness of environmental impacts continues to grow. These changes are further supported by governmental investment in infrastructure aimed at enhancing the efficiency and effectiveness of fish distribution channels.
Kenya Fish Market - Key Attractiveness of the Report
- 10 Years of Market Numbers
- Historical Data Starting from 2022 to 2025
- Base Year: 2025
- Forecast Data until 2032
- Key Performance Indicators Impacting the Market
- Major Upcoming Developments and Projects
Key Highlights of the Report:
- Kenya Fish Market Outlook
- Market Size of Kenya Fish Market, 2025
- Forecast of Kenya Fish Market, 2032
- Historical Data and Forecast of Kenya Fish Revenues & Volume for the Period 2022-2032F
- Kenya Fish Market Trend Evolution
- Kenya Fish Market Drivers and Challenges
- Kenya Fish Price Trends
- Kenya Fish Porter's Five Forces
- Kenya Fish Industry Life Cycle
- Historical Data and Forecast of Kenya Fish Market Revenues & Volume By Fish Type for the Period 2022-2032F
- Historical Data and Forecast of Kenya Fish Market Revenues & Volume By Inland Fishes for the Period 2022-2032F
- Historical Data and Forecast of Kenya Fish Market Revenues & Volume By Marine Fishes for the Period 2022-2032F
- Historical Data and Forecast of Kenya Fish Market Revenues & Volume By Shrimps for the Period 2022-2032F
- Historical Data and Forecast of Kenya Fish Market Revenues & Volume By Scampi for the Period 2022-2032F
- Historical Data and Forecast of Kenya Fish Market Revenues & Volume By Product Type for the Period 2022-2032F
- Historical Data and Forecast of Kenya Fish Market Revenues & Volume By Fresh for the Period 2022-2032F
- Historical Data and Forecast of Kenya Fish Market Revenues & Volume By Frozen for the Period 2022-2032F
- Historical Data and Forecast of Kenya Fish Market Revenues & Volume By Canned for the Period 2022-2032F
- Historical Data and Forecast of Kenya Fish Market Revenues & Volume By Others for the Period 2022-2032F
- Historical Data and Forecast of Kenya Fish Market Revenues & Volume By Distribution Channel for the Period 2022-2032F
- Historical Data and Forecast of Kenya Fish Market Revenues & Volume By Retail for the Period 2022-2032F
- Historical Data and Forecast of Kenya Fish Market Revenues & Volume By Institutional for the Period 2022-2032F
- Historical Data and Forecast of Kenya Fish Market Revenues & Volume By Sector for the Period 2022-2032F
- Historical Data and Forecast of Kenya Fish Market Revenues & Volume By Organised for the Period 2022-2032F
- Historical Data and Forecast of Kenya Fish Market Revenues & Volume By Unorganised for the Period 2022-2032F
- Kenya Fish Import Export Trade Statistics
- Market Opportunity Assessment By Fish Type
- Market Opportunity Assessment By Product Type
- Market Opportunity Assessment By Distribution Channel
- Market Opportunity Assessment By Sector
- Kenya Fish Top Companies Market Share
- Kenya Fish Competitive Benchmarking By Technical and Operational Parameters
- Kenya Fish Company Profiles
- Kenya Fish Key Strategic Recommendations






































