Kenya Food Minerals Market (2026-2032) Outlook | Companies, Revenue, Trends, Industry, Growth, Forecast, Value, Analysis, Size & Share
Market Forecast By Type (Zinc, Magnesium, Calcium, Iodine, Copper, Chromium, Iron), By Source (Marine, Fruits, Vegetables, Seaweed, Nuts), By Application (Nutraceutical Industries, Pharmaceutical industries, Food & Beverage Industries) And Competitive Landscape
| Product Code: ETC234950 | Publication Date: Aug 2022 | Updated Date: Jul 2026 | Product Type: Market Research Report | |
| Publisher: 6Wresearch | Author: Bhawna Singh | No. of Pages: 75 | No. of Figures: 35 | No. of Tables: 20 |
Kenya Food Minerals Market Size, Share & Growth Rate
The Kenya Food Minerals Market was estimated at USD 301 Million in 2025 and is projected to reach USD 399 Million by 2032, growing at a CAGR of 4.1% from 2026 to 2032. This upward trajectory is largely propelled by increasing health consciousness among consumers who are seeking nutritionally fortified foods. Furthermore, government initiatives promoting food fortification and improved dietary guidelines are driving market expansion, as more families prioritize nutrition in their daily meals.
Kenya Food Minerals Market Year-wise Growth Rate and Key Drivers
This graph highlights how the Kenya Food Minerals Market has steadily grown over the years, supported by major growth factors.
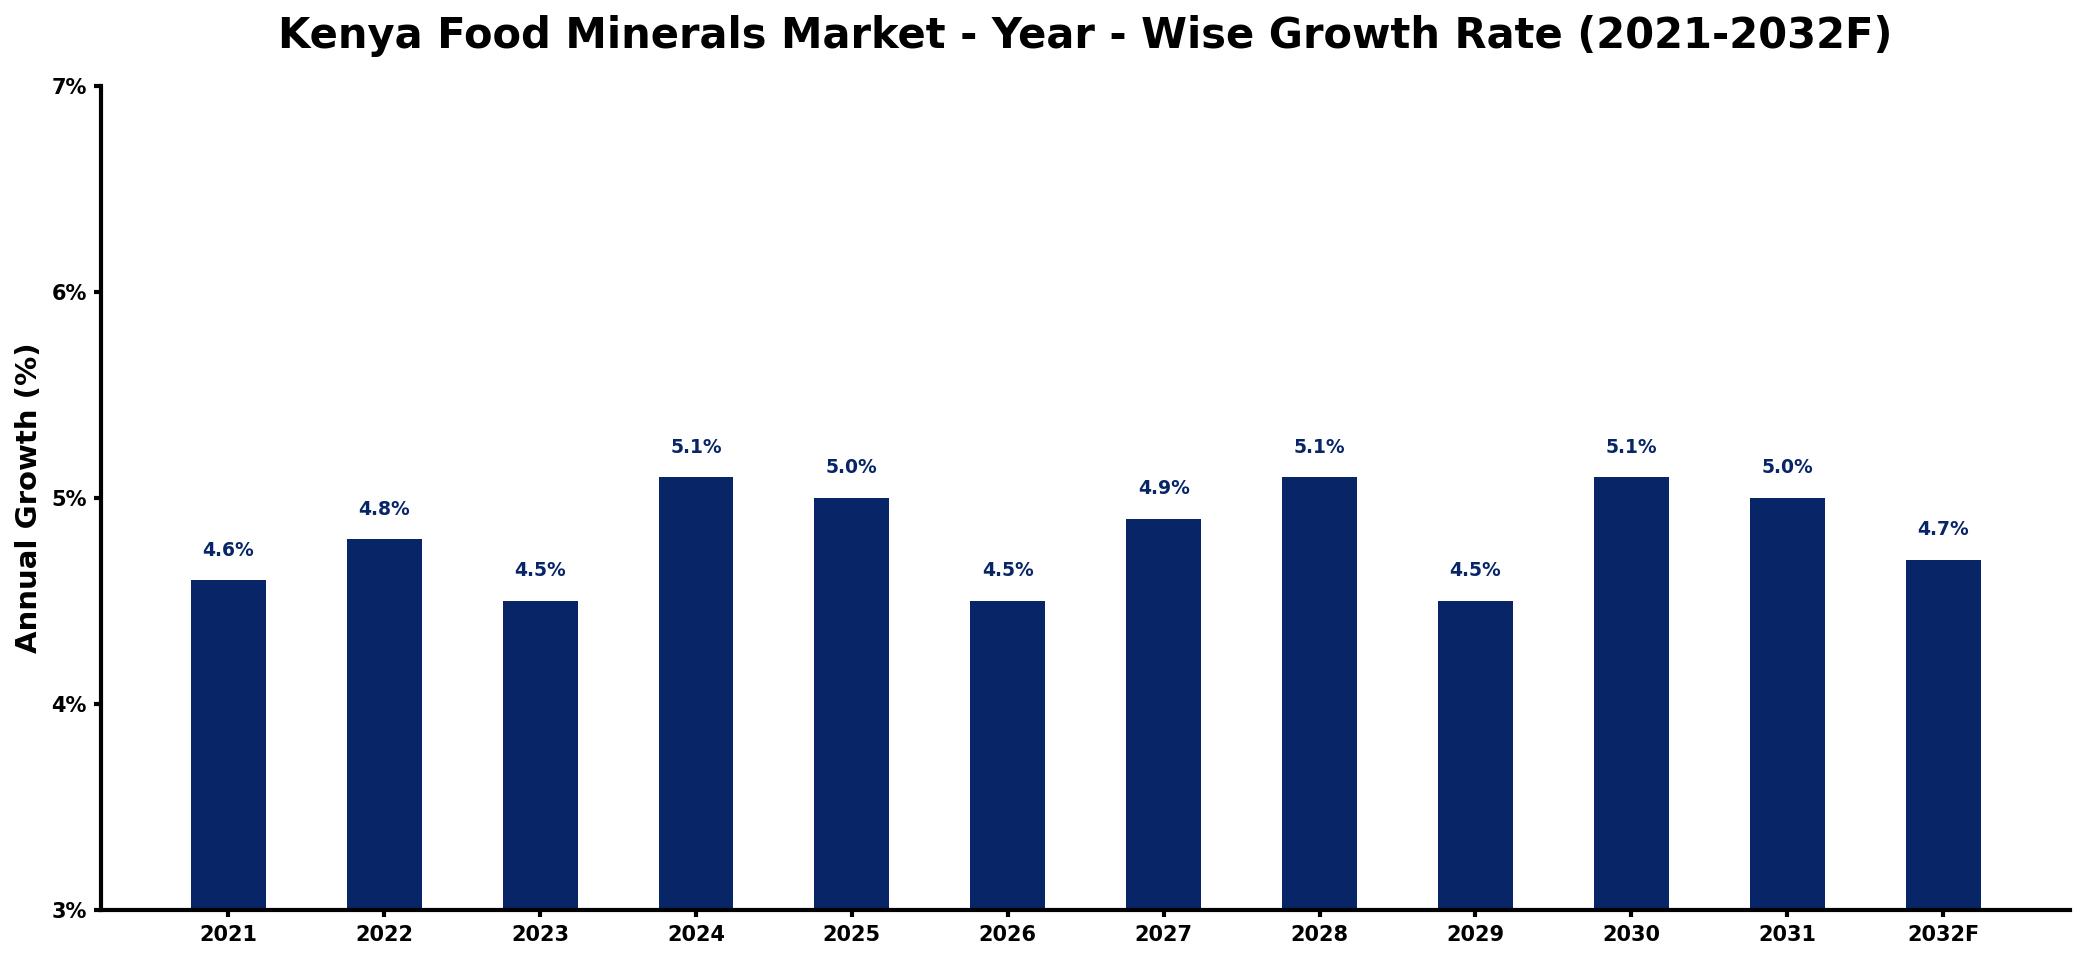
The table below presents the year‑wise growth rates along with the key drivers influencing the market
| Year | Growth Rate | Major Drivers |
| 2021 | 4.6% | Rising consumer health awareness |
| 2022 | 4.8% | Increased investment in agriculture |
| 2023 | 4.5% | Growing demand for supplements |
| 2024 | 5.1% | Expansion of distribution networks |
| 2025 | 5.0% | Emerging market for exports |
| 2026 | 4.5% | Technological advancements in processing |
| 2027 | 4.9% | Higher urbanization rates observed |
| 2028 | 5.1% | Strengthened regulatory frameworks emerging |
| 2029 | 4.5% | Increased focus on sustainability initiatives |
| 2030 | 5.1% | Surge in nutritional education programs |
| 2031 | 5.0% | Growing partnerships with retailers |
| 2032 | 4.7% | Enhanced research and development efforts |
Note: Market size estimations and growth projections presented in this report are based on 6Wresearch's proprietary forecasting methodology, utilizing the latest available industry data, government publications, and primary research inputs.
Kenya Food Minerals Market Synopsis
The consumption of fortified food products in Kenya is on the rise, with key minerals such as iron, zinc, and calcium at the forefront of this trend. This growing awareness is not just limited to urban areas but is also penetrating rural regions as nutritional education spreads.
With an evolving middle class and increased disposable incomes, more Kenyans are willing to invest in health-related products. The demand for mineral supplements is particularly pronounced among health-focused consumers and those with specific dietary needs, reflecting a substantial shift in purchasing behavior.
Kenya Food Minerals Market Key Takeaways
- Growing demand for fortified food products is reshaping market dynamics.
- Government policies support nutritional fortification to combat deficiencies.
- Increased consumer awareness drives innovation in product development.
- Health-conscious demographics are expanding the market for supplements.
- Investment opportunities are ripe for companies entering the fortified food sector.
Evaluation of Restraints in Kenya Food Minerals Market
Despite the positive outlook, the Kenya Food Minerals Market faces notable challenges that may impede its progress. Inadequate infrastructure hinders efficient distribution, particularly in remote areas where access to fortified products remains limited. Additionally, inconsistent quality control measures can lead to variations in product efficacy, potentially affecting consumer trust. Consumer awareness regarding the benefits of food minerals is still evolving, which necessitates more focused educational campaigns. Addressing these issues will be vital for sustainable market growth.
Kenya Food Minerals Market Trends
Current trends in the Kenya Food Minerals Market reveal a marked shift towards convenient, fortified food options. Products that blend traditional ingredients with modern fortification methods are gaining traction, appealing to both health-conscious consumers and those seeking convenience. Additionally, there is a rising interest in plant-based and organic fortified foods, reflecting broader global dietary trends and the increasing importance of sustainable nutrition.
Kenya Food Minerals Market Opportunities
The landscape of the Kenya Food Minerals Market is ripe with opportunities for innovation and investment. Manufacturers are encouraged to explore niche markets, such as fortified foods tailored for vulnerable demographics including children, pregnant women, and the elderly. Collaborations with health organizations can amplify the reach of newly developed products. Moreover, leveraging technology in the supply chain can enhance distribution and accessibility, ensuring that fortified products reach all corners of the country.
Government Initiatives in the Kenya Food Minerals Market
The Kenyan government has demonstrated a strong commitment to improving food security and nutrition through various policies. Initiatives like the National Food and Nutrition Security Policy aim to ensure that all citizens have access to nutritious food. Furthermore, regulations on food fortification are enforced by the Kenya Bureau of Standards (KEBS), ensuring that products meet established quality criteria. The National Micronutrient Fortification Program is another significant effort aimed at addressing micronutrient deficiencies among the population, reinforcing the governments dedication to public health.
Future Insights of the Kenya Food Minerals Market
Looking ahead to 2026-2032, the Kenya Food Minerals Market is positioned for robust growth, driven by a growing recognition of the critical role that essential minerals play in health and wellness. Shifting dietary patterns, alongside rising incomes, will continue to bolster demand for fortified food products. Furthermore, government-led initiatives aimed at improving nutritional standards are expected to catalyze further market expansion, setting the stage for both local and international companies to innovate and meet the evolving needs of Kenyan consumers.
Kenya Food Minerals Market Latest Developments (2025 - 2026)
In the past year, the Kenya Food Minerals Market has seen a surge in new product launches focused on micronutrient fortification. Companies are increasingly exploring partnerships with local nutrition experts to develop tailored products that address specific nutritional deficiencies prevalent in the region. Moreover, initiatives aimed at improving supply chain logistics are gaining momentum, enhancing the availability of fortified foods in underserved areas.
Kenya Food Minerals Market - Key Attractiveness of the Report
- 10 Years of Market Numbers
- Historical Data Starting from 2022 to 2025
- Base Year: 2025
- Forecast Data until 2032
- Key Performance Indicators Impacting the Market
- Major Upcoming Developments and Projects
Key Highlights of the Report:
- Kenya Food Minerals Market Outlook
- Market Size of Kenya Food Minerals Market, 2025
- Forecast of Kenya Food Minerals Market, 2032
- Historical Data and Forecast of Kenya Food Minerals Revenues & Volume for the Period 2022-2032F
- Kenya Food Minerals Market Trend Evolution
- Kenya Food Minerals Market Drivers and Challenges
- Kenya Food Minerals Price Trends
- Kenya Food Minerals Porter's Five Forces
- Kenya Food Minerals Industry Life Cycle
- Historical Data and Forecast of Kenya Food Minerals Market Revenues & Volume By Type for the Period 2022-2032F
- Historical Data and Forecast of Kenya Food Minerals Market Revenues & Volume By Zinc for the Period 2022-2032F
- Historical Data and Forecast of Kenya Food Minerals Market Revenues & Volume By Magnesium for the Period 2022-2032F
- Historical Data and Forecast of Kenya Food Minerals Market Revenues & Volume By Calcium for the Period 2022-2032F
- Historical Data and Forecast of Kenya Food Minerals Market Revenues & Volume By Iodine for the Period 2022-2032F
- Historical Data and Forecast of Kenya Food Minerals Market Revenues & Volume By Copper for the Period 2022-2032F
- Historical Data and Forecast of Kenya Food Minerals Market Revenues & Volume By Chromium for the Period 2022-2032F
- Historical Data and Forecast of Kenya Food Minerals Market Revenues & Volume By Iron for the Period 2022-2032F
- Historical Data and Forecast of Kenya Food Minerals Market Revenues & Volume By Source for the Period 2022-2032F
- Historical Data and Forecast of Kenya Food Minerals Market Revenues & Volume By Marine for the Period 2022-2032F
- Historical Data and Forecast of Kenya Food Minerals Market Revenues & Volume By Fruits for the Period 2022-2032F
- Historical Data and Forecast of Kenya Food Minerals Market Revenues & Volume By Vegetables for the Period 2022-2032F
- Historical Data and Forecast of Kenya Food Minerals Market Revenues & Volume By Seaweed for the Period 2022-2032F
- Historical Data and Forecast of Kenya Food Minerals Market Revenues & Volume By Nuts for the Period 2022-2032F
- Historical Data and Forecast of Kenya Food Minerals Market Revenues & Volume By Application for the Period 2022-2032F
- Historical Data and Forecast of Kenya Food Minerals Market Revenues & Volume By Nutraceutical Industries for the Period 2022-2032F
- Historical Data and Forecast of Kenya Food Minerals Market Revenues & Volume By Pharmaceutical industries for the Period 2022-2032F
- Historical Data and Forecast of Kenya Food Minerals Market Revenues & Volume By Food & Beverage Industries for the Period 2022-2032F
- Kenya Food Minerals Import Export Trade Statistics
- Market Opportunity Assessment By Type
- Market Opportunity Assessment By Source
- Market Opportunity Assessment By Application
- Kenya Food Minerals Top Companies Market Share
- Kenya Food Minerals Competitive Benchmarking By Technical and Operational Parameters
- Kenya Food Minerals Company Profiles
- Kenya Food Minerals Key Strategic Recommendations
Frequently Asked Questions About the Market Study (FAQs):
Minerals like iron, calcium, and zinc are particularly sought after, driven by growing awareness of their essential roles in health.
The government has implemented various policies promoting food fortification and established programs aimed at reducing micronutrient deficiencies, demonstrating a commitment to public health.
Key drivers include increasing disposable incomes, heightened consumer awareness regarding nutrition, and ongoing government initiatives aimed at improving dietary standards.
The Kenya Food Minerals Market was estimated at USD 301 Million in 2025 and is projected to reach USD 399 Million by 2032, growing at a CAGR of 4.1% from 2026 to 2032.
New entrants can focus on niche segments, particularly in developing fortified products for vulnerable groups, while also capitalizing on technological advancements in distribution and product innovation.
Yes, logistical challenges in reaching remote areas and varying consumer awareness levels regarding the importance of food minerals may hinder market penetration.
6Wresearch actively monitors the Kenya Food Minerals Market and publishes its comprehensive annual report, highlighting emerging trends, growth drivers, revenue analysis, and forecast outlook. Our insights help businesses to make data-backed strategic decisions with ongoing market dynamics. Our analysts track relevent industries related to the Kenya Food Minerals Market, allowing our clients with actionable intelligence and reliable forecasts tailored to emerging regional needs.
Yes, we provide customisation as per your requirements. To learn more, feel free to contact us on sales@6wresearch.com
1 Executive Summary |
2 Introduction |
2.1 Key Highlights of the Report |
2.2 Report Description |
2.3 Market Scope & Segmentation |
2.4 Research Methodology |
2.5 Assumptions |
3 Kenya Food Minerals Market Overview |
3.1 Kenya Country Macro Economic Indicators |
3.2 Kenya Food Minerals Market Revenues & Volume, 2022 & 2032F |
3.3 Kenya Food Minerals Market - Industry Life Cycle |
3.4 Kenya Food Minerals Market - Porter's Five Forces |
3.5 Kenya Food Minerals Market Revenues & Volume Share, By Type, 2022 & 2032F |
3.6 Kenya Food Minerals Market Revenues & Volume Share, By Source, 2022 & 2032F |
3.7 Kenya Food Minerals Market Revenues & Volume Share, By Application, 2022 & 2032F |
4 Kenya Food Minerals Market Dynamics |
4.1 Impact Analysis |
4.2 Market Drivers |
4.2.1 Increasing awareness about the importance of nutrition and dietary supplements |
4.2.2 Growing health consciousness among consumers |
4.2.3 Government initiatives promoting food fortification and mineral enrichment |
4.3 Market Restraints |
4.3.1 Price volatility of raw materials impacting production costs |
4.3.2 Fluctuating exchange rates affecting import/export of food minerals |
4.3.3 Lack of infrastructure and distribution channels in remote areas |
5 Kenya Food Minerals Market Trends |
6 Kenya Food Minerals Market, By Types |
6.1 Kenya Food Minerals Market, By Type |
6.1.1 Overview and Analysis |
6.1.2 Kenya Food Minerals Market Revenues & Volume, By Type, 2022-2032F |
6.1.3 Kenya Food Minerals Market Revenues & Volume, By Zinc, 2022-2032F |
6.1.4 Kenya Food Minerals Market Revenues & Volume, By Magnesium, 2022-2032F |
6.1.5 Kenya Food Minerals Market Revenues & Volume, By Calcium, 2022-2032F |
6.1.6 Kenya Food Minerals Market Revenues & Volume, By Iodine, 2022-2032F |
6.1.7 Kenya Food Minerals Market Revenues & Volume, By Copper, 2022-2032F |
6.1.8 Kenya Food Minerals Market Revenues & Volume, By Chromium, 2022-2032F |
6.2 Kenya Food Minerals Market, By Source |
6.2.1 Overview and Analysis |
6.2.2 Kenya Food Minerals Market Revenues & Volume, By Marine, 2022-2032F |
6.2.3 Kenya Food Minerals Market Revenues & Volume, By Fruits, 2022-2032F |
6.2.4 Kenya Food Minerals Market Revenues & Volume, By Vegetables, 2022-2032F |
6.2.5 Kenya Food Minerals Market Revenues & Volume, By Seaweed, 2022-2032F |
6.2.6 Kenya Food Minerals Market Revenues & Volume, By Nuts, 2022-2032F |
6.3 Kenya Food Minerals Market, By Application |
6.3.1 Overview and Analysis |
6.3.2 Kenya Food Minerals Market Revenues & Volume, By Nutraceutical Industries, 2022-2032F |
6.3.3 Kenya Food Minerals Market Revenues & Volume, By Pharmaceutical industries, 2022-2032F |
6.3.4 Kenya Food Minerals Market Revenues & Volume, By Food & Beverage Industries, 2022-2032F |
7 Kenya Food Minerals Market Import-Export Trade Statistics |
7.1 Kenya Food Minerals Market Export to Major Countries |
7.2 Kenya Food Minerals Market Imports from Major Countries |
8 Kenya Food Minerals Market Key Performance Indicators |
8.1 Percentage of population consuming fortified foods |
8.2 Number of new product launches in the food minerals segment |
8.3 Investment in research and development for innovative mineral-enriched food products |
9 Kenya Food Minerals Market - Opportunity Assessment |
9.1 Kenya Food Minerals Market Opportunity Assessment, By Type, 2022 & 2032F |
9.2 Kenya Food Minerals Market Opportunity Assessment, By Source, 2022 & 2032F |
9.3 Kenya Food Minerals Market Opportunity Assessment, By Application, 2022 & 2032F |
10 Kenya Food Minerals Market - Competitive Landscape |
10.1 Kenya Food Minerals Market Revenue Share, By Companies, 2025 |
10.2 Kenya Food Minerals Market Competitive Benchmarking, By Operating and Technical Parameters |
11 Company Profiles |
12 Recommendations |
13 Disclaimer |
Global Go To Market Strategy - 2030
Export potential enables firms to identify high-growth global markets with greater confidence by combining advanced trade intelligence with a structured quantitative methodology. The framework analyzes emerging demand trends and country-level import patterns while integrating macroeconomic and trade datasets such as GDP and population forecasts, bilateral import–export flows, tariff structures, elasticity differentials between developed and developing economies, geographic distance, and import demand projections. Using weighted trade values from 2020–2024 as the base period to project country-to-country export potential for 2030, these inputs are operationalized through calculated drivers such as gravity model parameters, tariff impact factors, and projected GDP per-capita growth. Through an analysis of hidden potentials, demand hotspots, and market conditions that are most favorable to success, this method enables firms to focus on target countries, maximize returns, and global expansion with data, backed by accuracy.
By factoring in the projected importer demand gap that is currently unmet and could be potential opportunity, it identifies the potential for the Exporter (Country) among 190 countries, against the general trade analysis, which identifies the biggest importer or exporter.
To discover high-growth global markets and optimize your business strategy:
Click Here
Pricing
- Single User License$ 1,995
- Department License$ 2,400
- Site License$ 3,120
- Global License$ 3,795

Leadership Perspectives from Industry Events
Search
Thought Leadership and Analyst Meet


Our Clients
6WResearch In News
- India Air Conditioner Market Set for Strong Rebound in 2026 After Weather-Led Correction and GST-Driven Recovery: 6Wresearch
- ADAS in India: How Automatic Emergency Braking, Blind Spot Detection & Driver Monitoring are Transforming Road Safety
- Doha a strategic location for EV manufacturing hub: IPA Qatar
- Demand for luxury TVs surging in the GCC, says Samsung
- Empowering Growth: The Thriving Journey of Bangladesh’s Cable Industry
- Demand for luxury TVs surging in the GCC, says Samsung
Latest Reports
- Nicaragua RPG Gaming Market (2026-2032)
- New Zealand RPG Gaming Market (2026-2032)
- Netherlands RPG Gaming Market (2026-2032)
- Nauru RPG Gaming Market (2026-2032)
- Namibia RPG Gaming Market (2026-2032)
- Mozambique RPG Gaming Market (2026-2032)
- Montenegro RPG Gaming Market (2026-2032)
- Mongolia RPG Gaming Market (2026-2032)
- Monaco RPG Gaming Market (2026-2032)
- Micronesia RPG Gaming Market (2026-2032)
Industry Events and Analyst Meet

EV India Expo 2026

HIMTEX 2026

India Refining Summit 2026

India EV Show 2026

EV tech India Expo 2026
Whitepaper
- Middle East & Africa Commercial Security Market Click here to view more.
- Middle East & Africa Fire Safety Systems & Equipment Market Click here to view more.
- GCC Drone Market Click here to view more.
- Middle East Lighting Fixture Market Click here to view more.
- GCC Physical & Perimeter Security Market Click here to view more.