Kenya Ink Market Outlook | Analysis, Industry, Trends, Companies, Forecast, Size, Growth, Revenue, Share, Value & COVID-19 IMPACT
Market Forecast By Technology (Lithographic , Flexographic , Gravure, Digital, Letterpress, Others), By Ink Type (Oil Based, Solvent Based, Water Based), By Applications (Label And Packaging, Commercial Printing, Publications, Others) And Competitive Landscape
| Product Code: ETC253370 | Publication Date: Aug 2022 | Updated Date: Aug 2025 | Product Type: Market Research Report | |
| Publisher: 6Wresearch | Author: Ravi Bhandari | No. of Pages: 75 | No. of Figures: 35 | No. of Tables: 20 |
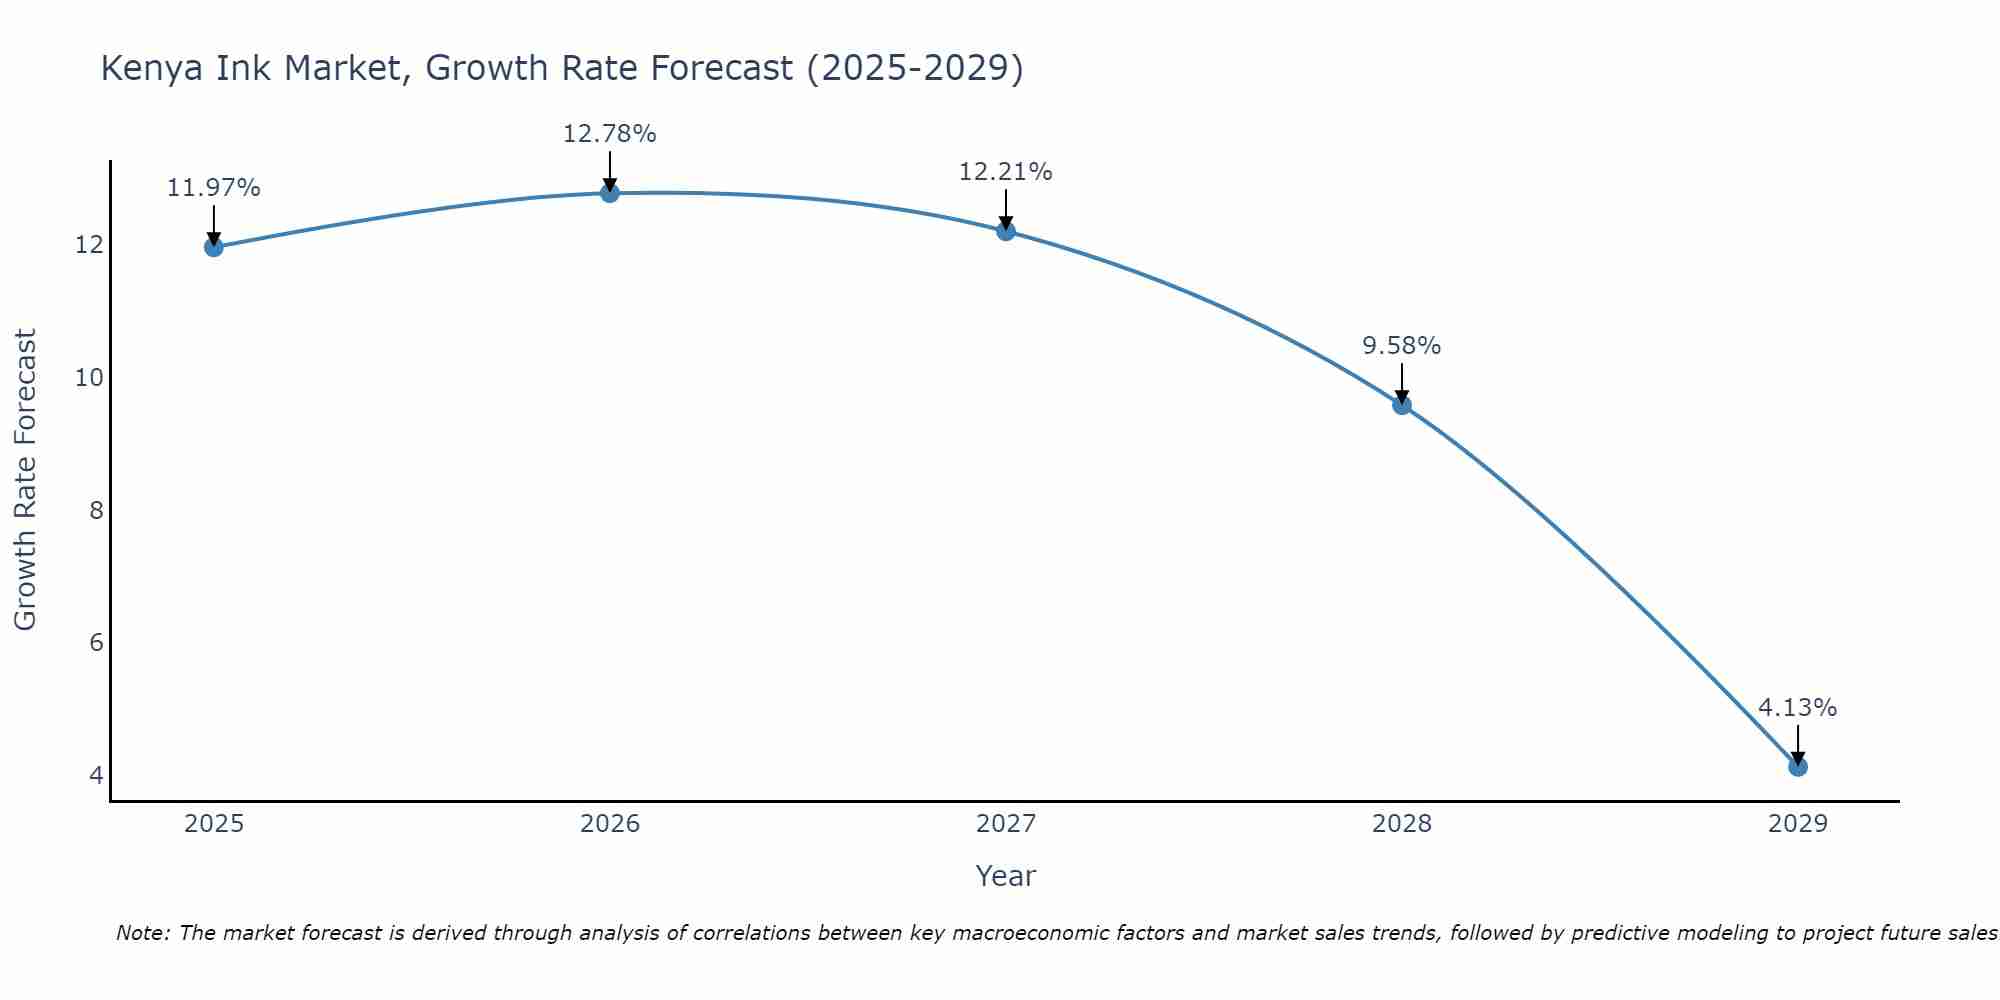
Kenya Ink Market Size Growth Rate
The Kenya Ink Market is projected to witness mixed growth rate patterns during 2025 to 2029. Growth accelerates to 12.78% in 2026, following an initial rate of 11.97%, before easing to 4.13% at the end of the period.
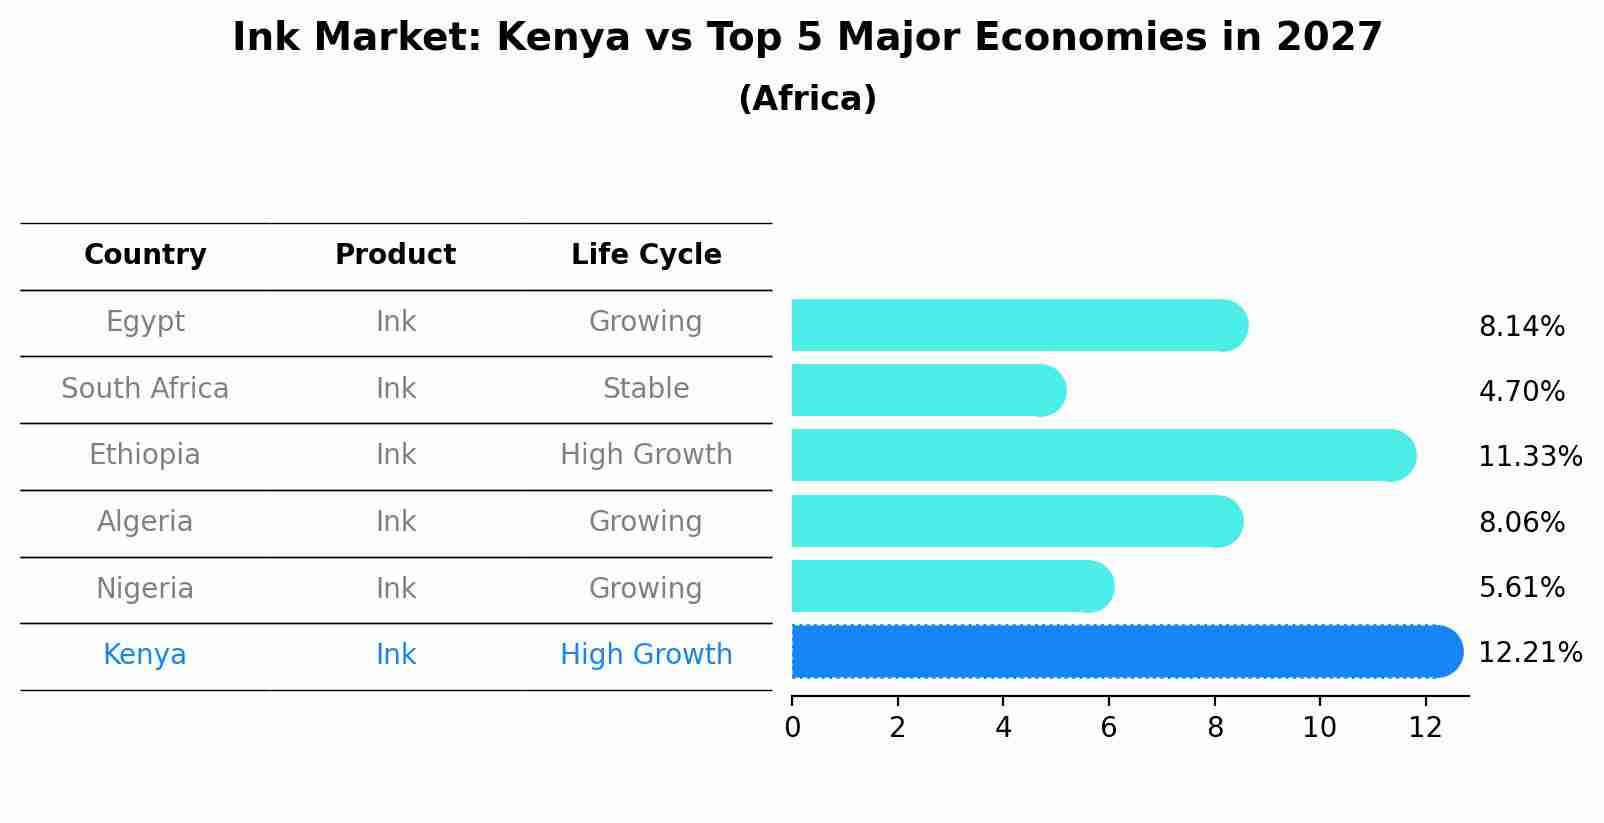
Ink Market: Kenya vs Top 5 Major Economies in 2027 (Africa)
Kenya's Ink market is anticipated to experience a high growth rate of 12.21% by 2027, reflecting trends observed in the largest economy Egypt, followed by South Africa, Ethiopia, Algeria and Nigeria.
Kenya Ink Market Overview
Kenya ink market is expanding due to the growing demand for printing and packaging applications. Inks are used in various printing processes, including offset, flexographic, and digital printing. The market is driven by the increasing need for printed materials in advertising, publishing, and packaging industries, as well as advancements in ink formulations and printing technologies.
Drivers of the market
The Kenya ink market is witnessing robust growth propelled by the increasing demand for printing and packaging solutions in various industries such as publishing, advertising, and manufacturing. Inks are essential for printing text, images, and barcodes on various substrates such as paper, plastics, and metals. Moreover, technological advancements in ink formulations, growing demand for digital printing technologies, and expanding applications in packaging and labeling are driving market demand in Kenya.
Challenges of the market
Kenya, challenges in the ink market include ensuring ink quality, consistency, and compatibility with diverse printing applications. Addressing environmental regulations compliance, managing ink formulation costs, and adapting to changing printing technologies pose hurdles for ink manufacturers.
Government Policy of the market
The Kenya government`s efforts to promote the printing industry, cultural preservation, and education could drive the demand for ink products. Policies supporting publishing initiatives, school supplies procurement, and copyright protection may shape market dynamics in this segment.
Key Highlights of the Report:
- Kenya Ink Market Outlook
- Market Size of Kenya Ink Market, 2021
- Forecast of Kenya Ink Market, 2028
- Historical Data and Forecast of Kenya Ink Revenues & Volume for the Period 2018 - 2028
- Kenya Ink Market Trend Evolution
- Kenya Ink Market Drivers and Challenges
- Kenya Ink Price Trends
- Kenya Ink Porter's Five Forces
- Kenya Ink Industry Life Cycle
- Historical Data and Forecast of Kenya Ink Market Revenues & Volume By Technology for the Period 2018 - 2028
- Historical Data and Forecast of Kenya Ink Market Revenues & Volume By Lithographic for the Period 2018 - 2028
- Historical Data and Forecast of Kenya Ink Market Revenues & Volume By Flexographic for the Period 2018 - 2028
- Historical Data and Forecast of Kenya Ink Market Revenues & Volume By Gravure for the Period 2018 - 2028
- Historical Data and Forecast of Kenya Ink Market Revenues & Volume By Digital for the Period 2018 - 2028
- Historical Data and Forecast of Kenya Ink Market Revenues & Volume By Letterpress for the Period 2018 - 2028
- Historical Data and Forecast of Kenya Ink Market Revenues & Volume By Others for the Period 2018 - 2028
- Historical Data and Forecast of Kenya Ink Market Revenues & Volume By Ink Type for the Period 2018 - 2028
- Historical Data and Forecast of Kenya Ink Market Revenues & Volume By Oil Based for the Period 2018 - 2028
- Historical Data and Forecast of Kenya Ink Market Revenues & Volume By Solvent Based for the Period 2018 - 2028
- Historical Data and Forecast of Kenya Ink Market Revenues & Volume By Water Based for the Period 2018 - 2028
- Historical Data and Forecast of Kenya Ink Market Revenues & Volume By Applications for the Period 2018 - 2028
- Historical Data and Forecast of Kenya Ink Market Revenues & Volume By Label And Packaging for the Period 2018 - 2028
- Historical Data and Forecast of Kenya Ink Market Revenues & Volume By Commercial Printing for the Period 2018 - 2028
- Historical Data and Forecast of Kenya Ink Market Revenues & Volume By Publications for the Period 2018 - 2028
- Historical Data and Forecast of Kenya Ink Market Revenues & Volume By Others for the Period 2018 - 2028
- Kenya Ink Import Export Trade Statistics
- Market Opportunity Assessment By Technology
- Market Opportunity Assessment By Ink Type
- Market Opportunity Assessment By Applications
- Kenya Ink Top Companies Market Share
- Kenya Ink Competitive Benchmarking By Technical and Operational Parameters
- Kenya Ink Company Profiles
- Kenya Ink Key Strategic Recommendations
Frequently Asked Questions About the Market Study (FAQs):
6Wresearch actively monitors the Kenya Ink Market and publishes its comprehensive annual report, highlighting emerging trends, growth drivers, revenue analysis, and forecast outlook. Our insights help businesses to make data-backed strategic decisions with ongoing market dynamics. Our analysts track relevent industries related to the Kenya Ink Market, allowing our clients with actionable intelligence and reliable forecasts tailored to emerging regional needs.
Yes, we provide customisation as per your requirements. To learn more, feel free to contact us on sales@6wresearch.com
1 Executive Summary |
2 Introduction |
2.1 Key Highlights of the Report |
2.2 Report Description |
2.3 Market Scope & Segmentation |
2.4 Research Methodology |
2.5 Assumptions |
3 Kenya Ink Market Overview |
3.1 Kenya Country Macro Economic Indicators |
3.2 Kenya Ink Market Revenues & Volume, 2021 & 2028F |
3.3 Kenya Ink Market - Industry Life Cycle |
3.4 Kenya Ink Market - Porter's Five Forces |
3.5 Kenya Ink Market Revenues & Volume Share, By Technology, 2021 & 2028F |
3.6 Kenya Ink Market Revenues & Volume Share, By Ink Type, 2021 & 2028F |
3.7 Kenya Ink Market Revenues & Volume Share, By Applications, 2021 & 2028F |
4 Kenya Ink Market Dynamics |
4.1 Impact Analysis |
4.2 Market Drivers |
4.2.1 Increasing demand for printing and packaging solutions in various industries |
4.2.2 Growth in the education sector leading to higher demand for print materials |
4.2.3 Technological advancements in the ink industry leading to innovative products |
4.3 Market Restraints |
4.3.1 Fluctuations in raw material prices impacting production costs |
4.3.2 Competition from digital media impacting the demand for traditional print materials |
4.3.3 Environmental regulations affecting the manufacturing and disposal of ink products |
5 Kenya Ink Market Trends |
6 Kenya Ink Market, By Types |
6.1 Kenya Ink Market, By Technology |
6.1.1 Overview and Analysis |
6.1.2 Kenya Ink Market Revenues & Volume, By Technology, 2018 - 2028F |
6.1.3 Kenya Ink Market Revenues & Volume, By Lithographic , 2018 - 2028F |
6.1.4 Kenya Ink Market Revenues & Volume, By Flexographic , 2018 - 2028F |
6.1.5 Kenya Ink Market Revenues & Volume, By Gravure, 2018 - 2028F |
6.1.6 Kenya Ink Market Revenues & Volume, By Digital, 2018 - 2028F |
6.1.7 Kenya Ink Market Revenues & Volume, By Letterpress, 2018 - 2028F |
6.1.8 Kenya Ink Market Revenues & Volume, By Others, 2018 - 2028F |
6.2 Kenya Ink Market, By Ink Type |
6.2.1 Overview and Analysis |
6.2.2 Kenya Ink Market Revenues & Volume, By Oil Based, 2018 - 2028F |
6.2.3 Kenya Ink Market Revenues & Volume, By Solvent Based, 2018 - 2028F |
6.2.4 Kenya Ink Market Revenues & Volume, By Water Based, 2018 - 2028F |
6.3 Kenya Ink Market, By Applications |
6.3.1 Overview and Analysis |
6.3.2 Kenya Ink Market Revenues & Volume, By Label And Packaging, 2018 - 2028F |
6.3.3 Kenya Ink Market Revenues & Volume, By Commercial Printing, 2018 - 2028F |
6.3.4 Kenya Ink Market Revenues & Volume, By Publications, 2018 - 2028F |
6.3.5 Kenya Ink Market Revenues & Volume, By Others, 2018 - 2028F |
7 Kenya Ink Market Import-Export Trade Statistics |
7.1 Kenya Ink Market Export to Major Countries |
7.2 Kenya Ink Market Imports from Major Countries |
8 Kenya Ink Market Key Performance Indicators |
8.1 Research and development investment in sustainable ink solutions |
8.2 Adoption rate of digital printing technologies in the market |
8.3 Growth in the packaging industry and its correlation with ink consumption |
8.4 Customer satisfaction levels with ink quality and performance |
8.5 Rate of adoption of eco-friendly ink products |
9 Kenya Ink Market - Opportunity Assessment |
9.1 Kenya Ink Market Opportunity Assessment, By Technology, 2021 & 2028F |
9.2 Kenya Ink Market Opportunity Assessment, By Ink Type, 2021 & 2028F |
9.3 Kenya Ink Market Opportunity Assessment, By Applications, 2021 & 2028F |
10 Kenya Ink Market - Competitive Landscape |
10.1 Kenya Ink Market Revenue Share, By Companies, 2021 |
10.2 Kenya Ink Market Competitive Benchmarking, By Operating and Technical Parameters |
11 Company Profiles |
12 Recommendations |
13 Disclaimer |
Global Go To Market Strategy - 2030
Export potential enables firms to identify high-growth global markets with greater confidence by combining advanced trade intelligence with a structured quantitative methodology. The framework analyzes emerging demand trends and country-level import patterns while integrating macroeconomic and trade datasets such as GDP and population forecasts, bilateral import–export flows, tariff structures, elasticity differentials between developed and developing economies, geographic distance, and import demand projections. Using weighted trade values from 2020–2024 as the base period to project country-to-country export potential for 2030, these inputs are operationalized through calculated drivers such as gravity model parameters, tariff impact factors, and projected GDP per-capita growth. Through an analysis of hidden potentials, demand hotspots, and market conditions that are most favorable to success, this method enables firms to focus on target countries, maximize returns, and global expansion with data, backed by accuracy.
By factoring in the projected importer demand gap that is currently unmet and could be potential opportunity, it identifies the potential for the Exporter (Country) among 190 countries, against the general trade analysis, which identifies the biggest importer or exporter.
To discover high-growth global markets and optimize your business strategy:
Click Here
Pricing
- Single User License$ 1,995
- Department License$ 2,400
- Site License$ 3,120
- Global License$ 3,795

Leadership Perspectives from Industry Events
Search
Thought Leadership and Analyst Meet


Our Clients
6WResearch In News
- India Export Attractiveness Tracker 2026
- India Air Conditioner Market Set for Strong Rebound in 2026 After Weather-Led Correction and GST-Driven Recovery: 6Wresearch
- ADAS in India: How Automatic Emergency Braking, Blind Spot Detection & Driver Monitoring are Transforming Road Safety
- Doha a strategic location for EV manufacturing hub: IPA Qatar
- Demand for luxury TVs surging in the GCC, says Samsung
- Empowering Growth: The Thriving Journey of Bangladesh’s Cable Industry
Latest Reports
- Nicaragua RPG Gaming Market (2026-2032)
- New Zealand RPG Gaming Market (2026-2032)
- Netherlands RPG Gaming Market (2026-2032)
- Nauru RPG Gaming Market (2026-2032)
- Namibia RPG Gaming Market (2026-2032)
- Mozambique RPG Gaming Market (2026-2032)
- Montenegro RPG Gaming Market (2026-2032)
- Mongolia RPG Gaming Market (2026-2032)
- Monaco RPG Gaming Market (2026-2032)
- Micronesia RPG Gaming Market (2026-2032)
Industry Events and Analyst Meet

EV India Expo 2026

HIMTEX 2026

India Refining Summit 2026

India EV Show 2026

EV tech India Expo 2026
Whitepaper
- Middle East & Africa Commercial Security Market Click here to view more.
- Middle East & Africa Fire Safety Systems & Equipment Market Click here to view more.
- GCC Drone Market Click here to view more.
- Middle East Lighting Fixture Market Click here to view more.
- GCC Physical & Perimeter Security Market Click here to view more.