Kenya Video Game Accessories Market (2026-2032) | Outlook, Revenue, Trends, Analysis, Forecast, Industry, Growth, Companies, Size, Share & Value
Market Forecast By Product Type (Gamepads, Keyboards, Mice, Headset, Surfaces, Controllers/Joysticks, Virtual Reality Devices, Others), By End-users (Casual Gaming, Professional Gaming) And Competitive Landscape
| Product Code: ETC012550 | Publication Date: Oct 2020 | Updated Date: Jun 2026 | Product Type: Report | |
| Publisher: 6Wresearch | Author: Ravi Bhandari | No. of Pages: 70 | No. of Figures: 35 | No. of Tables: 5 |
Kenya Video Game Accessories Market Summary
The kenya video game accessories market was estimated at USD 492 Million in 2025 and is projected to reach USD 679 Million by 2032, growing at a CAGR of 5.3% from 2026 to 2032.
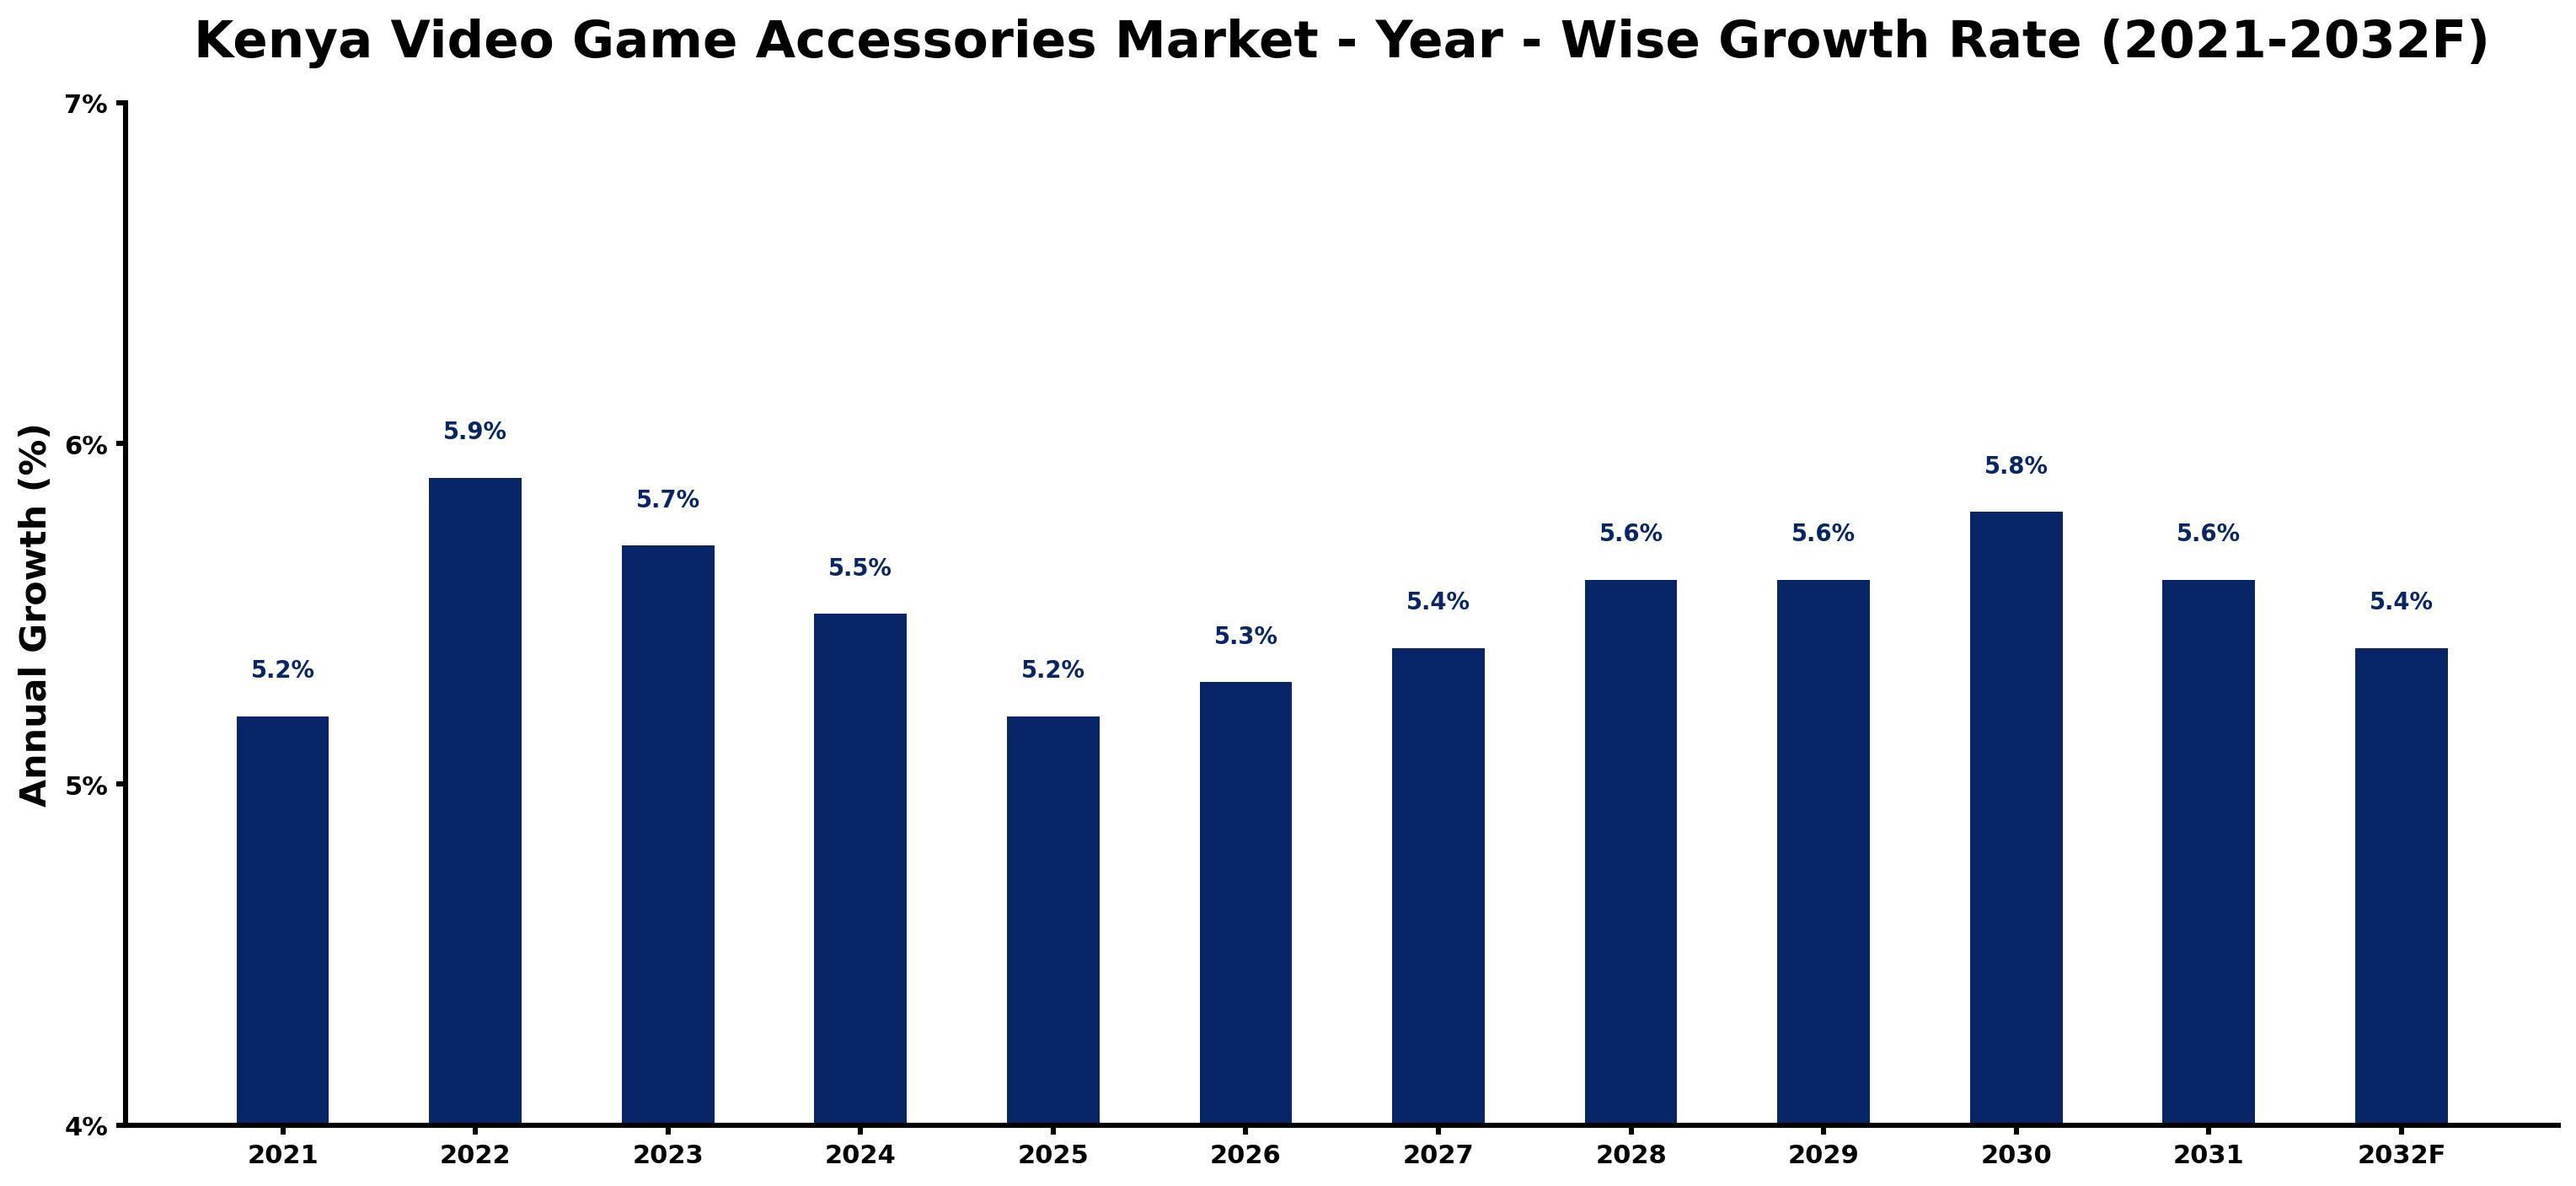
Kenya Video Game Accessories Market Growth Rate Analysis (2021-2032)
The Kenya video game accessories market has exhibited a stable growth pattern, with year-on-year increases reflecting thriving consumer demand and substantial investments in digital infrastructure. The market recorded growth rates of 5.2% in 2021 and 5.9% in 2022, driven by rising disposable incomes and a growing youth demographic keen on gaming. Although growth slightly moderated to 5.7% in 2023, a resurgence was noted in subsequent years, stabilizing around 5.5% to 5.8% through 2030. This fluctuation can be attributed to technological advancements in gaming platforms and increasing availability of accessories. As consumers embrace digital gaming, manufacturers are likely to intensify their focus on innovation, further solidifying market prospects in the years to come.
Kenya Video Game Accessories Market Year-wise Growth Rate and Key Drivers
This graph highlights how the Kenya Video Game Accessories Market has steadily grown over the past five years, supported by major growth factors.
The table below presents the year wise growth rates along with the key drivers influencing the market
| Year | Growth Rate | Major Drivers |
| 2021 | 5.2% | Kenya's youth demographic increasingly embraces gaming culture, influencing accessory purchases significantly. |
| 2022 | 5.9% | E-commerce platforms expand rapidly, enhancing accessibility of gaming accessories across urban areas. |
| 2023 | 5.7% | Local brands emerge, offering innovative products tailored to Kenyan gamers' unique preferences. |
| 2024 | 5.5% | Mobile gaming experiences grow, prompting demand for portable gaming accessories and peripherals. |
| 2025 | 5.2% | Competitive gaming events foster community engagement, boosting interest in high-quality gaming gear. |
| 2026 | 5.3% | Smartphone penetration increases, encouraging accessory markets to diversify product offerings for mobile users. |
| 2027 | 5.4% | Internet connectivity improves, enabling smoother online gaming experiences and accessory sales growth. |
| 2028 | 5.6% | Partnerships with local gaming cafes enhance brand visibility, driving accessory sales through increased foot traffic. |
| 2029 | 5.6% | Social media influencers promote gaming products, effectively targeting younger audiences and driving interest. |
| 2030 | 5.8% | Technological innovations in gaming accessories allow for more immersive experiences, attracting diverse customers. |
| 2031 | 5.6% | Esports popularity skyrockets, leading to a surge in demand for specialized gaming equipment and accessories. |
| 2032 | 5.4% | Sustainable materials gain traction, influencing accessory design and attracting environmentally conscious consumers. |
Note - Market size estimations and growth projections presented in this report are based on 6Wresearch's advanced forecasting approach, validated with industry datasets as of June 2026.
Key Highlights of the Report:
- Kenya Video Game Accessories Market Outlook
- Market Size of Kenya Video Game Accessories Market, 2025
- Forecast of Kenya Video Game Accessories Market, 2032F
- Historical Data and Forecast of Kenya Video Game Accessories Revenues & Volume for the Period 2022-2032F
- Kenya Video Game Accessories Market Trend Evolution
- Kenya Video Game Accessories Market Drivers and Challenges
- Kenya Video Game Accessories Price Trends
- Kenya Video Game Accessories Porter's Five Forces
- Kenya Video Game Accessories Industry Life Cycle
- Historical Data and Forecast of Kenya Video Game Accessories Market Revenues & Volume By Product Type for the Period 2022-2032F
- Historical Data and Forecast of Kenya Video Game Accessories Market Revenues & Volume By Gamepads for the Period 2022-2032F
- Historical Data and Forecast of Kenya Video Game Accessories Market Revenues & Volume By Keyboards for the Period 2022-2032F
- Historical Data and Forecast of Kenya Video Game Accessories Market Revenues & Volume By Mice for the Period 2022-2032F
- Historical Data and Forecast of Kenya Video Game Accessories Market Revenues & Volume By Headset for the Period 2022-2032F
- Historical Data and Forecast of Kenya Video Game Accessories Market Revenues & Volume By Surfaces for the Period 2022-2032F
- Historical Data and Forecast of Kenya Video Game Accessories Market Revenues & Volume By Controllers/Joysticks for the Period 2022-2032F
- Historical Data and Forecast of Kenya Video Game Accessories Market Revenues & Volume By Virtual Reality Devices for the Period 2022-2032F
- Historical Data and Forecast of Kenya Gamepads Video Game Accessories Market Revenues & Volume By Others for the Period 2022-2032F
- Historical Data and Forecast of Kenya Video Game Accessories Market Revenues & Volume By End-users for the Period 2022-2032F
- Historical Data and Forecast of Kenya Video Game Accessories Market Revenues & Volume By Casual Gaming? for the Period 2022-2032F
- Historical Data and Forecast of Kenya Video Game Accessories Market Revenues & Volume By Professional Gaming for the Period 2022-2032F
- Kenya Video Game Accessories Import Export Trade Statistics
- Market Opportunity Assessment By Product Type
- Market Opportunity Assessment By End-users
- Kenya Video Game Accessories Top Companies Market Share
- Kenya Video Game Accessories Competitive Benchmarking By Technical and Operational Parameters
- Kenya Video Game Accessories Company Profiles
- Kenya Video Game Accessories Key Strategic Recommendations
Frequently Asked Questions About the Market Study (FAQs):
6Wresearch actively monitors the Kenya Video Game Accessories Market and publishes its comprehensive annual report, highlighting emerging trends, growth drivers, revenue analysis, and forecast outlook. Our insights help businesses to make data-backed strategic decisions with ongoing market dynamics. Our analysts track relevent industries related to the Kenya Video Game Accessories Market, allowing our clients with actionable intelligence and reliable forecasts tailored to emerging regional needs.
Yes, we provide customisation as per your requirements. To learn more, feel free to contact us on sales@6wresearch.com
1 Executive Summary |
2 Introduction |
2.1 Key Highlights of the Report |
2.2 Report Description |
2.3 Market Scope & Segmentation |
2.4 Research Methodology |
2.5 Assumptions |
3 Kenya Video Game Accessories Market Overview |
3.1 Kenya Country Macro Economic Indicators |
3.2 Kenya Video Game Accessories Market Revenues & Volume, 2022 & 2032F |
3.3 Kenya Video Game Accessories Market - Industry Life Cycle |
3.4 Kenya Video Game Accessories Market - Porter's Five Forces |
3.5 Kenya Video Game Accessories Market Revenues & Volume Share, By Product Type, 2022 & 2032F |
3.6 Kenya Video Game Accessories Market Revenues & Volume Share, By End-users, 2022 & 2032F |
4 Kenya Video Game Accessories Market Dynamics |
4.1 Impact Analysis |
4.2 Market Drivers |
4.3 Market Restraints |
5 Kenya Video Game Accessories Market Trends |
6 Kenya Video Game Accessories Market, By Types |
6.1 Kenya Video Game Accessories Market, By Product Type |
6.1.1 Overview and Analysis |
6.1.2 Kenya Video Game Accessories Market Revenues & Volume, By Product Type, 2022 - 2032F |
6.1.3 Kenya Video Game Accessories Market Revenues & Volume, By Gamepads, 2022 - 2032F |
6.1.4 Kenya Video Game Accessories Market Revenues & Volume, By Keyboards, 2022 - 2032F |
6.1.5 Kenya Video Game Accessories Market Revenues & Volume, By Mice, 2022 - 2032F |
6.1.6 Kenya Video Game Accessories Market Revenues & Volume, By Headset, 2022 - 2032F |
6.1.7 Kenya Video Game Accessories Market Revenues & Volume, By Surfaces, 2022 - 2032F |
6.1.8 Kenya Video Game Accessories Market Revenues & Volume, By Controllers/Joysticks, 2022 - 2032F |
6.1.9 Kenya Video Game Accessories Market Revenues & Volume, By Others, 2022 - 2032F |
6.1.10 Kenya Video Game Accessories Market Revenues & Volume, By Others, 2022 - 2032F |
6.2 Kenya Video Game Accessories Market, By End-users |
6.2.1 Overview and Analysis |
6.2.2 Kenya Video Game Accessories Market Revenues & Volume, By Casual Gaming , 2022 - 2032F |
6.2.3 Kenya Video Game Accessories Market Revenues & Volume, By Professional Gaming, 2022 - 2032F |
7 Kenya Video Game Accessories Market Import-Export Trade Statistics |
7.1 Kenya Video Game Accessories Market Export to Major Countries |
7.2 Kenya Video Game Accessories Market Imports from Major Countries |
8 Kenya Video Game Accessories Market Key Performance Indicators |
9 Kenya Video Game Accessories Market - Opportunity Assessment |
9.1 Kenya Video Game Accessories Market Opportunity Assessment, By Product Type, 2022 & 2032F |
9.2 Kenya Video Game Accessories Market Opportunity Assessment, By End-users, 2022 & 2032F |
10 Kenya Video Game Accessories Market - Competitive Landscape |
10.1 Kenya Video Game Accessories Market Revenue Share, By Companies, 2025 |
10.2 Kenya Video Game Accessories Market Competitive Benchmarking, By Operating and Technical Parameters |
11 Company Profiles |
12 Recommendations |
13 Disclaimer |
Global Go To Market Strategy - 2030
Export potential enables firms to identify high-growth global markets with greater confidence by combining advanced trade intelligence with a structured quantitative methodology. The framework analyzes emerging demand trends and country-level import patterns while integrating macroeconomic and trade datasets such as GDP and population forecasts, bilateral import–export flows, tariff structures, elasticity differentials between developed and developing economies, geographic distance, and import demand projections. Using weighted trade values from 2020–2024 as the base period to project country-to-country export potential for 2030, these inputs are operationalized through calculated drivers such as gravity model parameters, tariff impact factors, and projected GDP per-capita growth. Through an analysis of hidden potentials, demand hotspots, and market conditions that are most favorable to success, this method enables firms to focus on target countries, maximize returns, and global expansion with data, backed by accuracy.
By factoring in the projected importer demand gap that is currently unmet and could be potential opportunity, it identifies the potential for the Exporter (Country) among 190 countries, against the general trade analysis, which identifies the biggest importer or exporter.
To discover high-growth global markets and optimize your business strategy:
Click Here
Pricing
- Single User License$ 1,995
- Department License$ 2,400
- Site License$ 3,120
- Global License$ 3,795

Leadership Perspectives from Industry Events
Search
Thought Leadership and Analyst Meet


Our Clients
6WResearch In News
- India Air Conditioner Market Set for Strong Rebound in 2026 After Weather-Led Correction and GST-Driven Recovery: 6Wresearch
- ADAS in India: How Automatic Emergency Braking, Blind Spot Detection & Driver Monitoring are Transforming Road Safety
- Doha a strategic location for EV manufacturing hub: IPA Qatar
- Demand for luxury TVs surging in the GCC, says Samsung
- Empowering Growth: The Thriving Journey of Bangladesh’s Cable Industry
- Demand for luxury TVs surging in the GCC, says Samsung
Latest Reports
- Nicaragua RPG Gaming Market (2026-2032)
- New Zealand RPG Gaming Market (2026-2032)
- Netherlands RPG Gaming Market (2026-2032)
- Nauru RPG Gaming Market (2026-2032)
- Namibia RPG Gaming Market (2026-2032)
- Mozambique RPG Gaming Market (2026-2032)
- Montenegro RPG Gaming Market (2026-2032)
- Mongolia RPG Gaming Market (2026-2032)
- Monaco RPG Gaming Market (2026-2032)
- Micronesia RPG Gaming Market (2026-2032)
Industry Events and Analyst Meet

HIMTEX 2026

India Refining Summit 2026

India EV Show 2026

EV tech India Expo 2026

Auto Tech Asia 2026
Whitepaper
- Middle East & Africa Commercial Security Market Click here to view more.
- Middle East & Africa Fire Safety Systems & Equipment Market Click here to view more.
- GCC Drone Market Click here to view more.
- Middle East Lighting Fixture Market Click here to view more.
- GCC Physical & Perimeter Security Market Click here to view more.