Latvia Built-in Refrigerator Market (2026-2032) | Share, Companies, Size & Revenue, Segmentation, Forecast, Growth, Competitive Landscape, Trends, Value, Outlook, Industry, Analysis
Market Forecast By Application (Commercial, Residential), By Distribution Channel (Offline Channel, Online Channel), By Product Type (Single Door, Double Door, Side by Side Door, French Door) And Competitive Landscape
| Product Code: ETC7906536 | Publication Date: Sep 2024 | Updated Date: Apr 2026 | Product Type: Market Research Report | |
| Publisher: 6Wresearch | Author: Vasudha | No. of Pages: 75 | No. of Figures: 35 | No. of Tables: 20 |
Latvia Built-In Refrigerator Market Size (2020-2030)
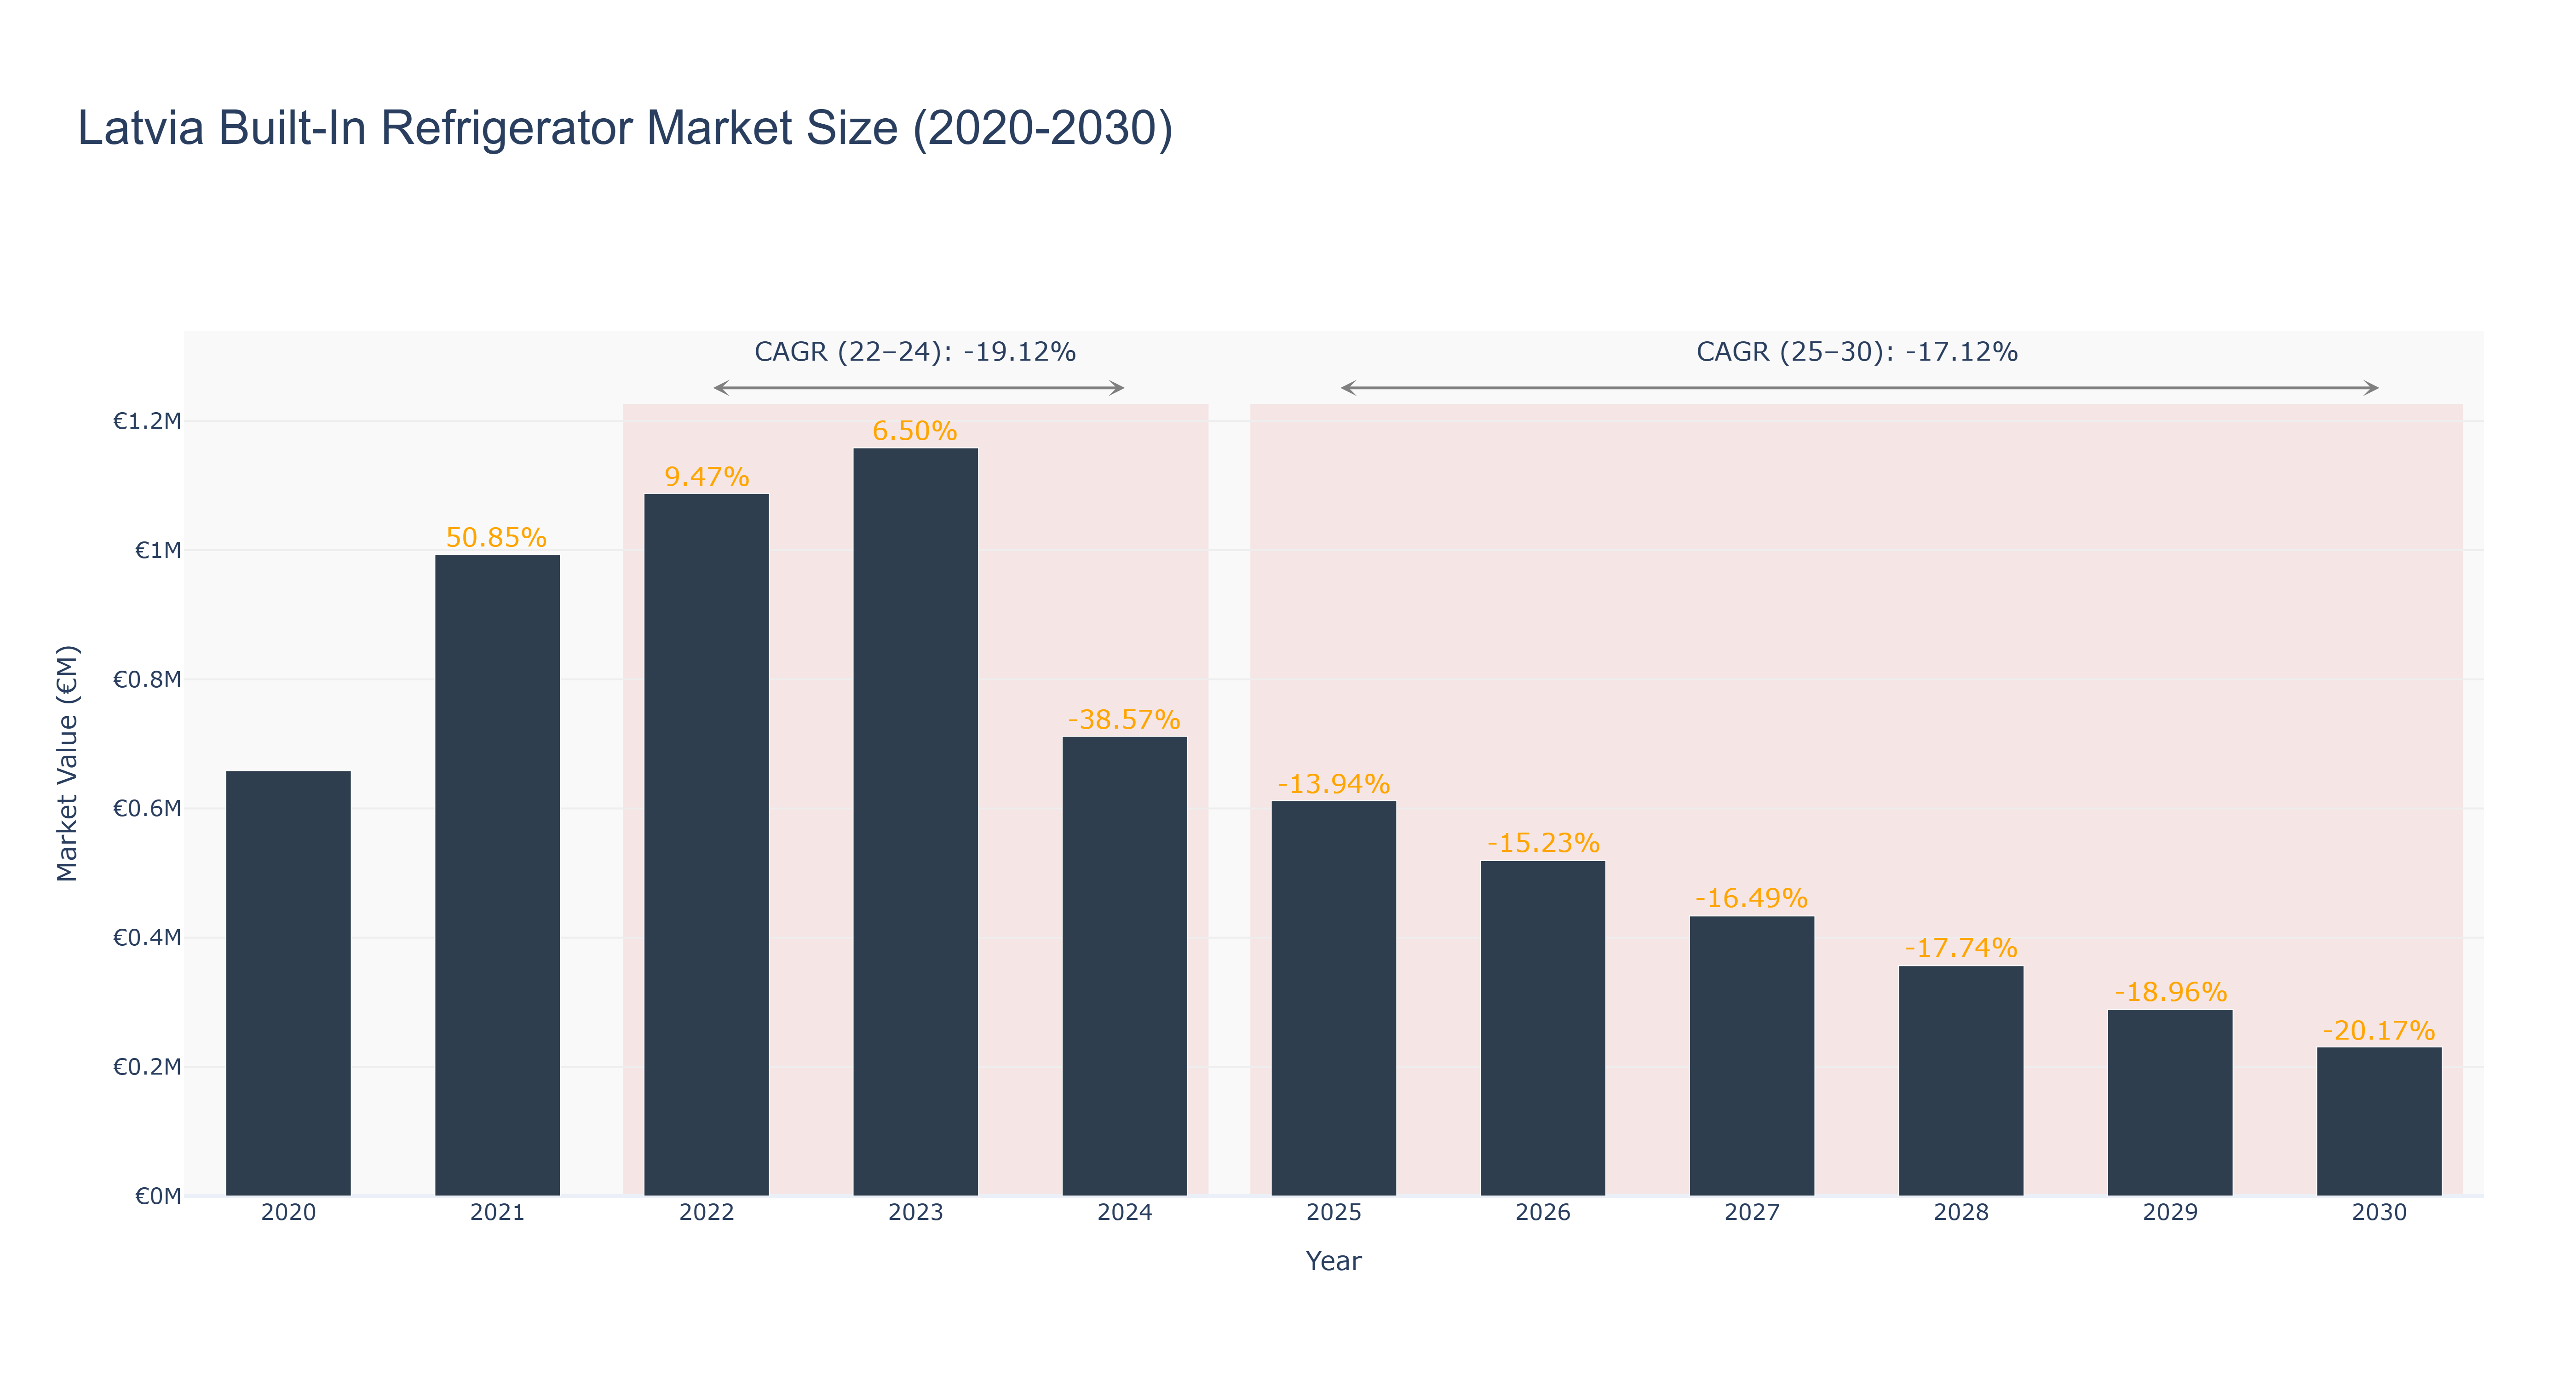
Latvia Built-In Refrigerator Market has seen a fluctuating trend in recent years. The peak market size of €1.16 million was recorded in 2023, with a subsequent decline to €0.71 million in 2024. Forecasted market sizes show a continuing downward trend, with an estimated value of €0.23 million in 2030. The CAGR for the period 2022-24 stands at -19.12%, while for 2025-30, it is projected at -17.12%. The market experienced a decline due to economic slowdown and changing consumer preferences towards more affordable options. However, recent developments in energy-efficient refrigeration technology could potentially drive market growth in the future. With the increasing focus on sustainability, the market is expected to witness advancements in eco-friendly refrigeration solutions in the coming years.
Latvia Built-In Refrigerator Market: Production & Trade Performance (2019-2025)
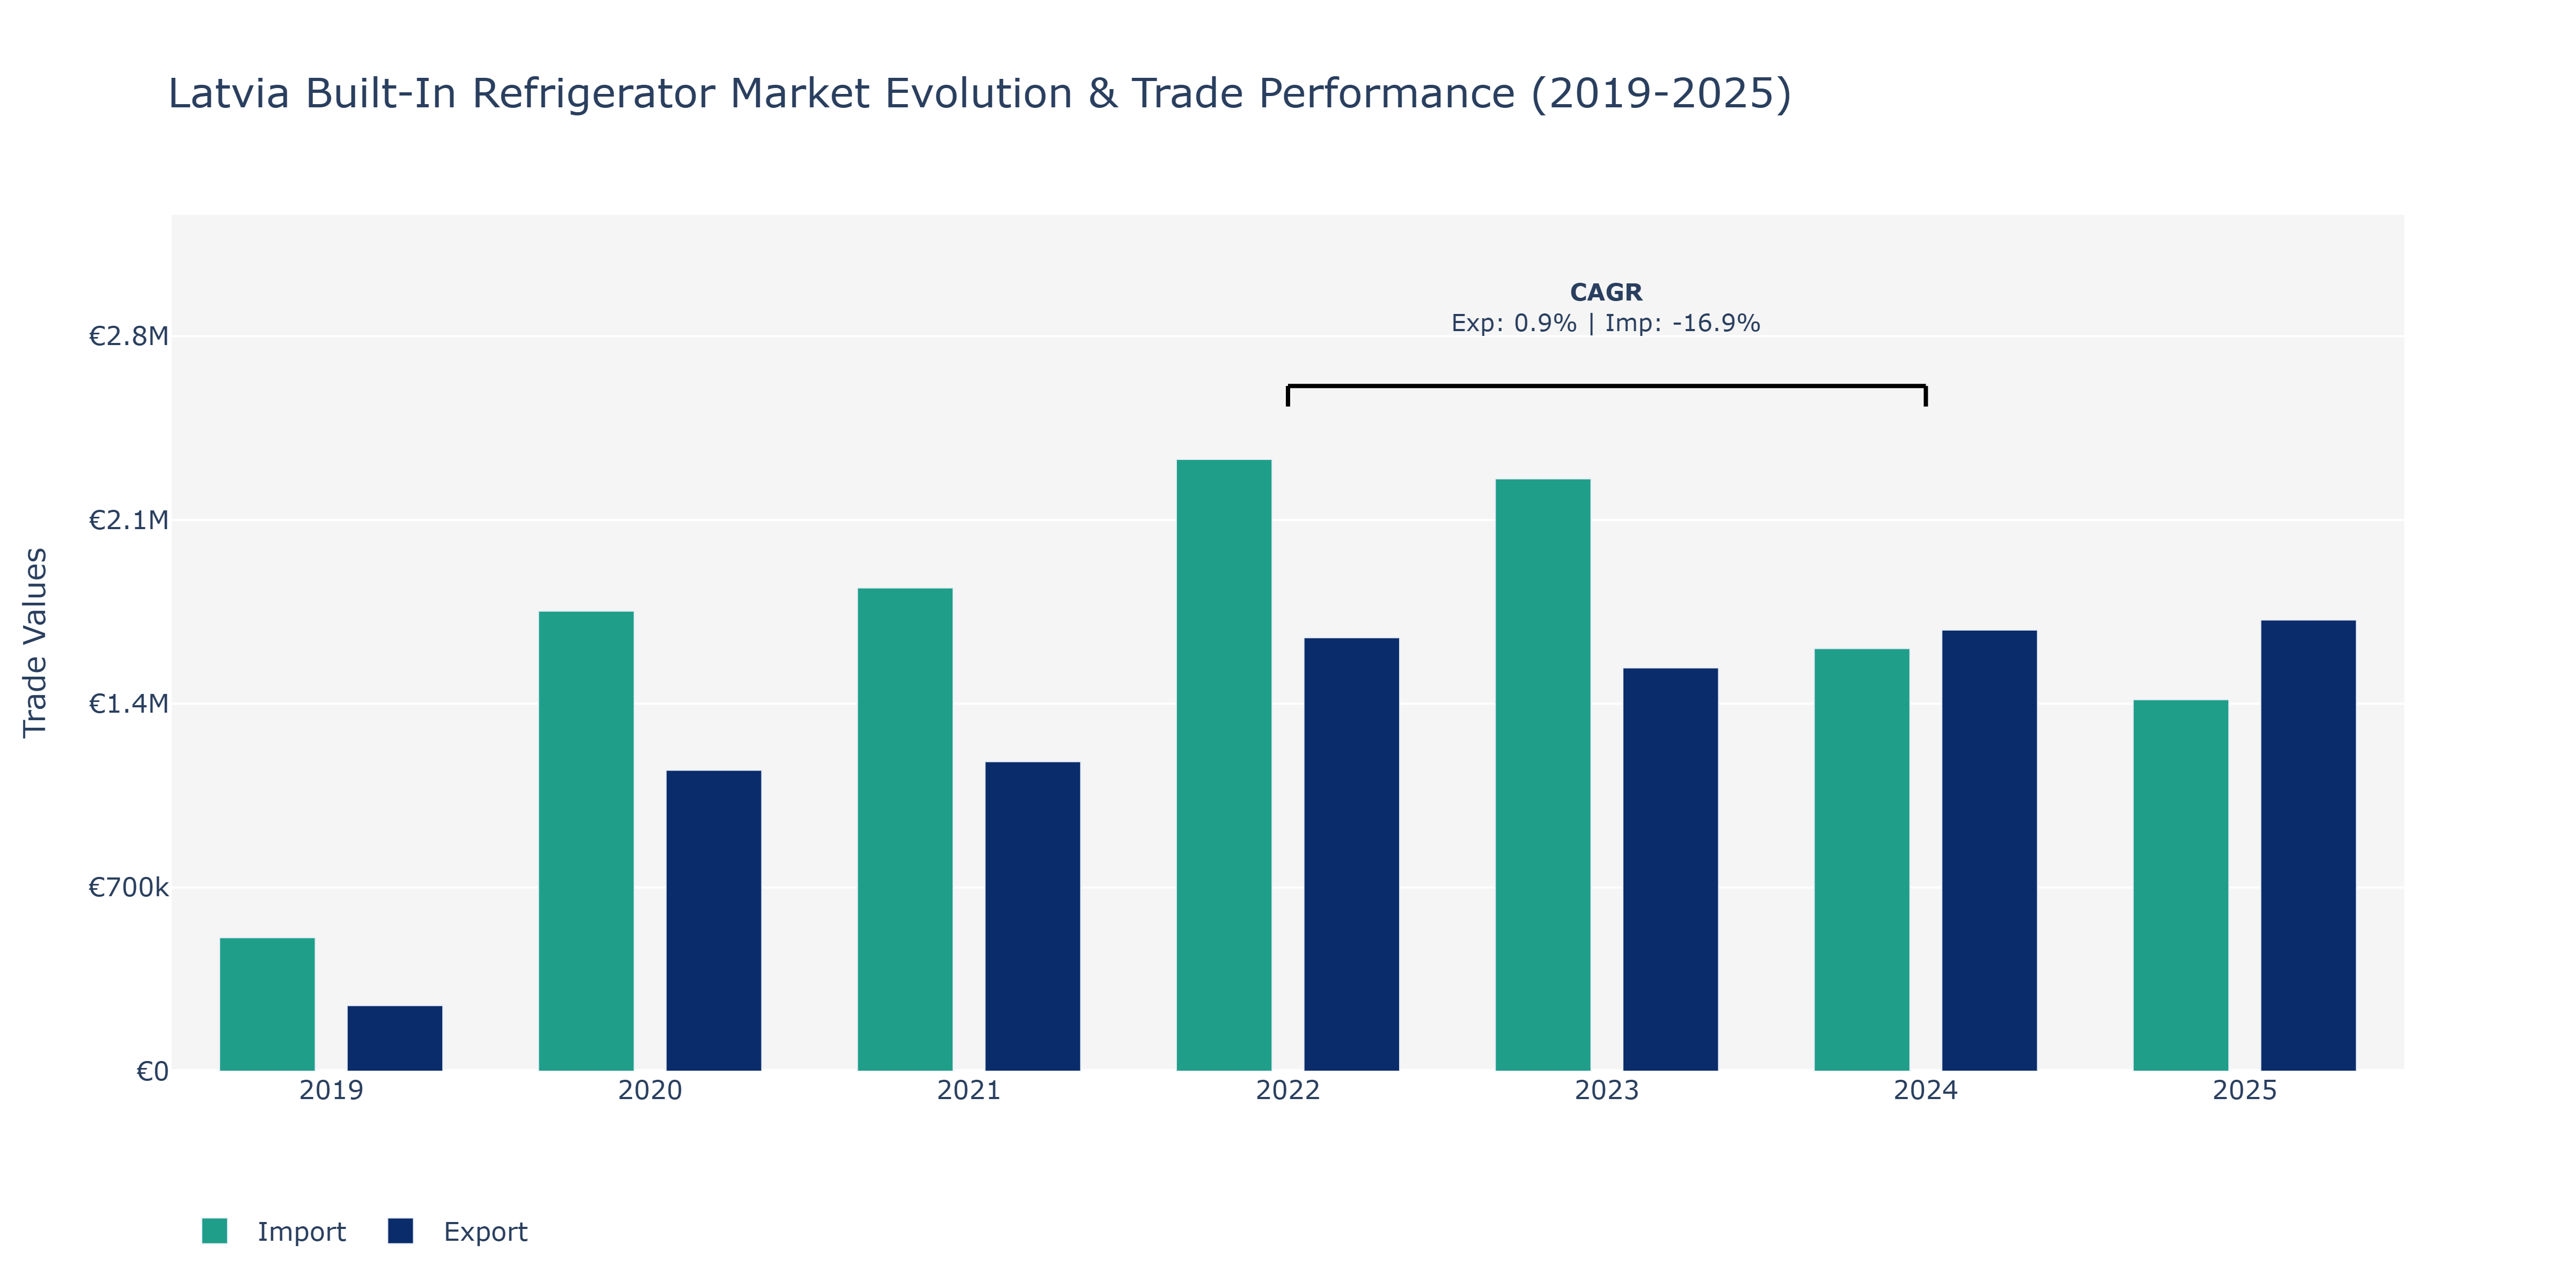
The exports and imports of built-in refrigerators in Latvia saw notable fluctuations during the observed period. In 2019, exports were at €249.91 thousand, showing a substantial increase to €1.65 million in 2022, marking a peak point in the data provided, before slightly decreasing in subsequent years. On the other hand, imports experienced a different trajectory, increasing from €508.48 thousand in 2019 to €2.33 million in 2022, the highest point in the period. However, imports declined sharply to €1.61 million in 2024, showcasing a significant drop. The decrease in imports could be attributed to shifting consumer preferences towards local manufacturing or changes in trade policies impacting the flow of goods. Conversely, the fluctuations in exports might reflect changes in production capacity or market demand within Latvia, potentially influenced by economic factors or global market conditions. To provide further context, a rise in environmental consciousness leading to increased demand for energy-efficient appliances could also have affected these trends.
Key Highlights of the Report:
- Latvia Built-in Refrigerator Market Outlook
- Market Size of Latvia Built-in Refrigerator Market, 2025
- Forecast of Latvia Built-in Refrigerator Market, 2032
- Historical Data and Forecast of Latvia Built-in Refrigerator Revenues & Volume for the Period 2022 - 2032
- Latvia Built-in Refrigerator Market Trend Evolution
- Latvia Built-in Refrigerator Market Drivers and Challenges
- Latvia Built-in Refrigerator Price Trends
- Latvia Built-in Refrigerator Porter's Five Forces
- Latvia Built-in Refrigerator Industry Life Cycle
- Historical Data and Forecast of Latvia Built-in Refrigerator Market Revenues & Volume By Application for the Period 2022 - 2032
- Historical Data and Forecast of Latvia Built-in Refrigerator Market Revenues & Volume By Commercial for the Period 2022 - 2032
- Historical Data and Forecast of Latvia Built-in Refrigerator Market Revenues & Volume By Residential for the Period 2022 - 2032
- Historical Data and Forecast of Latvia Built-in Refrigerator Market Revenues & Volume By Distribution Channel for the Period 2022 - 2032
- Historical Data and Forecast of Latvia Built-in Refrigerator Market Revenues & Volume By Offline Channel for the Period 2022 - 2032
- Historical Data and Forecast of Latvia Built-in Refrigerator Market Revenues & Volume By Online Channel for the Period 2022 - 2032
- Historical Data and Forecast of Latvia Built-in Refrigerator Market Revenues & Volume By Product Type for the Period 2022 - 2032
- Historical Data and Forecast of Latvia Built-in Refrigerator Market Revenues & Volume By Single Door for the Period 2022 - 2032
- Historical Data and Forecast of Latvia Built-in Refrigerator Market Revenues & Volume By Double Door for the Period 2022 - 2032
- Historical Data and Forecast of Latvia Built-in Refrigerator Market Revenues & Volume By Side by Side Door for the Period 2022 - 2032
- Historical Data and Forecast of Latvia Built-in Refrigerator Market Revenues & Volume By French Door for the Period 2022 - 2032
- Latvia Built-in Refrigerator Import Export Trade Statistics
- Market Opportunity Assessment By Application
- Market Opportunity Assessment By Distribution Channel
- Market Opportunity Assessment By Product Type
- Latvia Built-in Refrigerator Top Companies Market Share
- Latvia Built-in Refrigerator Competitive Benchmarking By Technical and Operational Parameters
- Latvia Built-in Refrigerator Company Profiles
- Latvia Built-in Refrigerator Key Strategic Recommendations
Frequently Asked Questions About the Market Study (FAQs):
6Wresearch actively monitors the Latvia Built-in Refrigerator Market and publishes its comprehensive annual report, highlighting emerging trends, growth drivers, revenue analysis, and forecast outlook. Our insights help businesses to make data-backed strategic decisions with ongoing market dynamics. Our analysts track relevent industries related to the Latvia Built-in Refrigerator Market, allowing our clients with actionable intelligence and reliable forecasts tailored to emerging regional needs.
Yes, we provide customisation as per your requirements. To learn more, feel free to contact us on sales@6wresearch.com
1 Executive Summary |
2 Introduction |
2.1 Key Highlights of the Report |
2.2 Report Description |
2.3 Market Scope & Segmentation |
2.4 Research Methodology |
2.5 Assumptions |
3 Latvia Built-in Refrigerator Market Overview |
3.1 Latvia Country Macro Economic Indicators |
3.2 Latvia Built-in Refrigerator Market Revenues & Volume, 2022 & 2032F |
3.3 Latvia Built-in Refrigerator Market - Industry Life Cycle |
3.4 Latvia Built-in Refrigerator Market - Porter's Five Forces |
3.5 Latvia Built-in Refrigerator Market Revenues & Volume Share, By Application, 2022 & 2032F |
3.6 Latvia Built-in Refrigerator Market Revenues & Volume Share, By Distribution Channel, 2022 & 2032F |
3.7 Latvia Built-in Refrigerator Market Revenues & Volume Share, By Product Type, 2022 & 2032F |
4 Latvia Built-in Refrigerator Market Dynamics |
4.1 Impact Analysis |
4.2 Market Drivers |
4.2.1 Increasing consumer preference for modern and integrated kitchen appliances |
4.2.2 Growing trend towards smart homes and connected devices |
4.2.3 Rising disposable income and improving living standards in Latvia |
4.3 Market Restraints |
4.3.1 High initial cost of built-in refrigerators compared to freestanding models |
4.3.2 Limited availability of skilled technicians for installation and maintenance |
4.3.3 Limited awareness and education about the benefits and features of built-in refrigerators among consumers in Latvia |
5 Latvia Built-in Refrigerator Market Trends |
6 Latvia Built-in Refrigerator Market, By Types |
6.1 Latvia Built-in Refrigerator Market, By Application |
6.1.1 Overview and Analysis |
6.1.2 Latvia Built-in Refrigerator Market Revenues & Volume, By Application, 2022 - 2032F |
6.1.3 Latvia Built-in Refrigerator Market Revenues & Volume, By Commercial, 2022 - 2032F |
6.1.4 Latvia Built-in Refrigerator Market Revenues & Volume, By Residential, 2022 - 2032F |
6.2 Latvia Built-in Refrigerator Market, By Distribution Channel |
6.2.1 Overview and Analysis |
6.2.2 Latvia Built-in Refrigerator Market Revenues & Volume, By Offline Channel, 2022 - 2032F |
6.2.3 Latvia Built-in Refrigerator Market Revenues & Volume, By Online Channel, 2022 - 2032F |
6.3 Latvia Built-in Refrigerator Market, By Product Type |
6.3.1 Overview and Analysis |
6.3.2 Latvia Built-in Refrigerator Market Revenues & Volume, By Single Door, 2022 - 2032F |
6.3.3 Latvia Built-in Refrigerator Market Revenues & Volume, By Double Door, 2022 - 2032F |
6.3.4 Latvia Built-in Refrigerator Market Revenues & Volume, By Side by Side Door, 2022 - 2032F |
6.3.5 Latvia Built-in Refrigerator Market Revenues & Volume, By French Door, 2022 - 2032F |
7 Latvia Built-in Refrigerator Market Import-Export Trade Statistics |
7.1 Latvia Built-in Refrigerator Market Export to Major Countries |
7.2 Latvia Built-in Refrigerator Market Imports from Major Countries |
8 Latvia Built-in Refrigerator Market Key Performance Indicators |
8.1 Average installation time for built-in refrigerators |
8.2 Percentage of households with smart home devices |
8.3 Number of new real estate developments incorporating built-in refrigerators |
9 Latvia Built-in Refrigerator Market - Opportunity Assessment |
9.1 Latvia Built-in Refrigerator Market Opportunity Assessment, By Application, 2022 & 2032F |
9.2 Latvia Built-in Refrigerator Market Opportunity Assessment, By Distribution Channel, 2022 & 2032F |
9.3 Latvia Built-in Refrigerator Market Opportunity Assessment, By Product Type, 2022 & 2032F |
10 Latvia Built-in Refrigerator Market - Competitive Landscape |
10.1 Latvia Built-in Refrigerator Market Revenue Share, By Companies, 2025 |
10.2 Latvia Built-in Refrigerator Market Competitive Benchmarking, By Operating and Technical Parameters |
11 Company Profiles |
12 Recommendations |
13 Disclaimer |
Export potential assessment - trade Analytics for 2030
Export potential enables firms to identify high-growth global markets with greater confidence by combining advanced trade intelligence with a structured quantitative methodology. The framework analyzes emerging demand trends and country-level import patterns while integrating macroeconomic and trade datasets such as GDP and population forecasts, bilateral import–export flows, tariff structures, elasticity differentials between developed and developing economies, geographic distance, and import demand projections. Using weighted trade values from 2020–2024 as the base period to project country-to-country export potential for 2030, these inputs are operationalized through calculated drivers such as gravity model parameters, tariff impact factors, and projected GDP per-capita growth. Through an analysis of hidden potentials, demand hotspots, and market conditions that are most favorable to success, this method enables firms to focus on target countries, maximize returns, and global expansion with data, backed by accuracy.
By factoring in the projected importer demand gap that is currently unmet and could be potential opportunity, it identifies the potential for the Exporter (Country) among 190 countries, against the general trade analysis, which identifies the biggest importer or exporter.
To discover high-growth global markets and optimize your business strategy:
Click Here
Pricing
- Single User License$ 1,995
- Department License$ 2,400
- Site License$ 3,120
- Global License$ 3,795

Search
Thought Leadership and Analyst Meet


Our Clients
Latest Reports
- India Ultrasonic Smart Water Meter Market (2026-2032) | Outlook, Competition, Drivers, Trends, Demand, Competitive, Strategic Insights, Companies, Challenges, Strategy, Consumer Insights, Analysis, Opportunities, Growth, Size, Share, Industry, Revenue, Segments, Value, Segmentation, Supply, Forecast, Restraints,
- India Electromagnetic Bulk Flow Meter Market (2026-2032) | Analysis, Challenges, Strategic Insights, Supply, Forecast, Growth, Share, Consumer Insights, Competitive, Value, Outlook, Size & Demand,
- India Battery Powered Bulk Flow Meter Market (2026-2032) | Outlook, Analysis, Competitive Landscape, Growth, Size, Trends, Value, Revenue, Companies, Segmentation, Share & Forecast
- Bosnia and Herzegovina Fuel-Efficient Winglets Market (2026-2032) | Growth, Competition, Strategy, Restraints, Trends, Challenges, segmentation, Value, Outlook, Investment Opportunities, Analysis, Revenue, Companies, Insights, Pricing, Size, Drivers, Demand, Share, Forecast
- Canada Cloud CFD Market (2026-2032) | Size & Revenue, Industry, Growth, Competitive Landscape, Forecast, Segmentation, Value, Outlook, Trends, Share, Analysis, Companies
- Taiwan Food Delivery Platform Market (2026-2032) | Companies, Outlook, Analysis, Trends, Value, Revenue, Segmentation, Share, Forecast, Competitive Landscape, Growth, Size & Forecast
- United Kingdom (UK) Long-term Care Insurance Market (2026-2032) | Growth, Share, Consumer Insights, Drivers, Opportunities, Competition, Pricing Analysis, Segments, Restraints, Companies, Competitive, Value, Outlook, Size, Demand, Analysis, Challenges, Strategic Insights, Investment Trends, Revenue, Trends, Supply, Forecast
- United Kingdom (UK) Long Term Care Market (2026-2032) | Companies, Outlook, Analysis, Trends, Value, Revenue, Segmentation, Share, Forecast, Competitive Landscape, Growth, Size & Forecast
- Iraq Insulation and Waterproofing Market (2026-2032) | Outlook, Drivers, Growth, Size, Share, Industry, Revenue, Trends, Demand, Competitive, Strategic Insights, Opportunities, Segments, Companies, Challenges, Strategy, Consumer Insights, Analysis, Investment Trends, Value, Segmentation, Forecast, Restraints
- India Switchgear Market Outlook (2026-2032) | Size, Share, Trends, Growth, Revenue, Forecast, Analysis, Value, Outlook
Industry Events and Analyst Meet

India EV Show 2026

EV tech India Expo 2026

Auto Tech Asia 2026

Battery Tech India 2026

Smart Production Solutions Guangzhou 2026
Whitepaper
- Middle East & Africa Commercial Security Market Click here to view more.
- Middle East & Africa Fire Safety Systems & Equipment Market Click here to view more.
- GCC Drone Market Click here to view more.
- Middle East Lighting Fixture Market Click here to view more.
- GCC Physical & Perimeter Security Market Click here to view more.
6WResearch In News
- Doha a strategic location for EV manufacturing hub: IPA Qatar
- Demand for luxury TVs surging in the GCC, says Samsung
- Empowering Growth: The Thriving Journey of Bangladesh’s Cable Industry
- Demand for luxury TVs surging in the GCC, says Samsung
- Video call with a traditional healer? Once unthinkable, it’s now common in South Africa
- Intelligent Buildings To Smooth GCC’s Path To Net Zero