Latvia Carnauba Wax Market (2025-2031) | Value, Trends, Industry, Revenue, Analysis, Share, Growth, Size, Forecast, Companies, Outlook & Segmentation
Market Forecast By Product (Type1, Type3, Type4), By Application (Cosmetics, Food, Automotive, Pharmaceutical, Others) And Competitive Landscape
| Product Code: ETC5011627 | Publication Date: Nov 2023 | Updated Date: Apr 2026 | Product Type: Market Research Report | |
| Publisher: 6Wresearch | Author: Shubham Padhi | No. of Pages: 60 | No. of Figures: 30 | No. of Tables: 5 |
Latvia Carnauba Wax Market Size (2020-2030)
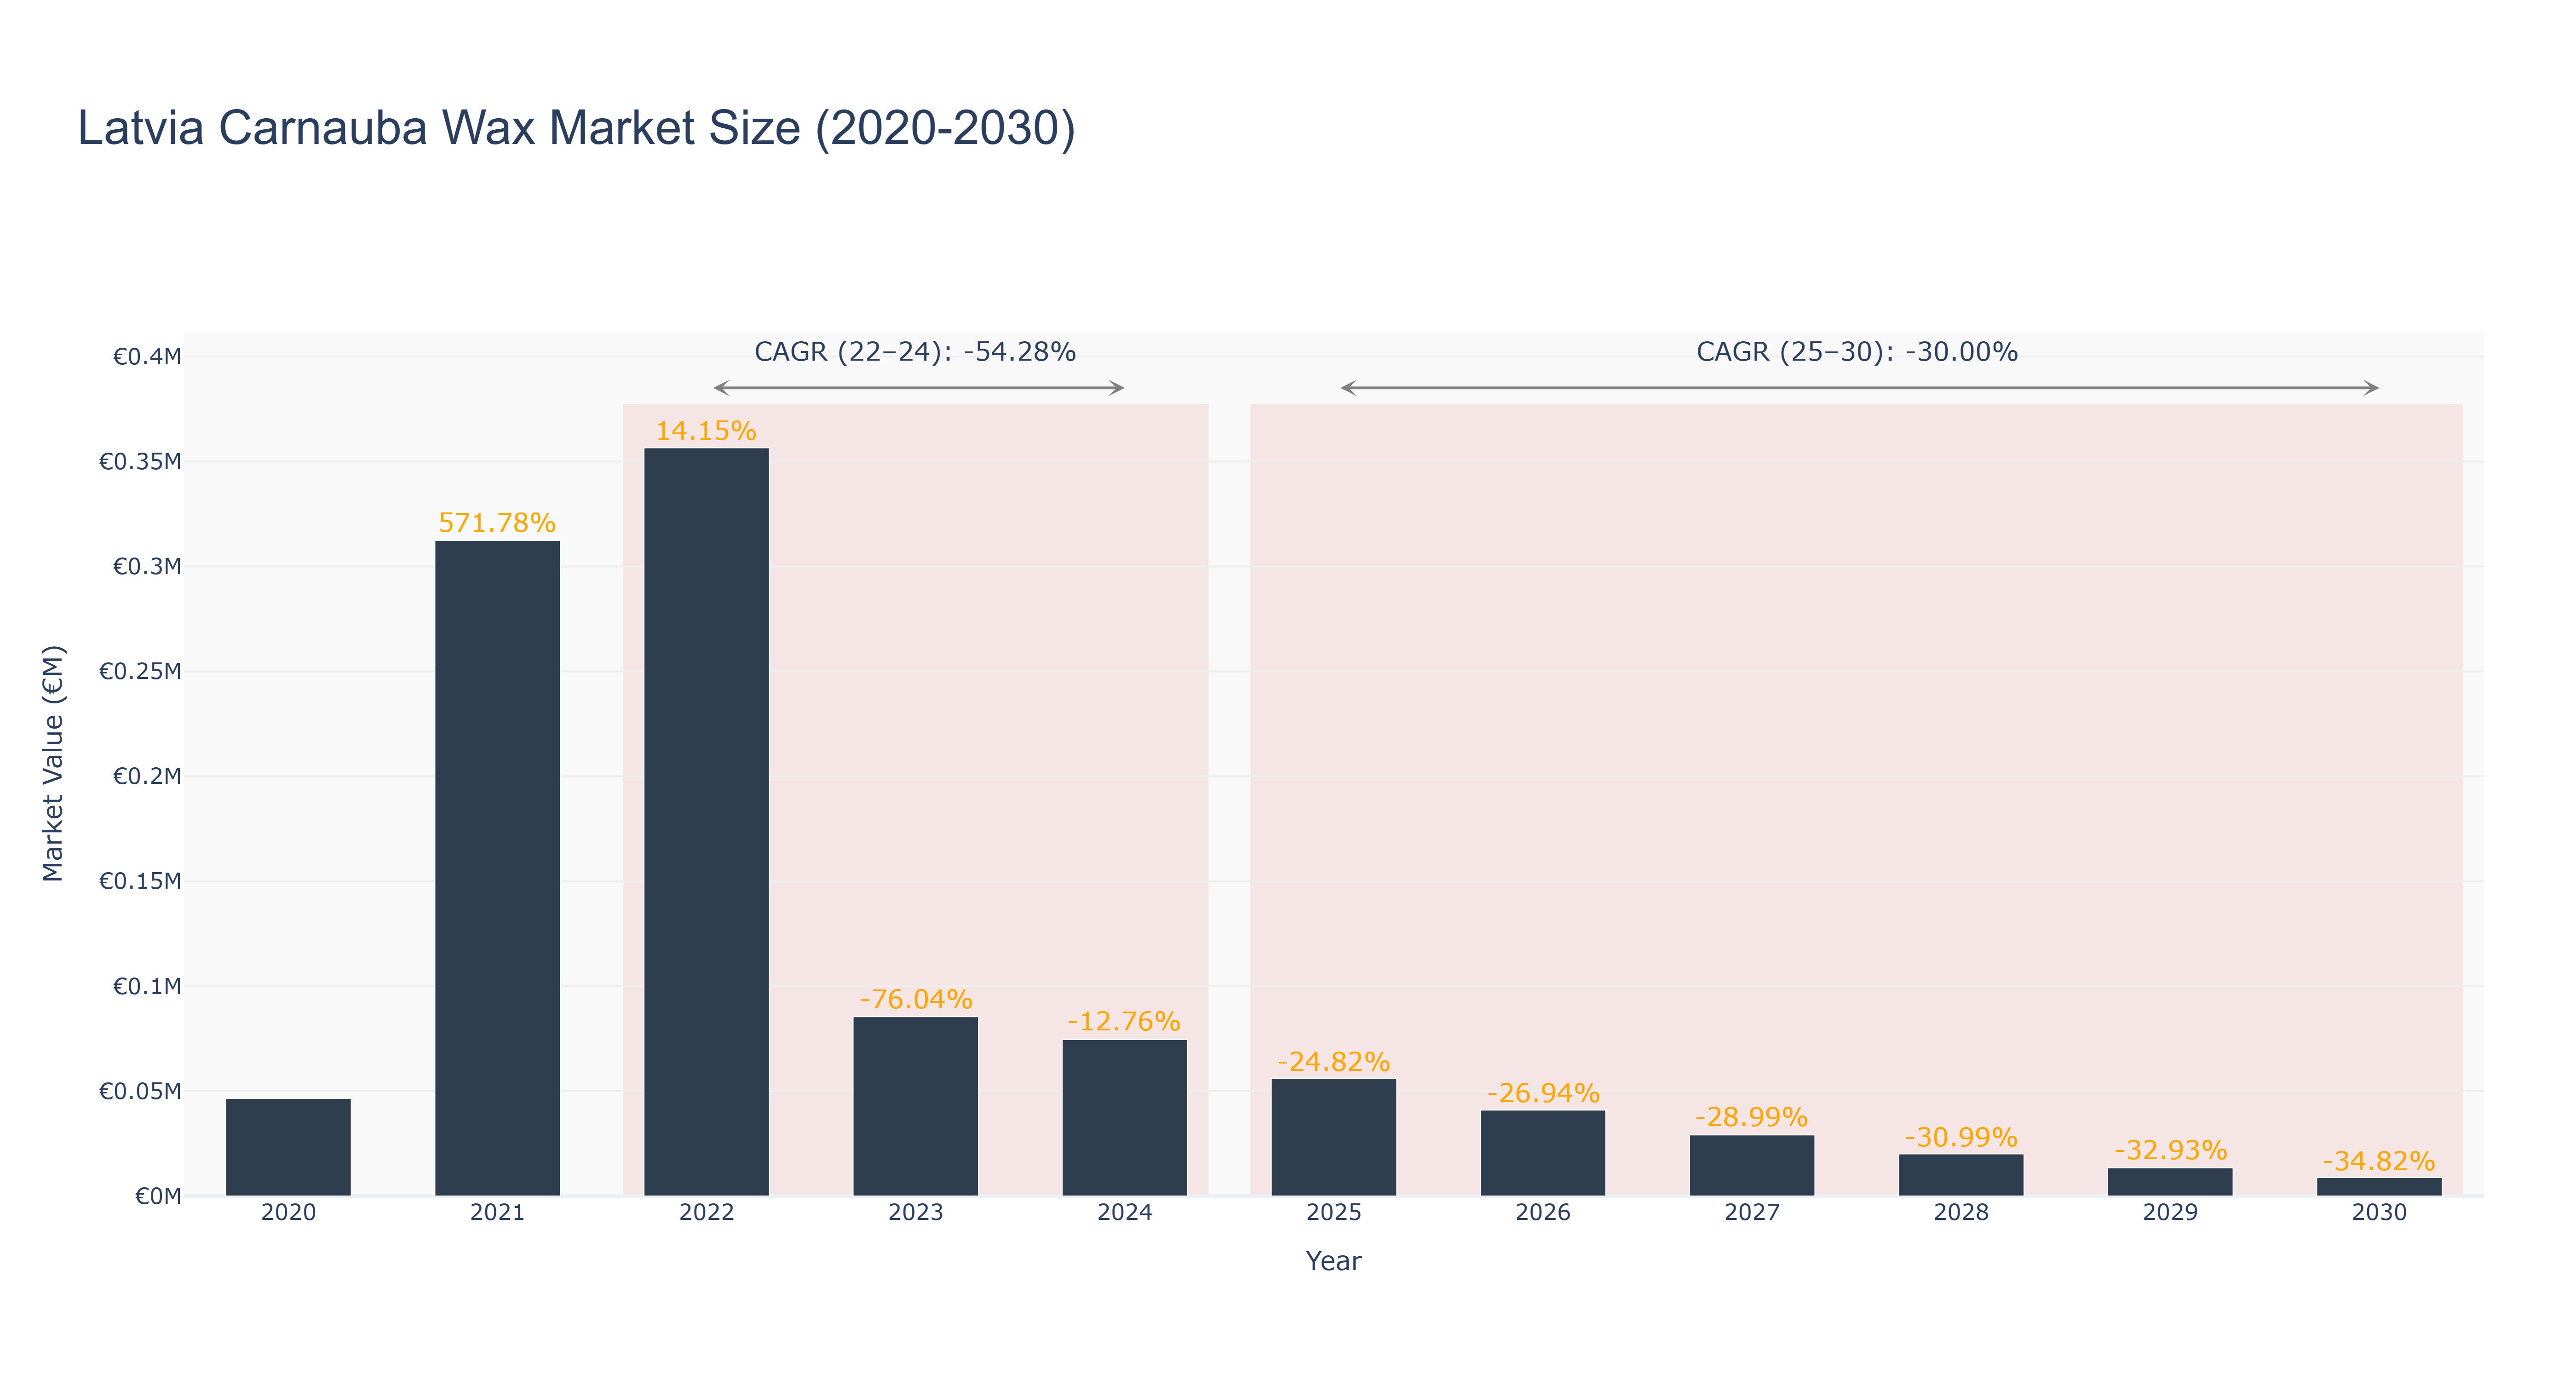
Latvia Carnauba Wax Market has experienced a significant decline in market size over the years. The peak market size of €0.36 million was recorded in 2022, followed by a sharp decrease to €0.07 million in 2024. The forecasted market size is expected to continue this downward trend, reaching €0.01 million by 2030. The CAGR values reflect this downward trajectory, with a CAGR of -54.28% from 2022 to 2024 and -30.0% from 2025 to 2030. The market's decline can be attributed to changing consumer preferences towards alternative products and a decrease in demand for carnauba wax in various industries. Looking ahead, Latvia is set to introduce sustainability initiatives in the wax industry, focusing on eco-friendly production methods and exploring new applications for carnauba wax in niche markets. These developments aim to revitalize the market and attract environmentally conscious consumers, potentially reversing the current downward trend.
Latvia Carnauba Wax Market: Production & Trade Performance (2019-2025)
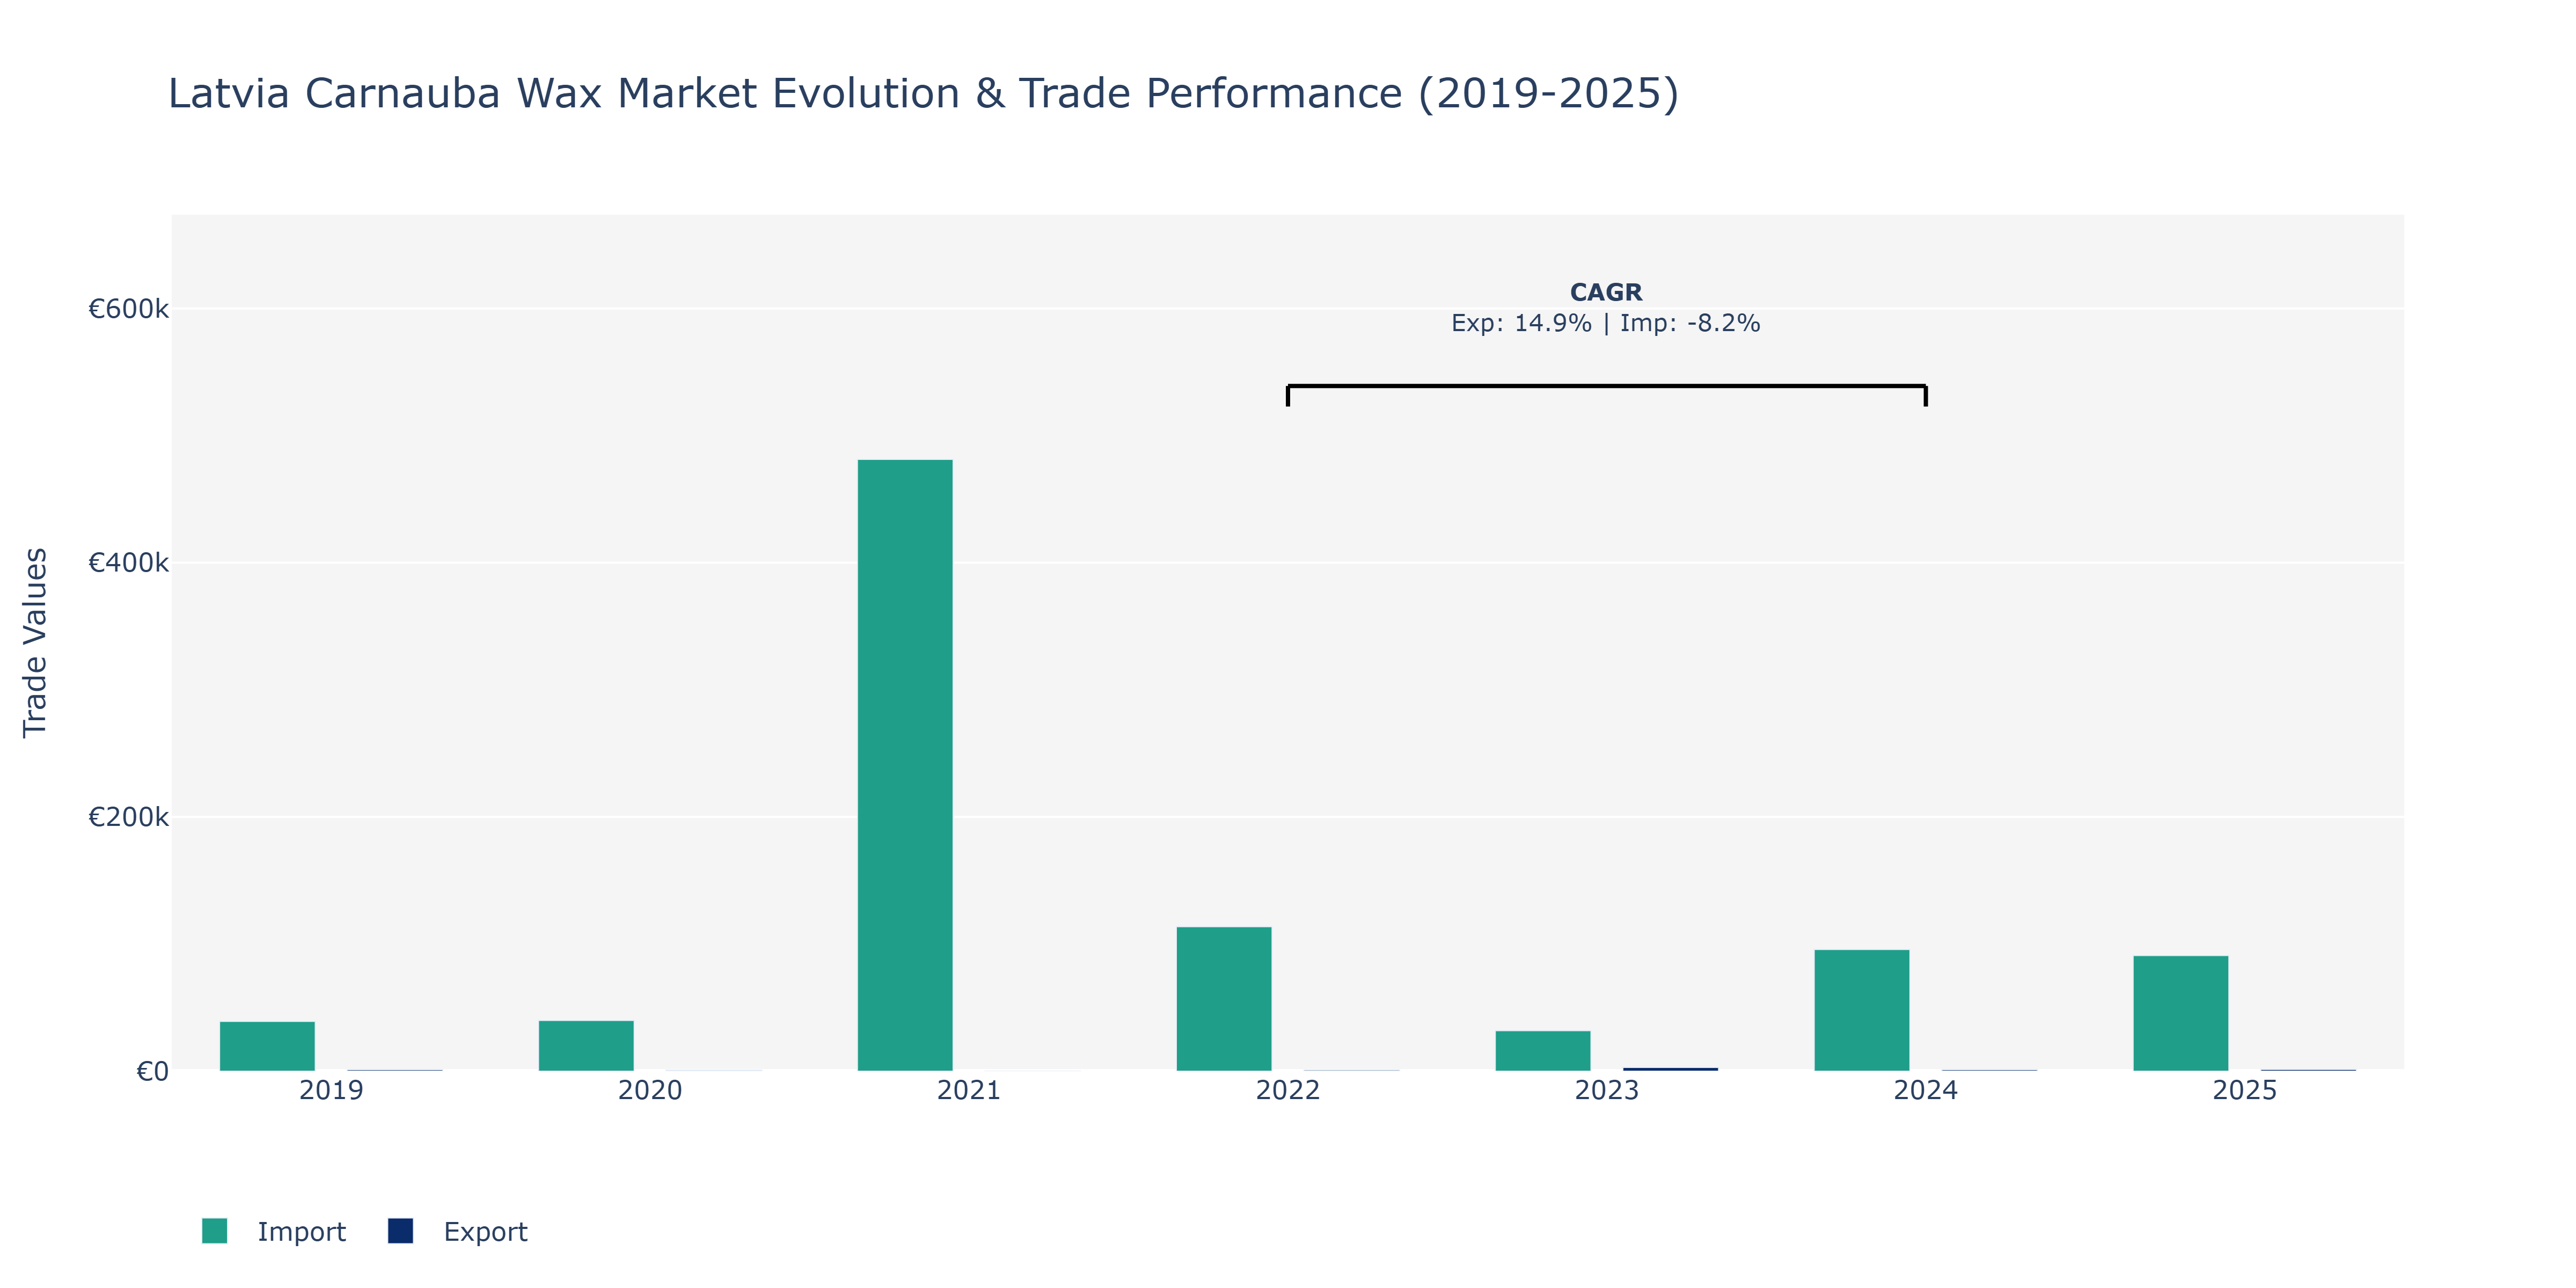
The Latvia Carnauba Wax Market experienced notable fluctuations in both Exports and Imports between 2019 and 2025. In 2019, Imports stood at €39.18 thousand, surpassing Exports which were at €1.17 thousand. The following year, both Exports and Imports decreased, with Exports dropping sharply to €0.79 thousand and Imports slightly increasing to €39.94 thousand. The most significant shift occurred in 2021, seeing Imports spike to a substantial €481.3 thousand while Exports plunged to only €28 thousand, indicating a possible shift in market dynamics or supply chain disruptions affecting the export capabilities of Latvia within the Carnauba Wax Market. Subsequent years showed varying trends, with Exports gradually recovering to €1.36 thousand in 2025 and Imports fluctuating around the €90 thousand mark. The observed fluctuations could be attributed to global demand changes, trade agreements, or shifts in production capacities affecting the supply chain of Carnauba wax in the Latvian market. Additional research into global wax market trends and trade policies could provide further insights into these fluctuations.
Key Highlights of the Report:
- Latvia Carnauba Wax Market Outlook
- Market Size of Latvia Carnauba Wax Market, 2024
- Forecast of Latvia Carnauba Wax Market, 2031
- Historical Data and Forecast of Latvia Carnauba Wax Revenues & Volume for the Period 2021-2031
- Latvia Carnauba Wax Market Trend Evolution
- Latvia Carnauba Wax Market Drivers and Challenges
- Latvia Carnauba Wax Price Trends
- Latvia Carnauba Wax Porter`s Five Forces
- Latvia Carnauba Wax Industry Life Cycle
- Historical Data and Forecast of Latvia Carnauba Wax Market Revenues & Volume By Product for the Period 2021-2031
- Historical Data and Forecast of Latvia Carnauba Wax Market Revenues & Volume By Type1 for the Period 2021-2031
- Historical Data and Forecast of Latvia Carnauba Wax Market Revenues & Volume By Type3 for the Period 2021-2031
- Historical Data and Forecast of Latvia Carnauba Wax Market Revenues & Volume By Type4 for the Period 2021-2031
- Historical Data and Forecast of Latvia Carnauba Wax Market Revenues & Volume By Application for the Period 2021-2031
- Historical Data and Forecast of Latvia Carnauba Wax Market Revenues & Volume By Cosmetics for the Period 2021-2031
- Historical Data and Forecast of Latvia Carnauba Wax Market Revenues & Volume By Food for the Period 2021-2031
- Historical Data and Forecast of Latvia Carnauba Wax Market Revenues & Volume By Automotive for the Period 2021-2031
- Historical Data and Forecast of Latvia Carnauba Wax Market Revenues & Volume By Pharmaceutical for the Period 2021-2031
- Historical Data and Forecast of Latvia Carnauba Wax Market Revenues & Volume By Others for the Period 2021-2031
- Latvia Carnauba Wax Import Export Trade Statistics
- Market Opportunity Assessment By Product
- Market Opportunity Assessment By Application
- Latvia Carnauba Wax Top Companies Market Share
- Latvia Carnauba Wax Competitive Benchmarking By Technical and Operational Parameters
- Latvia Carnauba Wax Company Profiles
- Latvia Carnauba Wax Key Strategic Recommendations
Frequently Asked Questions About the Market Study (FAQs):
6Wresearch actively monitors the Latvia Carnauba Wax Market and publishes its comprehensive annual report, highlighting emerging trends, growth drivers, revenue analysis, and forecast outlook. Our insights help businesses to make data-backed strategic decisions with ongoing market dynamics. Our analysts track relevent industries related to the Latvia Carnauba Wax Market, allowing our clients with actionable intelligence and reliable forecasts tailored to emerging regional needs.
Yes, we provide customisation as per your requirements. To learn more, feel free to contact us on sales@6wresearch.com
1 Executive Summary |
2 Introduction |
2.1 Key Highlights of the Report |
2.2 Report Description |
2.3 Market Scope & Segmentation |
2.4 Research Methodology |
2.5 Assumptions |
3 Latvia Carnauba Wax Market Overview |
3.1 Latvia Country Macro Economic Indicators |
3.2 Latvia Carnauba Wax Market Revenues & Volume, 2021 & 2031F |
3.3 Latvia Carnauba Wax Market - Industry Life Cycle |
3.4 Latvia Carnauba Wax Market - Porter's Five Forces |
3.5 Latvia Carnauba Wax Market Revenues & Volume Share, By Product, 2021 & 2031F |
3.6 Latvia Carnauba Wax Market Revenues & Volume Share, By Application, 2021 & 2031F |
4 Latvia Carnauba Wax Market Dynamics |
4.1 Impact Analysis |
4.2 Market Drivers |
4.2.1 Increasing demand for natural and sustainable products in industries such as cosmetics, food, and automotive. |
4.2.2 Growing awareness about the benefits of carnauba wax, such as its biodegradability and high gloss properties. |
4.2.3 Rising focus on product innovation and development in the wax industry. |
4.3 Market Restraints |
4.3.1 Fluctuating prices of raw materials used in carnauba wax production. |
4.3.2 Competition from synthetic wax alternatives in various applications. |
4.3.3 Environmental concerns related to the harvesting of carnauba palm leaves. |
5 Latvia Carnauba Wax Market Trends |
6 Latvia Carnauba Wax Market Segmentations |
6.1 Latvia Carnauba Wax Market, By Product |
6.1.1 Overview and Analysis |
6.1.2 Latvia Carnauba Wax Market Revenues & Volume, By Type1, 2021-2031F |
6.1.3 Latvia Carnauba Wax Market Revenues & Volume, By Type3, 2021-2031F |
6.1.4 Latvia Carnauba Wax Market Revenues & Volume, By Type4, 2021-2031F |
6.2 Latvia Carnauba Wax Market, By Application |
6.2.1 Overview and Analysis |
6.2.2 Latvia Carnauba Wax Market Revenues & Volume, By Cosmetics, 2021-2031F |
6.2.3 Latvia Carnauba Wax Market Revenues & Volume, By Food, 2021-2031F |
6.2.4 Latvia Carnauba Wax Market Revenues & Volume, By Automotive, 2021-2031F |
6.2.5 Latvia Carnauba Wax Market Revenues & Volume, By Pharmaceutical, 2021-2031F |
6.2.6 Latvia Carnauba Wax Market Revenues & Volume, By Others, 2021-2031F |
7 Latvia Carnauba Wax Market Import-Export Trade Statistics |
7.1 Latvia Carnauba Wax Market Export to Major Countries |
7.2 Latvia Carnauba Wax Market Imports from Major Countries |
8 Latvia Carnauba Wax Market Key Performance Indicators |
8.1 Percentage of carnauba wax used in new product formulations by key industries. |
8.2 Number of research and development projects focused on enhancing carnauba wax properties. |
8.3 Sustainability certifications obtained by carnauba wax producers. |
9 Latvia Carnauba Wax Market - Opportunity Assessment |
9.1 Latvia Carnauba Wax Market Opportunity Assessment, By Product, 2021 & 2031F |
9.2 Latvia Carnauba Wax Market Opportunity Assessment, By Application, 2021 & 2031F |
10 Latvia Carnauba Wax Market - Competitive Landscape |
10.1 Latvia Carnauba Wax Market Revenue Share, By Companies, 2024 |
10.2 Latvia Carnauba Wax Market Competitive Benchmarking, By Operating and Technical Parameters |
11 Company Profiles |
12 Recommendations | 13 Disclaimer |
Global Go To Market Strategy - 2030
Export potential enables firms to identify high-growth global markets with greater confidence by combining advanced trade intelligence with a structured quantitative methodology. The framework analyzes emerging demand trends and country-level import patterns while integrating macroeconomic and trade datasets such as GDP and population forecasts, bilateral import–export flows, tariff structures, elasticity differentials between developed and developing economies, geographic distance, and import demand projections. Using weighted trade values from 2020–2024 as the base period to project country-to-country export potential for 2030, these inputs are operationalized through calculated drivers such as gravity model parameters, tariff impact factors, and projected GDP per-capita growth. Through an analysis of hidden potentials, demand hotspots, and market conditions that are most favorable to success, this method enables firms to focus on target countries, maximize returns, and global expansion with data, backed by accuracy.
By factoring in the projected importer demand gap that is currently unmet and could be potential opportunity, it identifies the potential for the Exporter (Country) among 190 countries, against the general trade analysis, which identifies the biggest importer or exporter.
To discover high-growth global markets and optimize your business strategy:
Click Here
Pricing
- Single User License$ 1,995
- Department License$ 2,400
- Site License$ 3,120
- Global License$ 3,795

Leadership Perspectives from Industry Events
Search
Thought Leadership and Analyst Meet


Our Clients
6WResearch In News
- India Export Attractiveness Tracker 2026
- India Air Conditioner Market Set for Strong Rebound in 2026 After Weather-Led Correction and GST-Driven Recovery: 6Wresearch
- ADAS in India: How Automatic Emergency Braking, Blind Spot Detection & Driver Monitoring are Transforming Road Safety
- Doha a strategic location for EV manufacturing hub: IPA Qatar
- Demand for luxury TVs surging in the GCC, says Samsung
- Empowering Growth: The Thriving Journey of Bangladesh’s Cable Industry
Latest Reports
- Nicaragua RPG Gaming Market (2026-2032)
- New Zealand RPG Gaming Market (2026-2032)
- Netherlands RPG Gaming Market (2026-2032)
- Nauru RPG Gaming Market (2026-2032)
- Namibia RPG Gaming Market (2026-2032)
- Mozambique RPG Gaming Market (2026-2032)
- Montenegro RPG Gaming Market (2026-2032)
- Mongolia RPG Gaming Market (2026-2032)
- Monaco RPG Gaming Market (2026-2032)
- Micronesia RPG Gaming Market (2026-2032)
Industry Events and Analyst Meet

EV India Expo 2026

HIMTEX 2026

India Refining Summit 2026

India EV Show 2026

EV tech India Expo 2026
Whitepaper
- Middle East & Africa Commercial Security Market Click here to view more.
- Middle East & Africa Fire Safety Systems & Equipment Market Click here to view more.
- GCC Drone Market Click here to view more.
- Middle East Lighting Fixture Market Click here to view more.
- GCC Physical & Perimeter Security Market Click here to view more.