Latvia Fructose Market (2026-2032) | Forecast, Growth, Trends, Size, Segmentation, Share, Industry, Outlook, Analysis, Value, Companies & Revenue
Market Forecast By Product (High Fructose Corn Syrup, Fructose Syrups, Fructose Solids), By Application (Beverages, Processed Foods, Dairy Products, Confectionary, Bakery & Cereals, Others) And Competitive Landscape
| Product Code: ETC4733391 | Publication Date: Nov 2023 | Updated Date: Apr 2026 | Product Type: Market Research Report | |
| Publisher: 6Wresearch | Author: Shubham Padhi | No. of Pages: 60 | No. of Figures: 30 | No. of Tables: 5 |
Latvia Fructose Market Size (2020-2030)
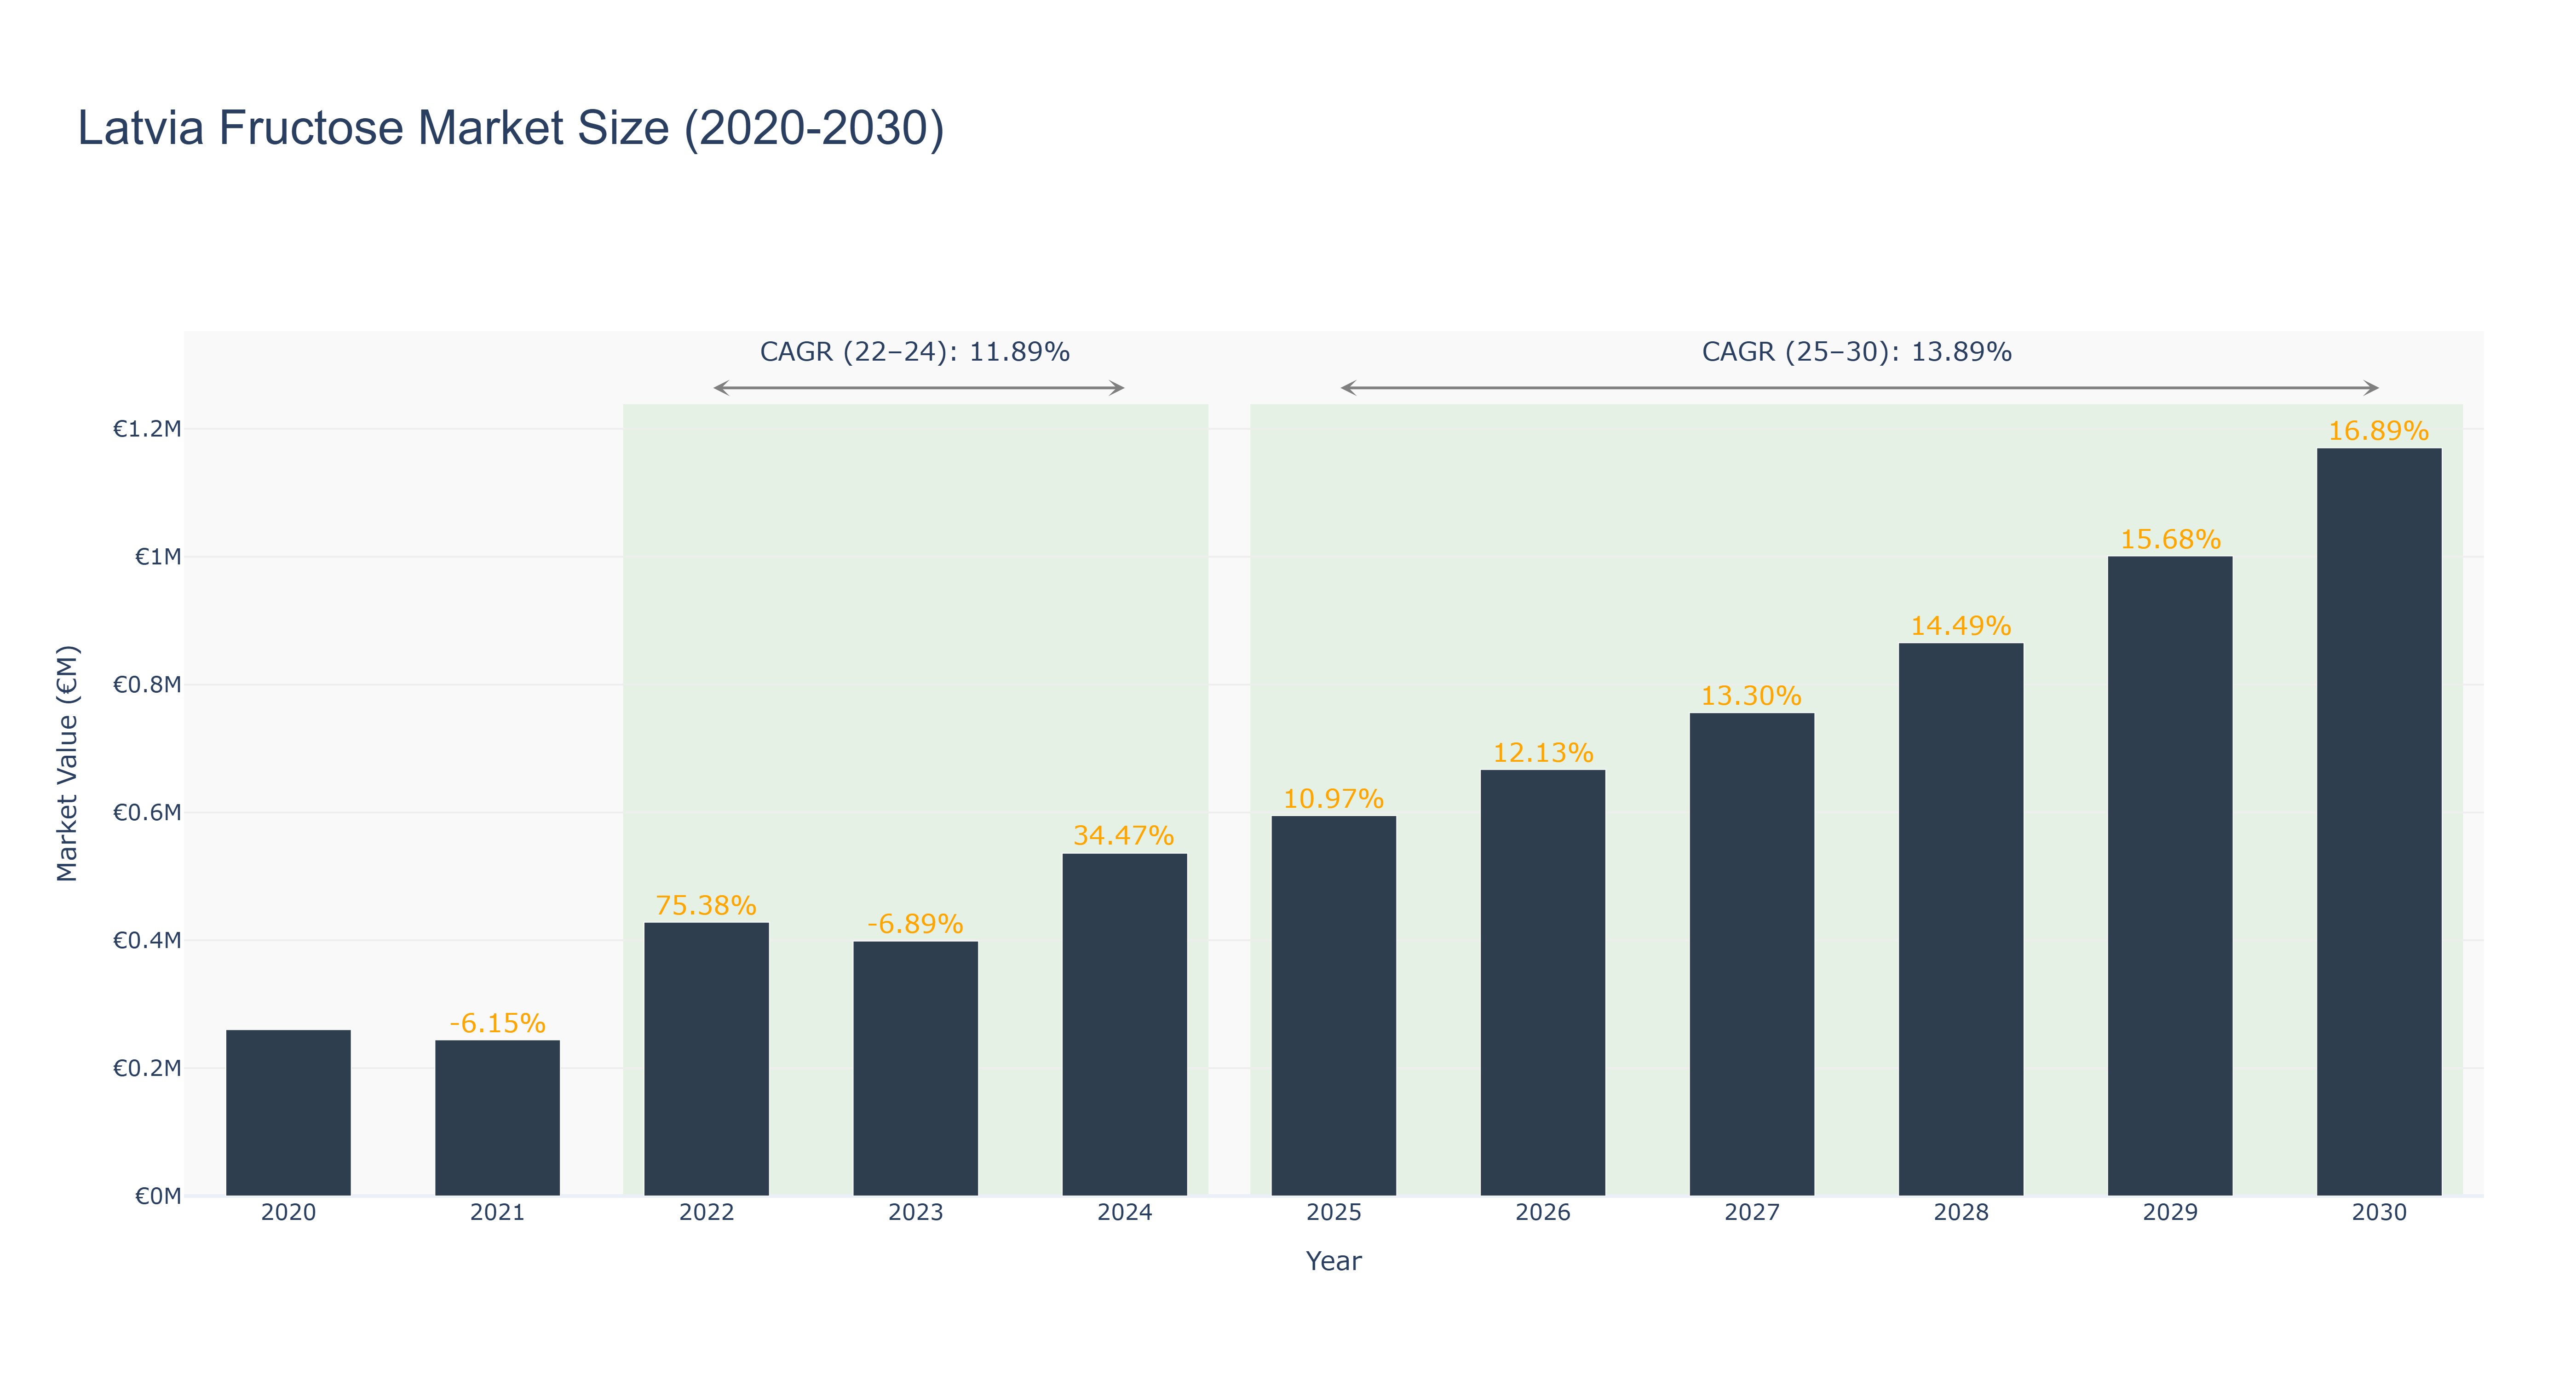
The Latvia Fructose Market experienced significant fluctuations between 2020 and 2024, with a peak market size of €428.34 thousand in 2022, followed by a notable decline to €398.81 thousand in 2023, reflecting a -6.89% growth rate. The actual CAGR for this period (2022-2024) stands at 11.89%, indicating a recovery trend as the market is projected to grow to €536.27 thousand in 2024, fueled by rising health consciousness and demand for natural sweeteners. Looking ahead, the forecasted period from 2025 to 2030 anticipates steady growth, with market sizes expected to reach €1.17 million by 2030 and a robust CAGR of 13.89%. This growth will likely be driven by increasing applications of fructose in the food and beverage sector, as well as innovations in production technologies. As consumer preferences shift towards healthier alternatives, the Latvia fructose market is poised for significant expansion in the coming years.
Latvia Fructose Market: Production & Trade Performance (2019-2025)
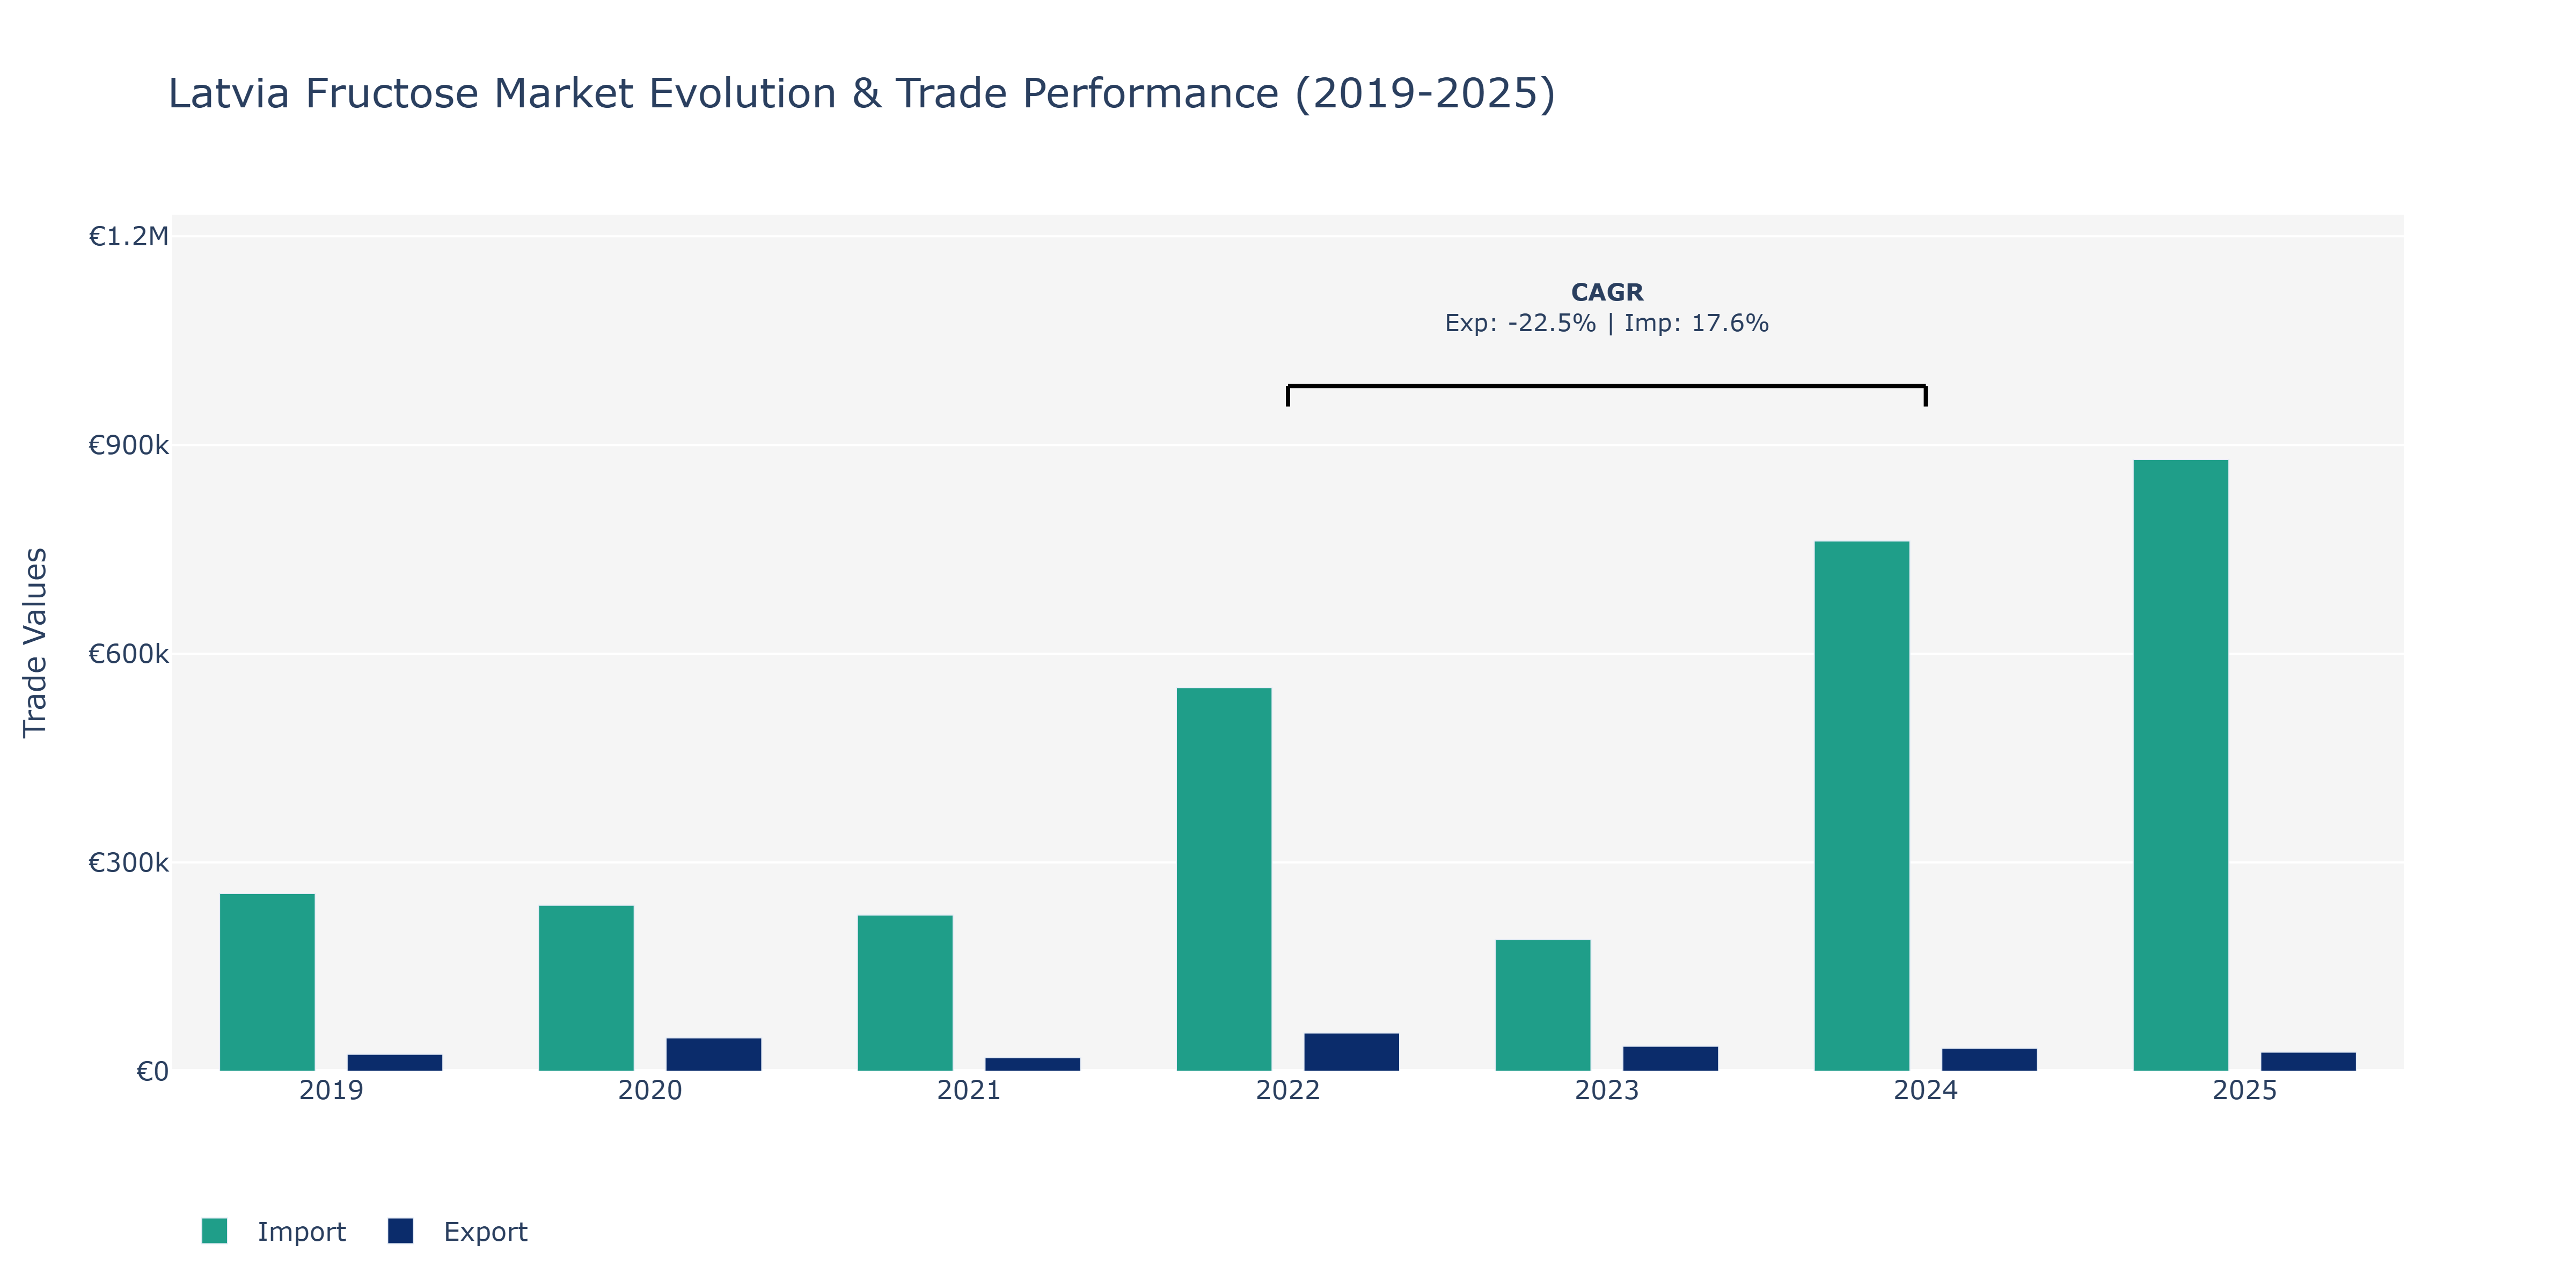
The Latvia Fructose Market witnessed notable fluctuations in both exports and imports over the years. In 2019, imports were significantly higher than exports, with imports standing at €255.25 thousand and exports at €24.35 thousand. However, in 2020, there was a substantial increase in exports, reaching €47.75 thousand, while imports slightly decreased to €238.56 thousand. A reverse trend occurred in 2021, with exports dropping to €19.29 thousand and imports decreasing to €224.38 thousand. The peak points for exports were observed in 2022 at €54.93 thousand and for imports in 2025 at €879.37 thousand. The surge in imports in 2024 to €762.19 thousand indicated a potential increase in domestic demand for fructose products in Latvia. These fluctuations could be attributed to changing consumer preferences, shifts in global supply chains, and evolving regulatory frameworks within the food and beverage industry. The upward trend in imports from 2022 to 2025 could signify growing demand for fructose-based products in the market, reflecting an opportunity for market players to capitalize on this increasing consumer interest.
Key Highlights of the Report:
- Latvia Fructose Market Outlook
- Market Size of Latvia Fructose Market, 2025
- Forecast of Latvia Fructose Market, 2032
- Historical Data and Forecast of Latvia Fructose Revenues & Volume for the Period 2022 - 2032F
- Latvia Fructose Market Trend Evolution
- Latvia Fructose Market Drivers and Challenges
- Latvia Fructose Price Trends
- Latvia Fructose Porter`s Five Forces
- Latvia Fructose Industry Life Cycle
- Historical Data and Forecast of Latvia Fructose Market Revenues & Volume By Product for the Period 2022 - 2032F
- Historical Data and Forecast of Latvia Fructose Market Revenues & Volume By High Fructose Corn Syrup for the Period 2022 - 2032F
- Historical Data and Forecast of Latvia Fructose Market Revenues & Volume By Fructose Syrups for the Period 2022 - 2032F
- Historical Data and Forecast of Latvia Fructose Market Revenues & Volume By Fructose Solids for the Period 2022 - 2032F
- Historical Data and Forecast of Latvia Fructose Market Revenues & Volume By Application for the Period 2022 - 2032F
- Historical Data and Forecast of Latvia Fructose Market Revenues & Volume By Beverages for the Period 2022 - 2032F
- Historical Data and Forecast of Latvia Fructose Market Revenues & Volume By Processed Foods for the Period 2022 - 2032F
- Historical Data and Forecast of Latvia Fructose Market Revenues & Volume By Dairy Products for the Period 2022 - 2032F
- Historical Data and Forecast of Latvia Fructose Market Revenues & Volume By Confectionary for the Period 2022 - 2032F
- Historical Data and Forecast of Latvia Fructose Market Revenues & Volume By Bakery & Cereals for the Period 2022 - 2032F
- Historical Data and Forecast of Latvia Fructose Market Revenues & Volume By Others for the Period 2022 - 2032F
- Latvia Fructose Import Export Trade Statistics
- Market Opportunity Assessment By Product
- Market Opportunity Assessment By Application
- Latvia Fructose Top Companies Market Share
- Latvia Fructose Competitive Benchmarking By Technical and Operational Parameters
- Latvia Fructose Company Profiles
- Latvia Fructose Key Strategic Recommendations
Frequently Asked Questions About the Market Study (FAQs):
6Wresearch actively monitors the Latvia Fructose Market and publishes its comprehensive annual report, highlighting emerging trends, growth drivers, revenue analysis, and forecast outlook. Our insights help businesses to make data-backed strategic decisions with ongoing market dynamics. Our analysts track relevent industries related to the Latvia Fructose Market, allowing our clients with actionable intelligence and reliable forecasts tailored to emerging regional needs.
Yes, we provide customisation as per your requirements. To learn more, feel free to contact us on sales@6wresearch.com
1 Executive Summary |
2 Introduction |
2.1 Key Highlights of the Report |
2.2 Report Description |
2.3 Market Scope & Segmentation |
2.4 Research Methodology |
2.5 Assumptions |
3 Latvia Fructose Market Overview |
3.1 Latvia Country Macro Economic Indicators |
3.2 Latvia Fructose Market Revenues & Volume, 2022 & 2032F |
3.3 Latvia Fructose Market - Industry Life Cycle |
3.4 Latvia Fructose Market - Porter's Five Forces |
3.5 Latvia Fructose Market Revenues & Volume Share, By Product, 2022 & 2032F |
3.6 Latvia Fructose Market Revenues & Volume Share, By Application, 2022 & 2032F |
4 Latvia Fructose Market Dynamics |
4.1 Impact Analysis |
4.2 Market Drivers |
4.2.1 Increasing consumer awareness about health benefits of using fructose as a sweetener |
4.2.2 Growing demand for natural and clean label food products |
4.2.3 Rising prevalence of lifestyle diseases such as diabetes and obesity, leading to a shift towards healthier sweeteners |
4.3 Market Restraints |
4.3.1 Fluctuating prices of raw materials like sugar cane or corn, affecting the production cost of fructose |
4.3.2 Stringent regulations and quality standards for food ingredients in Latvia |
4.3.3 Competition from other alternative sweeteners like stevia or artificial sweeteners |
5 Latvia Fructose Market Trends |
6 Latvia Fructose Market Segmentations |
6.1 Latvia Fructose Market, By Product |
6.1.1 Overview and Analysis |
6.1.2 Latvia Fructose Market Revenues & Volume, By High Fructose Corn Syrup, 2022 - 2032F |
6.1.3 Latvia Fructose Market Revenues & Volume, By Fructose Syrups, 2022 - 2032F |
6.1.4 Latvia Fructose Market Revenues & Volume, By Fructose Solids, 2022 - 2032F |
6.2 Latvia Fructose Market, By Application |
6.2.1 Overview and Analysis |
6.2.2 Latvia Fructose Market Revenues & Volume, By Beverages, 2022 - 2032F |
6.2.3 Latvia Fructose Market Revenues & Volume, By Processed Foods, 2022 - 2032F |
6.2.4 Latvia Fructose Market Revenues & Volume, By Dairy Products, 2022 - 2032F |
6.2.5 Latvia Fructose Market Revenues & Volume, By Confectionary, 2022 - 2032F |
6.2.6 Latvia Fructose Market Revenues & Volume, By Bakery & Cereals, 2022 - 2032F |
6.2.7 Latvia Fructose Market Revenues & Volume, By Others, 2022 - 2032F |
7 Latvia Fructose Market Import-Export Trade Statistics |
7.1 Latvia Fructose Market Export to Major Countries |
7.2 Latvia Fructose Market Imports from Major Countries |
8 Latvia Fructose Market Key Performance Indicators |
8.1 Consumer demand for natural sweeteners in the food and beverage industry |
8.2 Number of new product launches containing fructose in the Latvian market |
8.3 Adoption rate of fructose by food manufacturers in Latvia |
8.4 Investment in research and development for innovative applications of fructose in food products |
9 Latvia Fructose Market - Opportunity Assessment |
9.1 Latvia Fructose Market Opportunity Assessment, By Product, 2022 & 2032F |
9.2 Latvia Fructose Market Opportunity Assessment, By Application, 2022 & 2032F |
10 Latvia Fructose Market - Competitive Landscape |
10.1 Latvia Fructose Market Revenue Share, By Companies, 2025 |
10.2 Latvia Fructose Market Competitive Benchmarking, By Operating and Technical Parameters |
11 Company Profiles |
12 Recommendations | 13 Disclaimer |
Global Go To Market Strategy - 2030
Export potential enables firms to identify high-growth global markets with greater confidence by combining advanced trade intelligence with a structured quantitative methodology. The framework analyzes emerging demand trends and country-level import patterns while integrating macroeconomic and trade datasets such as GDP and population forecasts, bilateral import–export flows, tariff structures, elasticity differentials between developed and developing economies, geographic distance, and import demand projections. Using weighted trade values from 2020–2024 as the base period to project country-to-country export potential for 2030, these inputs are operationalized through calculated drivers such as gravity model parameters, tariff impact factors, and projected GDP per-capita growth. Through an analysis of hidden potentials, demand hotspots, and market conditions that are most favorable to success, this method enables firms to focus on target countries, maximize returns, and global expansion with data, backed by accuracy.
By factoring in the projected importer demand gap that is currently unmet and could be potential opportunity, it identifies the potential for the Exporter (Country) among 190 countries, against the general trade analysis, which identifies the biggest importer or exporter.
To discover high-growth global markets and optimize your business strategy:
Click Here
Pricing
- Single User License$ 1,995
- Department License$ 2,400
- Site License$ 3,120
- Global License$ 3,795

Leadership Perspectives from Industry Events
Search
Thought Leadership and Analyst Meet


Our Clients
6WResearch In News
- India Export Attractiveness Tracker 2026
- India Air Conditioner Market Set for Strong Rebound in 2026 After Weather-Led Correction and GST-Driven Recovery: 6Wresearch
- ADAS in India: How Automatic Emergency Braking, Blind Spot Detection & Driver Monitoring are Transforming Road Safety
- Doha a strategic location for EV manufacturing hub: IPA Qatar
- Demand for luxury TVs surging in the GCC, says Samsung
- Empowering Growth: The Thriving Journey of Bangladesh’s Cable Industry
Latest Reports
- Nicaragua RPG Gaming Market (2026-2032)
- New Zealand RPG Gaming Market (2026-2032)
- Netherlands RPG Gaming Market (2026-2032)
- Nauru RPG Gaming Market (2026-2032)
- Namibia RPG Gaming Market (2026-2032)
- Mozambique RPG Gaming Market (2026-2032)
- Montenegro RPG Gaming Market (2026-2032)
- Mongolia RPG Gaming Market (2026-2032)
- Monaco RPG Gaming Market (2026-2032)
- Micronesia RPG Gaming Market (2026-2032)
Industry Events and Analyst Meet

EV India Expo 2026

HIMTEX 2026

India Refining Summit 2026

India EV Show 2026

EV tech India Expo 2026
Whitepaper
- Middle East & Africa Commercial Security Market Click here to view more.
- Middle East & Africa Fire Safety Systems & Equipment Market Click here to view more.
- GCC Drone Market Click here to view more.
- Middle East Lighting Fixture Market Click here to view more.
- GCC Physical & Perimeter Security Market Click here to view more.