Latvia Methanol Market (2026-2032) | Trends, Analysis, Share, Value, Segmentation, Forecast, Growth, Revenue, Industry, Outlook, Size & Companies
Market Forecast By Feedstock (Natural Gas, Coal, Others), By Derivatives (Gasoline, MTO/MTP, Formaldehyde, Methyl Tertiary Butyl Ether (MTBE), Acetic Acid, Dimethyl Ether (DME), Methyl Methacrylate (MMA), Others), By Sub-Derivatives (Gasoline additives, Olefins, UF/PF resins, VAM, Polyacetals, MDI, PTA, Others), By End-Use Industry (Construction, Automotive, Electronics, Appliances, Paints & Coatings, Insulation, Pharmaceuticals, Others) And Competitive Landscape
| Product Code: ETC4679925 | Publication Date: Nov 2023 | Updated Date: Apr 2026 | Product Type: Market Research Report | |
| Publisher: 6Wresearch | Author: Shubham Padhi | No. of Pages: 60 | No. of Figures: 30 | No. of Tables: 5 |
Latvia Methanol Market Size (2020-2030)
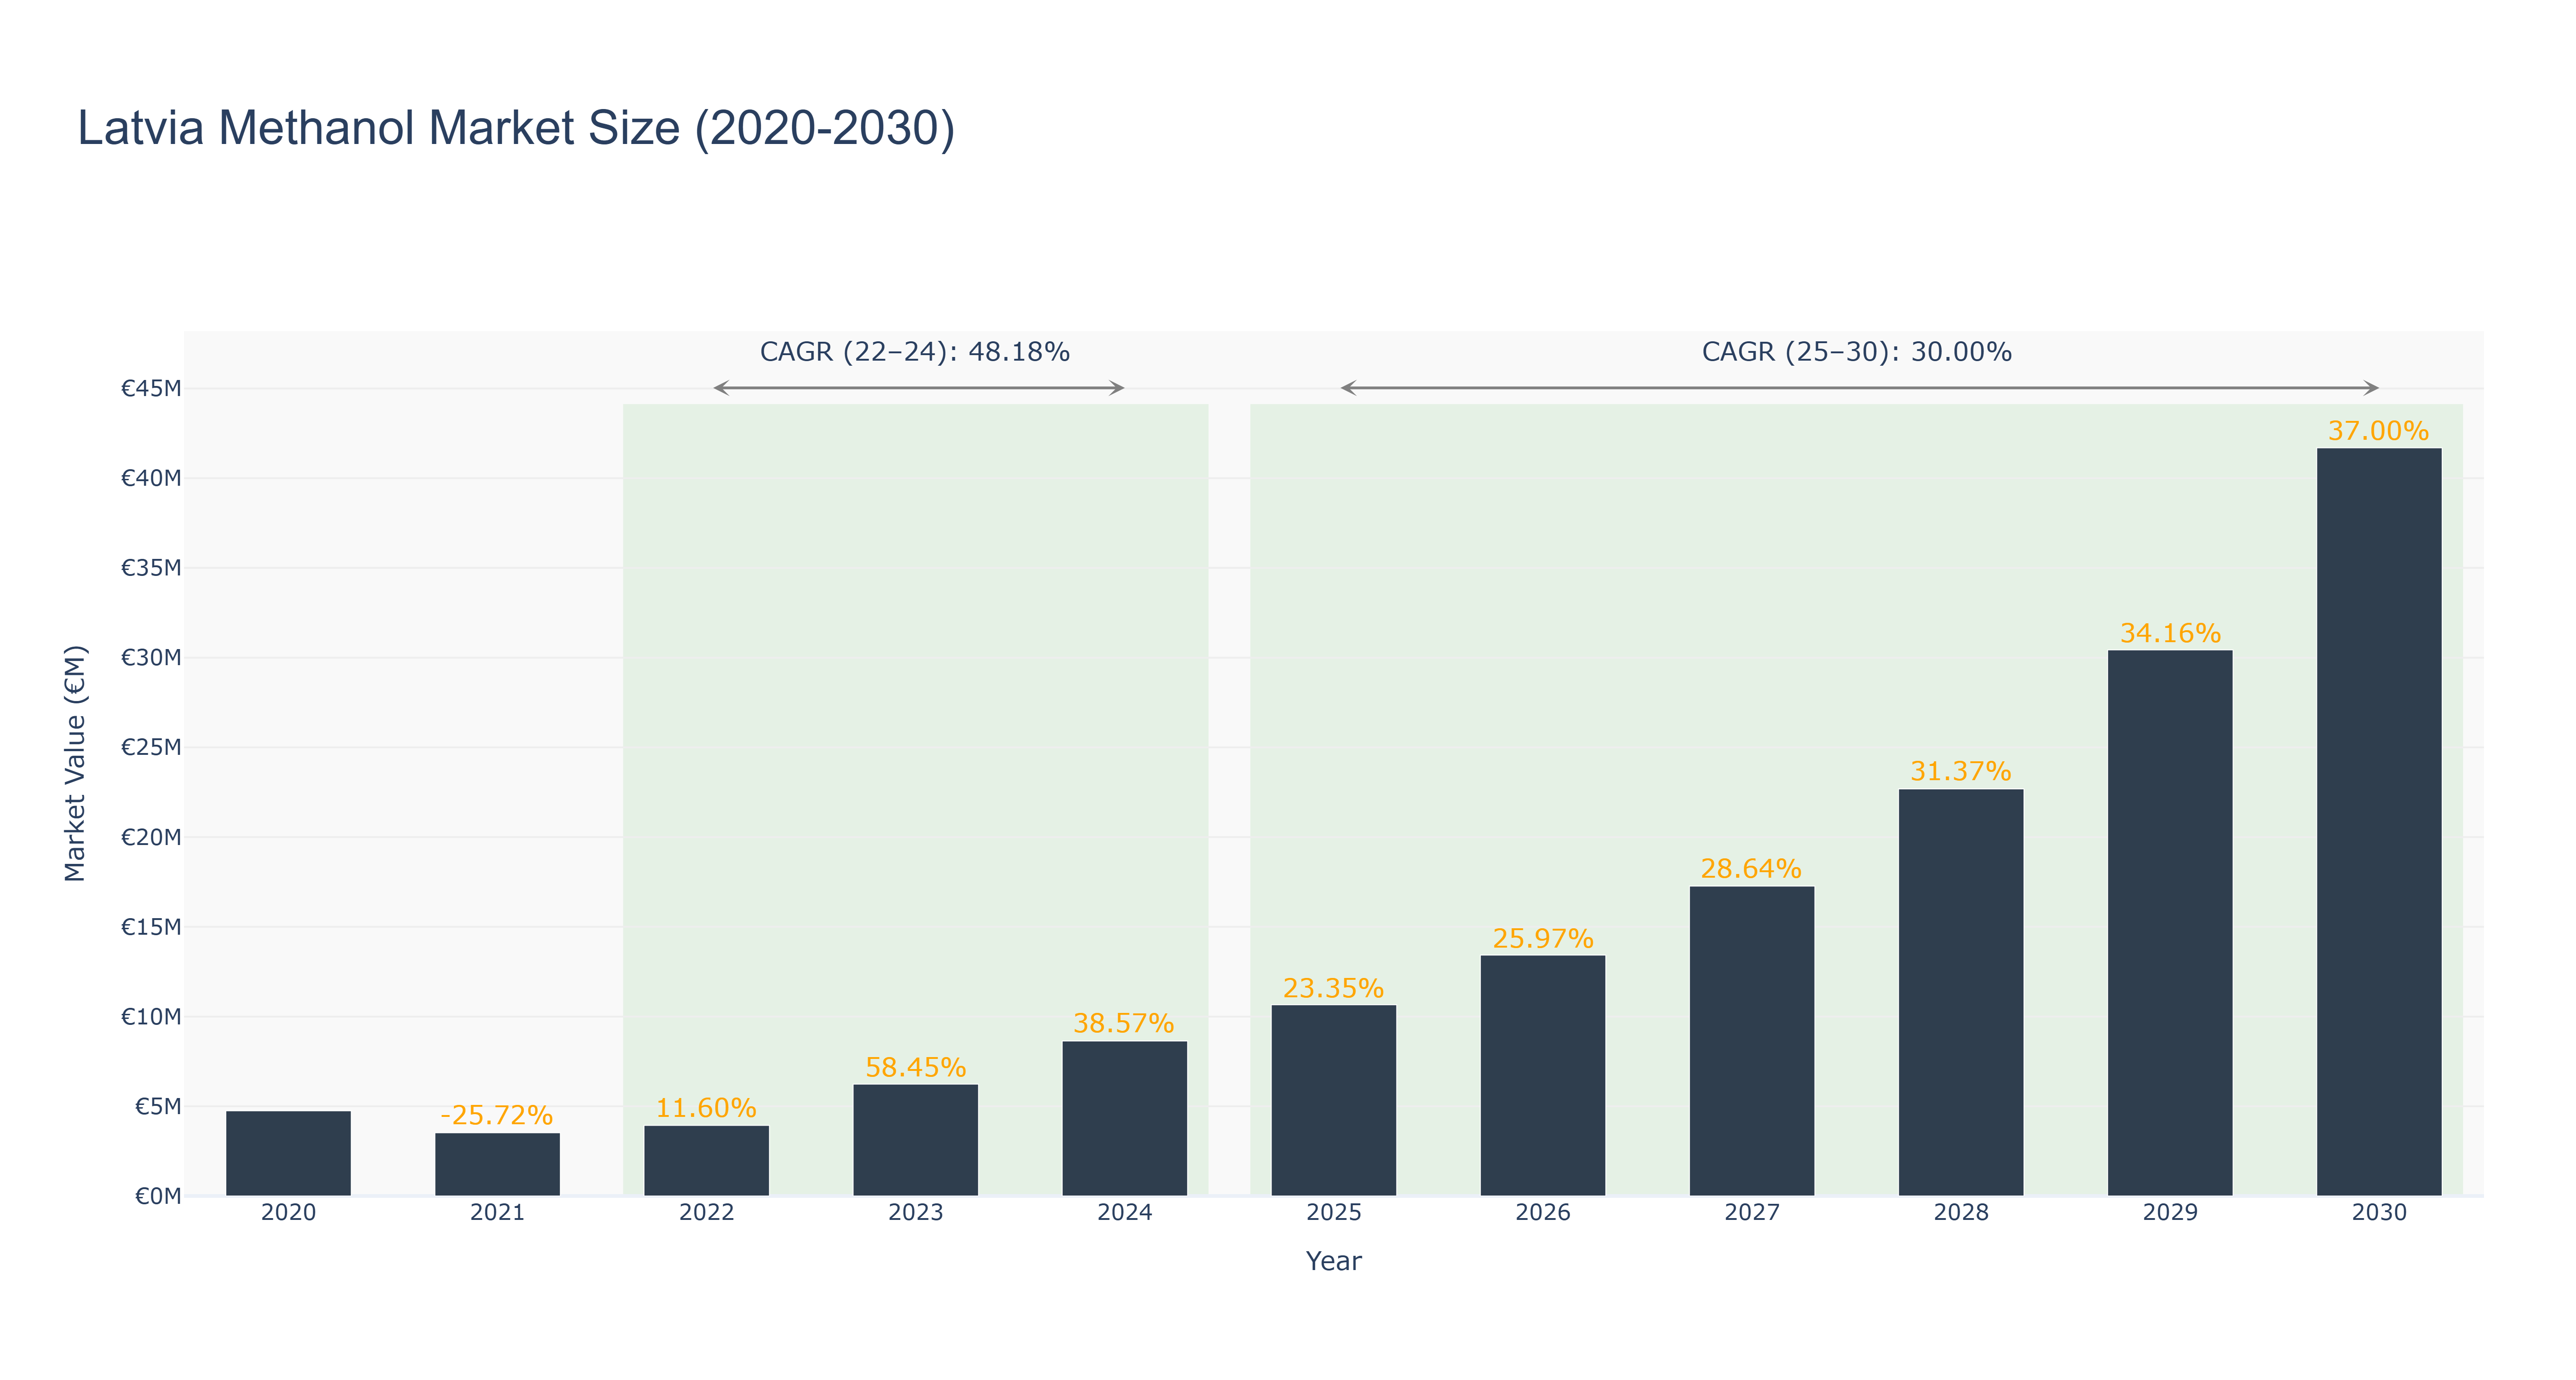
Latvia Methanol Market has shown a remarkable growth trajectory in recent years. The market peaked at €41.69 million in 2030, with a notable increase in size from €3.93 million in 2022 to €8.64 million in 2024. The forecasted market size is expected to continue its upward trend, reaching €30.43 million by 2029. The CAGR for the period 2022-24 stands at 48.18%, showcasing rapid expansion, while the CAGR for 2025-30 is projected at 30.0%. The market's growth can be attributed to increasing demand for methanol in various industries such as automotive, construction, and electronics. Looking ahead, Latvia is set to implement new sustainability initiatives in the methanol sector, focusing on eco-friendly production methods and enhancing market competitiveness. This strategic direction is poised to further bolster the market's growth and solidify its position in the global market landscape.
Latvia Methanol Market: Production & Trade Performance (2019-2025)
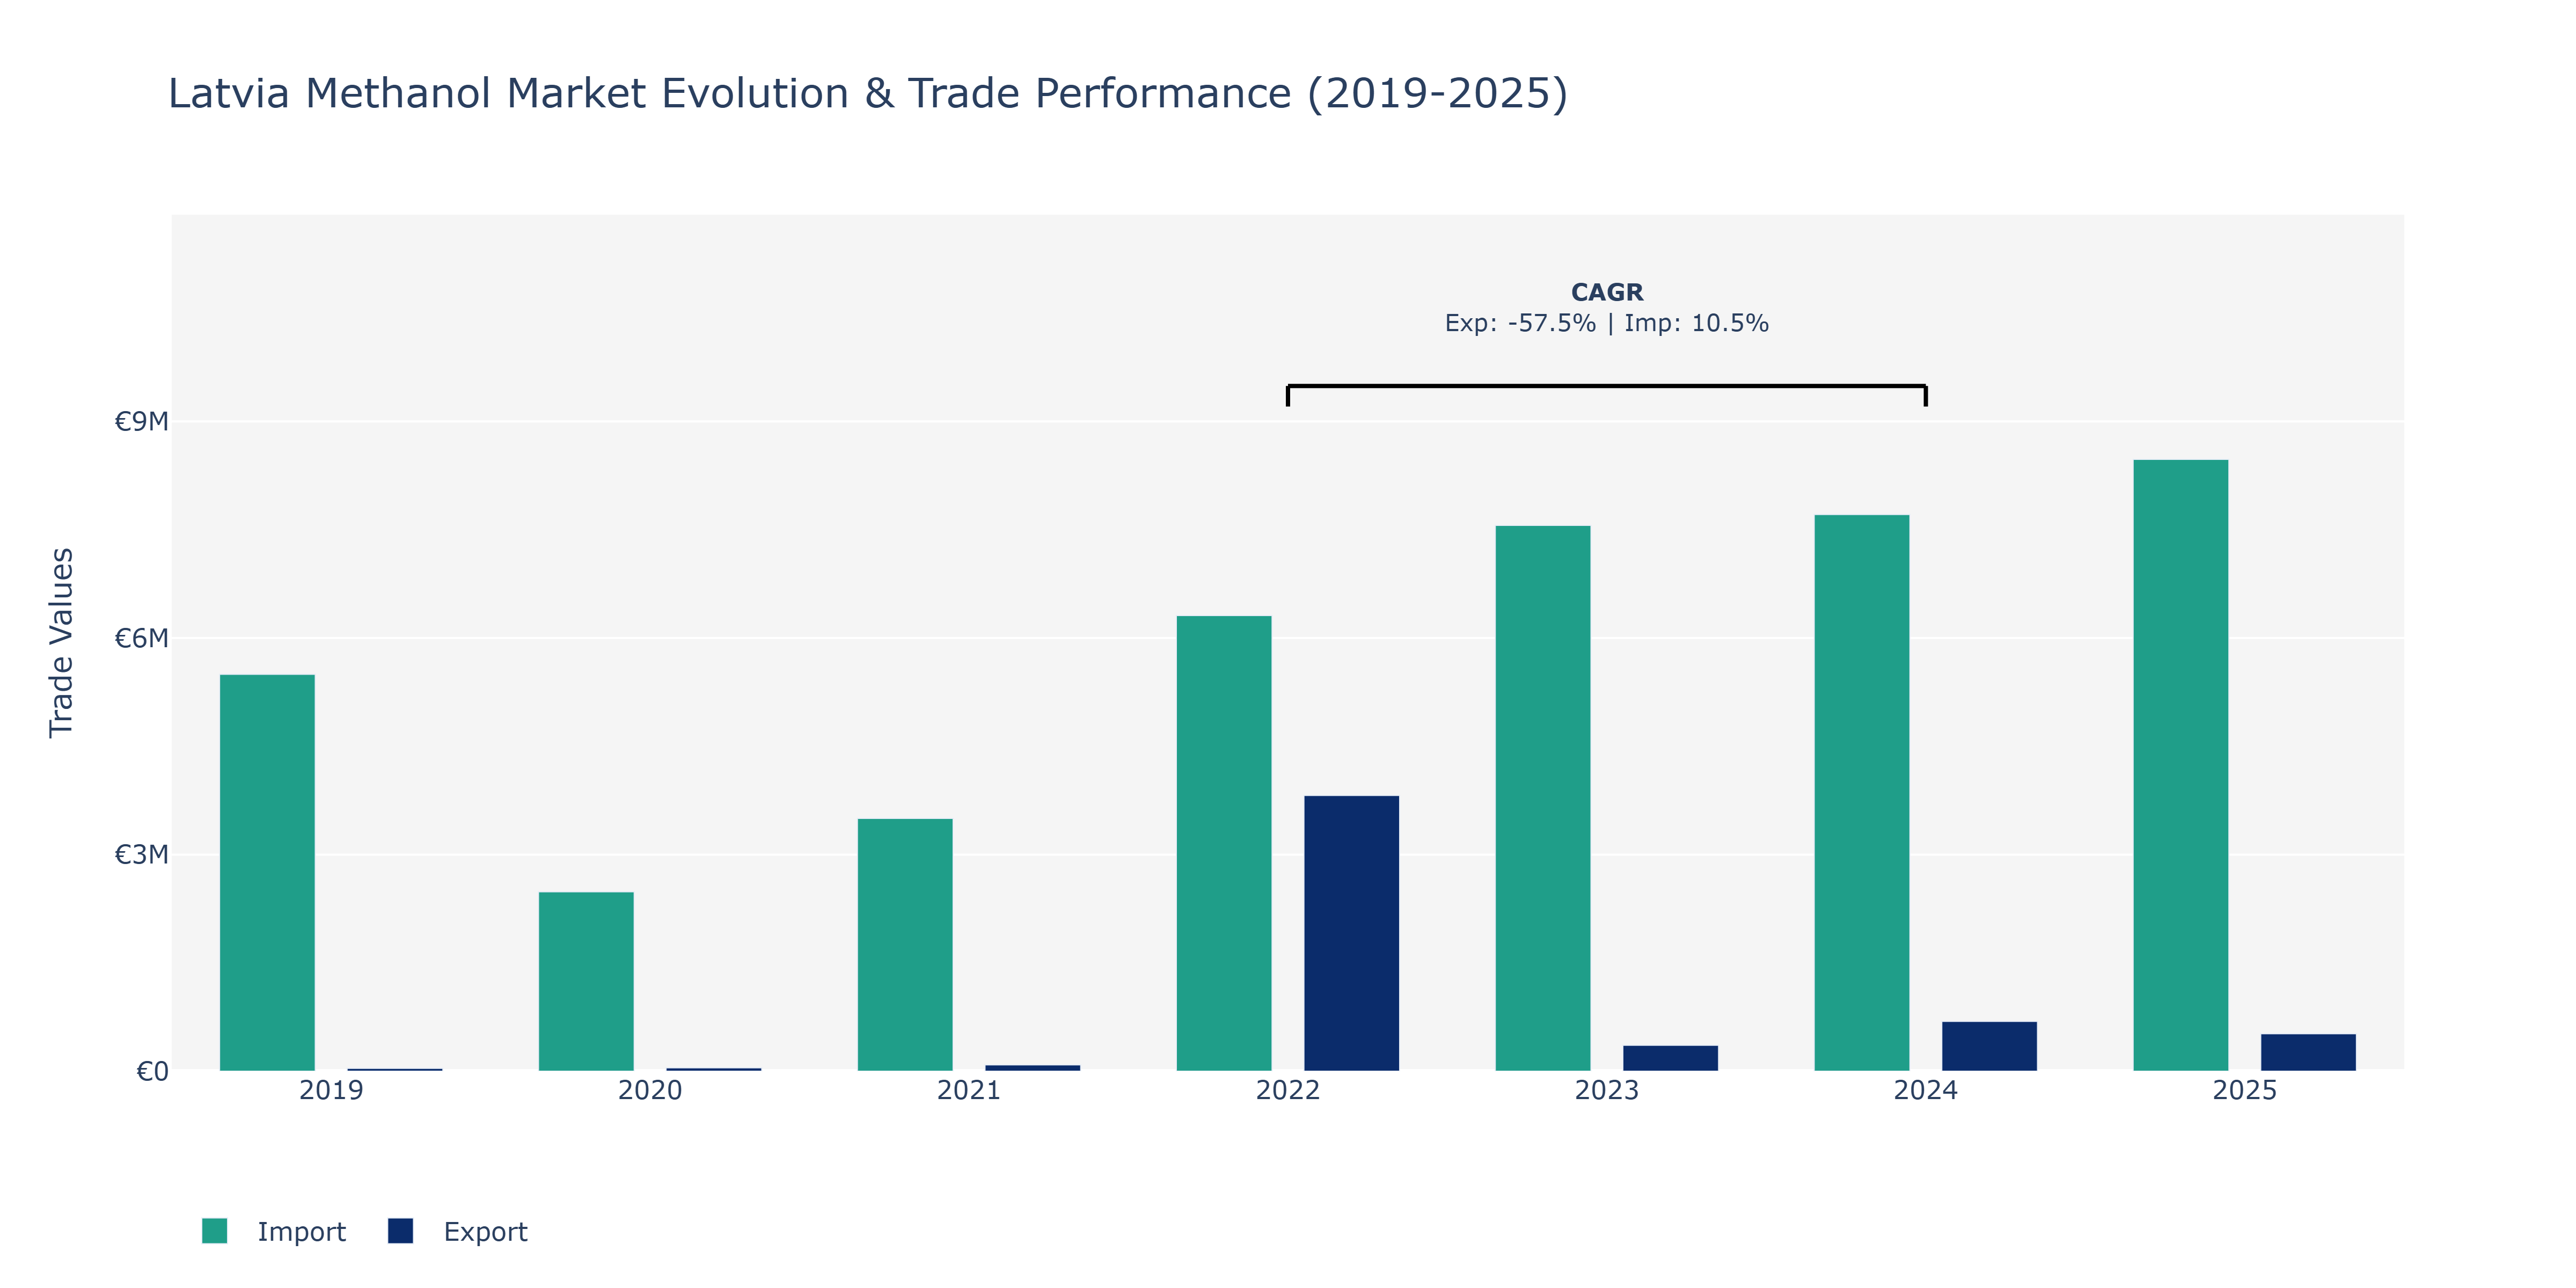
In the Latvia Methanol Market, exports and imports exhibit notable variations. Between 2019 and 2025, exports surged from €39.47 thousand to €517.91 thousand, with a peak at €3.82 million in 2022, reflecting an exceptional growth trajectory. Conversely, imports also experienced fluctuations, rising from €5.5 million in 2019 to €8.47 million in 2025. The peak import value was recorded in 2024 at €7.71 million. The substantial increase in exports can be attributed to the growing global demand for methanol as a feedstock in various industries, including chemicals and energy. On the other hand, the fluctuations in imports could be influenced by shifts in international market prices, supply chain disruptions, and evolving trade agreements impacting methanol imports in Latvia. Such trends highlight the market's responsiveness to both domestic and international factors, necessitating strategic planning to navigate the sector's dynamics effectively.
Key Highlights of the Report:
- Latvia Methanol Market Outlook
- Market Size of Latvia Methanol Market, 2025
- Forecast of Latvia Methanol Market, 2032
- Historical Data and Forecast of Latvia Methanol Revenues & Volume for the Period 2022 - 2032F
- Latvia Methanol Market Trend Evolution
- Latvia Methanol Market Drivers and Challenges
- Latvia Methanol Price Trends
- Latvia Methanol Porter`s Five Forces
- Latvia Methanol Industry Life Cycle
- Historical Data and Forecast of Latvia Methanol Market Revenues & Volume By Feedstock for the Period 2022 - 2032F
- Historical Data and Forecast of Latvia Methanol Market Revenues & Volume By Natural Gas for the Period 2022 - 2032F
- Historical Data and Forecast of Latvia Methanol Market Revenues & Volume By Coal for the Period 2022 - 2032F
- Historical Data and Forecast of Latvia Methanol Market Revenues & Volume By Others for the Period 2022 - 2032F
- Historical Data and Forecast of Latvia Methanol Market Revenues & Volume By Derivatives for the Period 2022 - 2032F
- Historical Data and Forecast of Latvia Methanol Market Revenues & Volume By Gasoline for the Period 2022 - 2032F
- Historical Data and Forecast of Latvia Methanol Market Revenues & Volume By MTO/MTP for the Period 2022 - 2032F
- Historical Data and Forecast of Latvia Methanol Market Revenues & Volume By Formaldehyde for the Period 2022 - 2032F
- Historical Data and Forecast of Latvia Methanol Market Revenues & Volume By Methyl Tertiary Butyl Ether (MTBE) for the Period 2022 - 2032F
- Historical Data and Forecast of Latvia Methanol Market Revenues & Volume By Acetic Acid for the Period 2022 - 2032F
- Historical Data and Forecast of Latvia Methanol Market Revenues & Volume By Dimethyl Ether (DME) for the Period 2022 - 2032F
- Historical Data and Forecast of Latvia Methanol Market Revenues & Volume By Methyl Methacrylate (MMA) for the Period 2022 - 2032F
- Historical Data and Forecast of Latvia Methanol Market Revenues & Volume By Others for the Period 2022 - 2032F
- Historical Data and Forecast of Latvia Methanol Market Revenues & Volume By Sub-Derivatives for the Period 2022 - 2032F
- Historical Data and Forecast of Latvia Methanol Market Revenues & Volume By Gasoline additives for the Period 2022 - 2032F
- Historical Data and Forecast of Latvia Methanol Market Revenues & Volume By Olefins for the Period 2022 - 2032F
- Historical Data and Forecast of Latvia Methanol Market Revenues & Volume By UF/PF resins for the Period 2022 - 2032F
- Historical Data and Forecast of Latvia Methanol Market Revenues & Volume By VAM for the Period 2022 - 2032F
- Historical Data and Forecast of Latvia Methanol Market Revenues & Volume By Polyacetals for the Period 2022 - 2032F
- Historical Data and Forecast of Latvia Methanol Market Revenues & Volume By MDI for the Period 2022 - 2032F
- Historical Data and Forecast of Latvia Methanol Market Revenues & Volume By PTA for the Period 2022 - 2032F
- Historical Data and Forecast of Latvia Methanol Market Revenues & Volume By Others for the Period 2022 - 2032F
- Historical Data and Forecast of Latvia Methanol Market Revenues & Volume By End-Use Industry for the Period 2022 - 2032F
- Historical Data and Forecast of Latvia Methanol Market Revenues & Volume By Construction for the Period 2022 - 2032F
- Historical Data and Forecast of Latvia Methanol Market Revenues & Volume By Automotive for the Period 2022 - 2032F
- Historical Data and Forecast of Latvia Methanol Market Revenues & Volume By Electronics for the Period 2022 - 2032F
- Historical Data and Forecast of Latvia Methanol Market Revenues & Volume By Appliances for the Period 2022 - 2032F
- Historical Data and Forecast of Latvia Methanol Market Revenues & Volume By Paints & Coatings for the Period 2022 - 2032F
- Historical Data and Forecast of Latvia Methanol Market Revenues & Volume By Insulation for the Period 2022 - 2032F
- Historical Data and Forecast of Latvia Methanol Market Revenues & Volume By Pharmaceuticals for the Period 2022 - 2032F
- Historical Data and Forecast of Latvia Methanol Market Revenues & Volume By Others for the Period 2022 - 2032F
- Latvia Methanol Import Export Trade Statistics
- Market Opportunity Assessment By Feedstock
- Market Opportunity Assessment By Derivatives
- Market Opportunity Assessment By Sub-Derivatives
- Market Opportunity Assessment By End-Use Industry
- Latvia Methanol Top Companies Market Share
- Latvia Methanol Competitive Benchmarking By Technical and Operational Parameters
- Latvia Methanol Company Profiles
- Latvia Methanol Key Strategic Recommendations
Frequently Asked Questions About the Market Study (FAQs):
6Wresearch actively monitors the Latvia Methanol Market and publishes its comprehensive annual report, highlighting emerging trends, growth drivers, revenue analysis, and forecast outlook. Our insights help businesses to make data-backed strategic decisions with ongoing market dynamics. Our analysts track relevent industries related to the Latvia Methanol Market, allowing our clients with actionable intelligence and reliable forecasts tailored to emerging regional needs.
Yes, we provide customisation as per your requirements. To learn more, feel free to contact us on sales@6wresearch.com
1 Executive Summary |
2 Introduction |
2.1 Key Highlights of the Report |
2.2 Report Description |
2.3 Market Scope & Segmentation |
2.4 Research Methodology |
2.5 Assumptions |
3 Latvia Methanol Market Overview |
3.1 Latvia Country Macro Economic Indicators |
3.2 Latvia Methanol Market Revenues & Volume, 2022 & 2032F |
3.3 Latvia Methanol Market - Industry Life Cycle |
3.4 Latvia Methanol Market - Porter's Five Forces |
3.5 Latvia Methanol Market Revenues & Volume Share, By Feedstock, 2022 & 2032F |
3.6 Latvia Methanol Market Revenues & Volume Share, By Derivatives, 2022 & 2032F |
3.7 Latvia Methanol Market Revenues & Volume Share, By Sub-Derivatives, 2022 & 2032F |
3.8 Latvia Methanol Market Revenues & Volume Share, By End-Use Industry, 2022 & 2032F |
4 Latvia Methanol Market Dynamics |
4.1 Impact Analysis |
4.2 Market Drivers |
4.2.1 Increasing demand for methanol as a feedstock in various industries such as chemicals, automotive, and construction. |
4.2.2 Government initiatives promoting the use of methanol as a cleaner alternative to traditional fuels. |
4.2.3 Growing investments in infrastructure and industrial development in Latvia. |
4.3 Market Restraints |
4.3.1 Volatility in methanol prices due to fluctuations in raw material costs and global market conditions. |
4.3.2 Environmental concerns related to the production and use of methanol, leading to stricter regulations. |
4.3.3 Competition from alternative fuels and chemicals impacting the market growth. |
5 Latvia Methanol Market Trends |
6 Latvia Methanol Market Segmentations |
6.1 Latvia Methanol Market, By Feedstock |
6.1.1 Overview and Analysis |
6.1.2 Latvia Methanol Market Revenues & Volume, By Natural Gas, 2022 - 2032F |
6.1.3 Latvia Methanol Market Revenues & Volume, By Coal, 2022 - 2032F |
6.1.4 Latvia Methanol Market Revenues & Volume, By Others, 2022 - 2032F |
6.2 Latvia Methanol Market, By Derivatives |
6.2.1 Overview and Analysis |
6.2.2 Latvia Methanol Market Revenues & Volume, By Gasoline, 2022 - 2032F |
6.2.3 Latvia Methanol Market Revenues & Volume, By MTO/MTP, 2022 - 2032F |
6.2.4 Latvia Methanol Market Revenues & Volume, By Formaldehyde, 2022 - 2032F |
6.2.5 Latvia Methanol Market Revenues & Volume, By Methyl Tertiary Butyl Ether (MTBE), 2022 - 2032F |
6.2.6 Latvia Methanol Market Revenues & Volume, By Acetic Acid, 2022 - 2032F |
6.2.7 Latvia Methanol Market Revenues & Volume, By Dimethyl Ether (DME), 2022 - 2032F |
6.2.8 Latvia Methanol Market Revenues & Volume, By Others, 2022 - 2032F |
6.2.9 Latvia Methanol Market Revenues & Volume, By Others, 2022 - 2032F |
6.3 Latvia Methanol Market, By Sub-Derivatives |
6.3.1 Overview and Analysis |
6.3.2 Latvia Methanol Market Revenues & Volume, By Gasoline additives, 2022 - 2032F |
6.3.3 Latvia Methanol Market Revenues & Volume, By Olefins, 2022 - 2032F |
6.3.4 Latvia Methanol Market Revenues & Volume, By UF/PF resins, 2022 - 2032F |
6.3.5 Latvia Methanol Market Revenues & Volume, By VAM, 2022 - 2032F |
6.3.6 Latvia Methanol Market Revenues & Volume, By Polyacetals, 2022 - 2032F |
6.3.7 Latvia Methanol Market Revenues & Volume, By MDI, 2022 - 2032F |
6.3.8 Latvia Methanol Market Revenues & Volume, By Others, 2022 - 2032F |
6.3.9 Latvia Methanol Market Revenues & Volume, By Others, 2022 - 2032F |
6.4 Latvia Methanol Market, By End-Use Industry |
6.4.1 Overview and Analysis |
6.4.2 Latvia Methanol Market Revenues & Volume, By Construction, 2022 - 2032F |
6.4.3 Latvia Methanol Market Revenues & Volume, By Automotive, 2022 - 2032F |
6.4.4 Latvia Methanol Market Revenues & Volume, By Electronics, 2022 - 2032F |
6.4.5 Latvia Methanol Market Revenues & Volume, By Appliances, 2022 - 2032F |
6.4.6 Latvia Methanol Market Revenues & Volume, By Paints & Coatings, 2022 - 2032F |
6.4.7 Latvia Methanol Market Revenues & Volume, By Insulation, 2022 - 2032F |
6.4.8 Latvia Methanol Market Revenues & Volume, By Others, 2022 - 2032F |
6.4.9 Latvia Methanol Market Revenues & Volume, By Others, 2022 - 2032F |
7 Latvia Methanol Market Import-Export Trade Statistics |
7.1 Latvia Methanol Market Export to Major Countries |
7.2 Latvia Methanol Market Imports from Major Countries |
8 Latvia Methanol Market Key Performance Indicators |
8.1 Methanol production capacity expansion rate in Latvia. |
8.2 Adoption rate of methanol-based technologies in key industries. |
8.3 Number of new methanol production facilities established in the country. |
8.4 Research and development investments in methanol technologies and applications. |
8.5 Carbon footprint reduction attributed to the use of methanol in Latvia. |
9 Latvia Methanol Market - Opportunity Assessment |
9.1 Latvia Methanol Market Opportunity Assessment, By Feedstock, 2022 & 2032F |
9.2 Latvia Methanol Market Opportunity Assessment, By Derivatives, 2022 & 2032F |
9.3 Latvia Methanol Market Opportunity Assessment, By Sub-Derivatives, 2022 & 2032F |
9.4 Latvia Methanol Market Opportunity Assessment, By End-Use Industry, 2022 & 2032F |
10 Latvia Methanol Market - Competitive Landscape |
10.1 Latvia Methanol Market Revenue Share, By Companies, 2025 |
10.2 Latvia Methanol Market Competitive Benchmarking, By Operating and Technical Parameters |
11 Company Profiles |
12 Recommendations | 13 Disclaimer |
Global Go To Market Strategy - 2030
Export potential enables firms to identify high-growth global markets with greater confidence by combining advanced trade intelligence with a structured quantitative methodology. The framework analyzes emerging demand trends and country-level import patterns while integrating macroeconomic and trade datasets such as GDP and population forecasts, bilateral import–export flows, tariff structures, elasticity differentials between developed and developing economies, geographic distance, and import demand projections. Using weighted trade values from 2020–2024 as the base period to project country-to-country export potential for 2030, these inputs are operationalized through calculated drivers such as gravity model parameters, tariff impact factors, and projected GDP per-capita growth. Through an analysis of hidden potentials, demand hotspots, and market conditions that are most favorable to success, this method enables firms to focus on target countries, maximize returns, and global expansion with data, backed by accuracy.
By factoring in the projected importer demand gap that is currently unmet and could be potential opportunity, it identifies the potential for the Exporter (Country) among 190 countries, against the general trade analysis, which identifies the biggest importer or exporter.
To discover high-growth global markets and optimize your business strategy:
Click Here
Pricing
- Single User License$ 1,995
- Department License$ 2,400
- Site License$ 3,120
- Global License$ 3,795

Leadership Perspectives from Industry Events
Search
Thought Leadership and Analyst Meet


Our Clients
6WResearch In News
- India Export Attractiveness Tracker 2026
- India Air Conditioner Market Set for Strong Rebound in 2026 After Weather-Led Correction and GST-Driven Recovery: 6Wresearch
- ADAS in India: How Automatic Emergency Braking, Blind Spot Detection & Driver Monitoring are Transforming Road Safety
- Doha a strategic location for EV manufacturing hub: IPA Qatar
- Demand for luxury TVs surging in the GCC, says Samsung
- Empowering Growth: The Thriving Journey of Bangladesh’s Cable Industry
Latest Reports
- Nicaragua RPG Gaming Market (2026-2032)
- New Zealand RPG Gaming Market (2026-2032)
- Netherlands RPG Gaming Market (2026-2032)
- Nauru RPG Gaming Market (2026-2032)
- Namibia RPG Gaming Market (2026-2032)
- Mozambique RPG Gaming Market (2026-2032)
- Montenegro RPG Gaming Market (2026-2032)
- Mongolia RPG Gaming Market (2026-2032)
- Monaco RPG Gaming Market (2026-2032)
- Micronesia RPG Gaming Market (2026-2032)
Industry Events and Analyst Meet

EV India Expo 2026

HIMTEX 2026

India Refining Summit 2026

India EV Show 2026

EV tech India Expo 2026
Whitepaper
- Middle East & Africa Commercial Security Market Click here to view more.
- Middle East & Africa Fire Safety Systems & Equipment Market Click here to view more.
- GCC Drone Market Click here to view more.
- Middle East Lighting Fixture Market Click here to view more.
- GCC Physical & Perimeter Security Market Click here to view more.