Latvia Orange Juice Market (2026-2032) | Size, Growth, Share, Analysis, Forecast, Value, Segmentation, Revenue, Trends, Industry, Outlook & Companies
Market Forecast By Product Type (Frozen Concentrated Orange Juice, Not From Concentrate, Canned Orange Juice, Fresh-Squeezed Orange juice, Dehydrated Orange Juice, Others), By Packaging (Tetra Pak, PP Material Bottle, Metal Can, Others), By Distribution Channel (Offline Channel, Online Channel) And Competitive Landscape
| Product Code: ETC5018676 | Publication Date: Nov 2023 | Updated Date: Apr 2026 | Product Type: Market Research Report | |
| Publisher: 6Wresearch | Author: Shubham Padhi | No. of Pages: 60 | No. of Figures: 30 | No. of Tables: 5 |
Latvia Orange Juice Market Size (2020-2030)
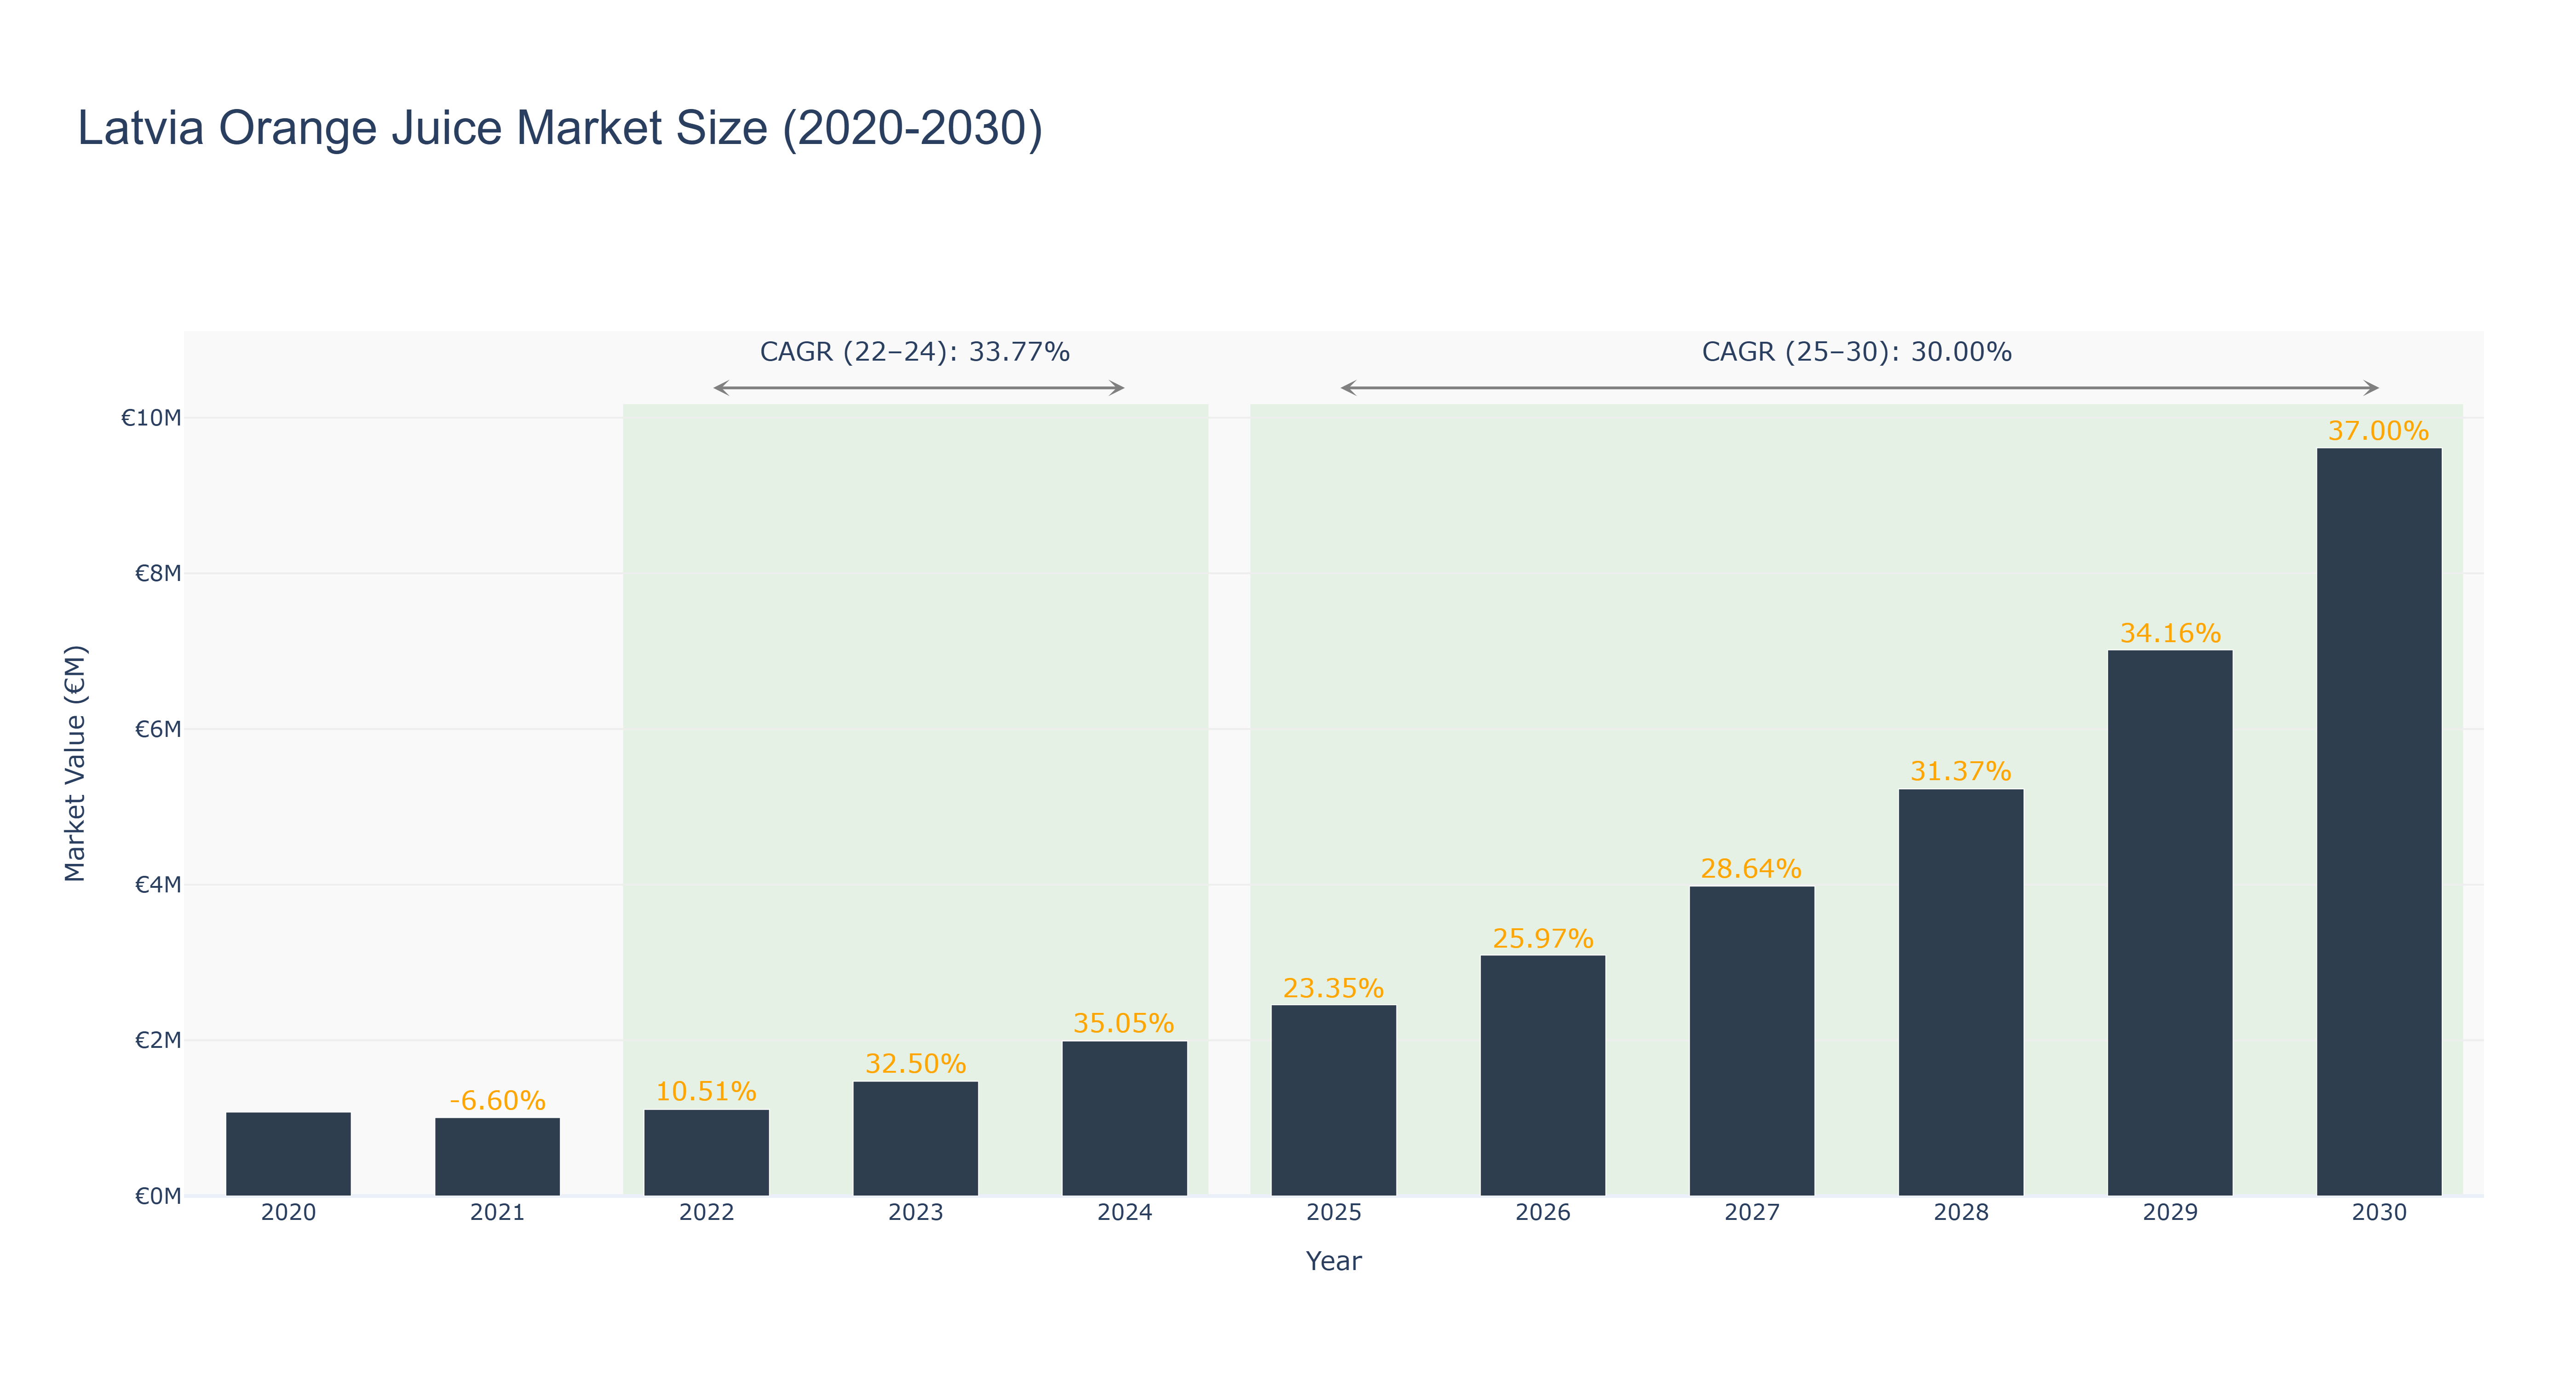
Latvia Orange Juice Market has shown a remarkable growth trajectory over the years. The peak market size of €9.61 million in 2030 marks a significant milestone. From 2020 to 2024, the market size increased steadily from €1.08 million to €1.99 million, with a notable surge in 2023 and 2024. The forecasted growth from 2025 to 2030 is promising, with an expected market size of €3.09 million in 2025 to €9.61 million in 2030. The CAGR values for the market are impressive, with a CAGR of 33.77% from 2022 to 2024 and 30.0% from 2025 to 2030. The industry drivers behind this growth include increasing health consciousness among consumers and a growing trend towards natural and organic beverages. Looking ahead, Latvia is set to introduce new agricultural initiatives to boost the production of oranges locally, further fueling the market's expansion.
Latvia Orange Juice Market: Production & Trade Performance (2019-2025)
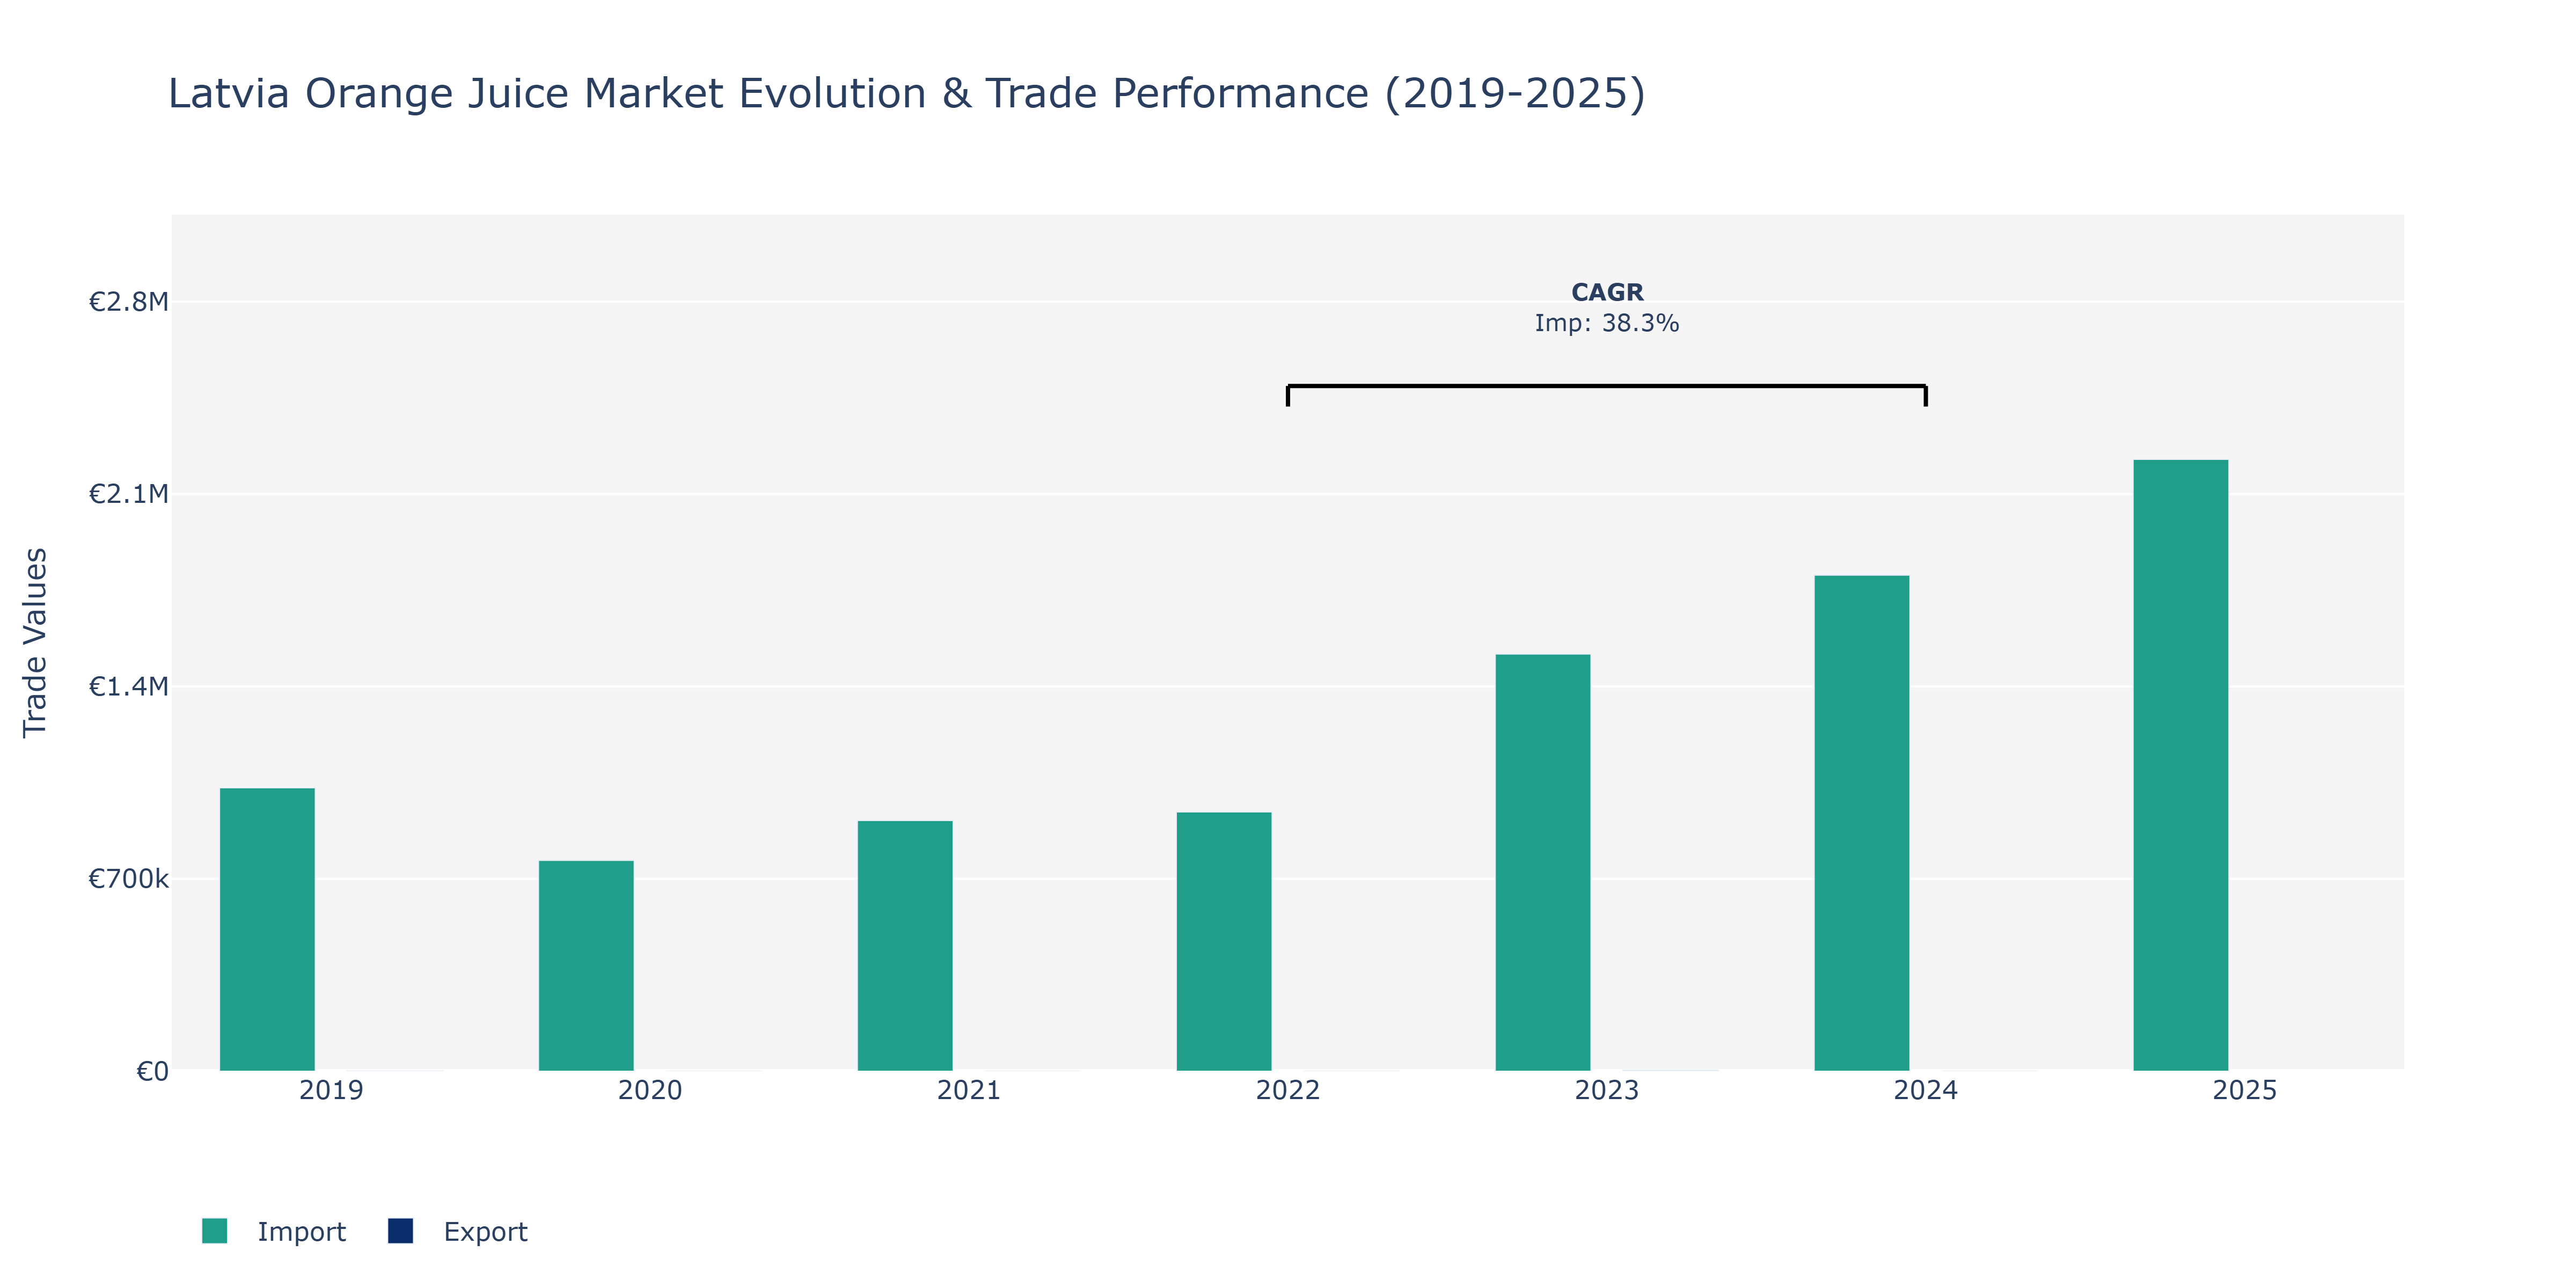
Between 2019 and 2025, Latvia's Orange Juice Market saw notable shifts in both exports and imports. In 2019, exports stood at €1.05 thousand, a figure that sharply dropped in 2023 to €3.62 thousand. This decline may be attributed to various factors such as supply chain disruptions, changing consumer preferences, or intensified competition. On the imports side, a continuous upward trajectory was observed, with values increasing from €1.03 million in 2019 to €2.23 million in 2025. The consistent growth in imports could be linked to rising domestic demand, expanding distribution channels, or increased consumption of orange juice products in Latvia. Notably, the market experienced a significant surge in imports with a 38.33% CAGR between 2022 and 2024, indicating a strong market appetite for imported orange juice products during this period. Such growth could be supported by factors like improved trade agreements, favorable exchange rates, or the introduction of new product variants in the market.
Key Highlights of the Report:
- Latvia Orange Juice Market Outlook
- Market Size of Latvia Orange Juice Market, 2025
- Forecast of Latvia Orange Juice Market, 2032
- Historical Data and Forecast of Latvia Orange Juice Revenues & Volume for the Period 2022 - 2032F
- Latvia Orange Juice Market Trend Evolution
- Latvia Orange Juice Market Drivers and Challenges
- Latvia Orange Juice Price Trends
- Latvia Orange Juice Porter`s Five Forces
- Latvia Orange Juice Industry Life Cycle
- Historical Data and Forecast of Latvia Orange Juice Market Revenues & Volume By Product Type for the Period 2022 - 2032F
- Historical Data and Forecast of Latvia Orange Juice Market Revenues & Volume By Frozen Concentrated Orange Juice for the Period 2022 - 2032F
- Historical Data and Forecast of Latvia Orange Juice Market Revenues & Volume By Not From Concentrate for the Period 2022 - 2032F
- Historical Data and Forecast of Latvia Orange Juice Market Revenues & Volume By Canned Orange Juice for the Period 2022 - 2032F
- Historical Data and Forecast of Latvia Orange Juice Market Revenues & Volume By Fresh-Squeezed Orange juice, for the Period 2022 - 2032F
- Historical Data and Forecast of Latvia Orange Juice Market Revenues & Volume By Dehydrated Orange Juice for the Period 2022 - 2032F
- Historical Data and Forecast of Latvia Orange Juice Market Revenues & Volume By Others for the Period 2022 - 2032F
- Historical Data and Forecast of Latvia Orange Juice Market Revenues & Volume By Packaging for the Period 2022 - 2032F
- Historical Data and Forecast of Latvia Orange Juice Market Revenues & Volume By Tetra Pak for the Period 2022 - 2032F
- Historical Data and Forecast of Latvia Orange Juice Market Revenues & Volume By PP Material Bottle for the Period 2022 - 2032F
- Historical Data and Forecast of Latvia Orange Juice Market Revenues & Volume By Metal Can for the Period 2022 - 2032F
- Historical Data and Forecast of Latvia Orange Juice Market Revenues & Volume By Others for the Period 2022 - 2032F
- Historical Data and Forecast of Latvia Orange Juice Market Revenues & Volume By Distribution Channel for the Period 2022 - 2032F
- Historical Data and Forecast of Latvia Orange Juice Market Revenues & Volume By Offline Channel for the Period 2022 - 2032F
- Historical Data and Forecast of Latvia Orange Juice Market Revenues & Volume By Online Channel for the Period 2022 - 2032F
- Latvia Orange Juice Import Export Trade Statistics
- Market Opportunity Assessment By Product Type
- Market Opportunity Assessment By Packaging
- Market Opportunity Assessment By Distribution Channel
- Latvia Orange Juice Top Companies Market Share
- Latvia Orange Juice Competitive Benchmarking By Technical and Operational Parameters
- Latvia Orange Juice Company Profiles
- Latvia Orange Juice Key Strategic Recommendations
Frequently Asked Questions About the Market Study (FAQs):
6Wresearch actively monitors the Latvia Orange Juice Market and publishes its comprehensive annual report, highlighting emerging trends, growth drivers, revenue analysis, and forecast outlook. Our insights help businesses to make data-backed strategic decisions with ongoing market dynamics. Our analysts track relevent industries related to the Latvia Orange Juice Market, allowing our clients with actionable intelligence and reliable forecasts tailored to emerging regional needs.
Yes, we provide customisation as per your requirements. To learn more, feel free to contact us on sales@6wresearch.com
1 Executive Summary |
2 Introduction |
2.1 Key Highlights of the Report |
2.2 Report Description |
2.3 Market Scope & Segmentation |
2.4 Research Methodology |
2.5 Assumptions |
3 Latvia Orange Juice Market Overview |
3.1 Latvia Country Macro Economic Indicators |
3.2 Latvia Orange Juice Market Revenues & Volume, 2022 & 2032F |
3.3 Latvia Orange Juice Market - Industry Life Cycle |
3.4 Latvia Orange Juice Market - Porter's Five Forces |
3.5 Latvia Orange Juice Market Revenues & Volume Share, By Product Type, 2022 & 2032F |
3.6 Latvia Orange Juice Market Revenues & Volume Share, By Packaging, 2022 & 2032F |
3.7 Latvia Orange Juice Market Revenues & Volume Share, By Distribution Channel, 2022 & 2032F |
4 Latvia Orange Juice Market Dynamics |
4.1 Impact Analysis |
4.2 Market Drivers |
4.2.1 Increasing consumer focus on health and wellness leading to higher demand for natural and nutritious beverages like orange juice |
4.2.2 Growing awareness about the benefits of vitamin C and other nutrients present in orange juice |
4.2.3 Rising disposable income of the population in Latvia, allowing for increased spending on premium and healthy beverage options |
4.3 Market Restraints |
4.3.1 Seasonal availability of oranges leading to fluctuations in supply and pricing |
4.3.2 Competition from other healthy beverage options such as smoothies, herbal teas, and functional drinks |
4.3.3 Concerns regarding sugar content in orange juice impacting consumer perception and purchase decisions |
5 Latvia Orange Juice Market Trends |
6 Latvia Orange Juice Market Segmentations |
6.1 Latvia Orange Juice Market, By Product Type |
6.1.1 Overview and Analysis |
6.1.2 Latvia Orange Juice Market Revenues & Volume, By Frozen Concentrated Orange Juice, 2022 - 2032F |
6.1.3 Latvia Orange Juice Market Revenues & Volume, By Not From Concentrate, 2022 - 2032F |
6.1.4 Latvia Orange Juice Market Revenues & Volume, By Canned Orange Juice, 2022 - 2032F |
6.1.5 Latvia Orange Juice Market Revenues & Volume, By Fresh-Squeezed Orange juice,, 2022 - 2032F |
6.1.6 Latvia Orange Juice Market Revenues & Volume, By Dehydrated Orange Juice, 2022 - 2032F |
6.1.7 Latvia Orange Juice Market Revenues & Volume, By Others, 2022 - 2032F |
6.2 Latvia Orange Juice Market, By Packaging |
6.2.1 Overview and Analysis |
6.2.2 Latvia Orange Juice Market Revenues & Volume, By Tetra Pak, 2022 - 2032F |
6.2.3 Latvia Orange Juice Market Revenues & Volume, By PP Material Bottle, 2022 - 2032F |
6.2.4 Latvia Orange Juice Market Revenues & Volume, By Metal Can, 2022 - 2032F |
6.2.5 Latvia Orange Juice Market Revenues & Volume, By Others, 2022 - 2032F |
6.3 Latvia Orange Juice Market, By Distribution Channel |
6.3.1 Overview and Analysis |
6.3.2 Latvia Orange Juice Market Revenues & Volume, By Offline Channel, 2022 - 2032F |
6.3.3 Latvia Orange Juice Market Revenues & Volume, By Online Channel, 2022 - 2032F |
7 Latvia Orange Juice Market Import-Export Trade Statistics |
7.1 Latvia Orange Juice Market Export to Major Countries |
7.2 Latvia Orange Juice Market Imports from Major Countries |
8 Latvia Orange Juice Market Key Performance Indicators |
8.1 Consumer awareness levels of the health benefits of orange juice |
8.2 Percentage of households purchasing orange juice regularly |
8.3 Number of new product launches or innovations in the orange juice market in Latvia |
9 Latvia Orange Juice Market - Opportunity Assessment |
9.1 Latvia Orange Juice Market Opportunity Assessment, By Product Type, 2022 & 2032F |
9.2 Latvia Orange Juice Market Opportunity Assessment, By Packaging, 2022 & 2032F |
9.3 Latvia Orange Juice Market Opportunity Assessment, By Distribution Channel, 2022 & 2032F |
10 Latvia Orange Juice Market - Competitive Landscape |
10.1 Latvia Orange Juice Market Revenue Share, By Companies, 2025 |
10.2 Latvia Orange Juice Market Competitive Benchmarking, By Operating and Technical Parameters |
11 Company Profiles |
12 Recommendations | 13 Disclaimer |
Global Go To Market Strategy - 2030
Export potential enables firms to identify high-growth global markets with greater confidence by combining advanced trade intelligence with a structured quantitative methodology. The framework analyzes emerging demand trends and country-level import patterns while integrating macroeconomic and trade datasets such as GDP and population forecasts, bilateral import–export flows, tariff structures, elasticity differentials between developed and developing economies, geographic distance, and import demand projections. Using weighted trade values from 2020–2024 as the base period to project country-to-country export potential for 2030, these inputs are operationalized through calculated drivers such as gravity model parameters, tariff impact factors, and projected GDP per-capita growth. Through an analysis of hidden potentials, demand hotspots, and market conditions that are most favorable to success, this method enables firms to focus on target countries, maximize returns, and global expansion with data, backed by accuracy.
By factoring in the projected importer demand gap that is currently unmet and could be potential opportunity, it identifies the potential for the Exporter (Country) among 190 countries, against the general trade analysis, which identifies the biggest importer or exporter.
To discover high-growth global markets and optimize your business strategy:
Click Here
Pricing
- Single User License$ 1,995
- Department License$ 2,400
- Site License$ 3,120
- Global License$ 3,795

Leadership Perspectives from Industry Events
Search
Thought Leadership and Analyst Meet


Our Clients
6WResearch In News
- India Export Attractiveness Tracker 2026
- India Air Conditioner Market Set for Strong Rebound in 2026 After Weather-Led Correction and GST-Driven Recovery: 6Wresearch
- ADAS in India: How Automatic Emergency Braking, Blind Spot Detection & Driver Monitoring are Transforming Road Safety
- Doha a strategic location for EV manufacturing hub: IPA Qatar
- Demand for luxury TVs surging in the GCC, says Samsung
- Empowering Growth: The Thriving Journey of Bangladesh’s Cable Industry
Latest Reports
- Nicaragua RPG Gaming Market (2026-2032)
- New Zealand RPG Gaming Market (2026-2032)
- Netherlands RPG Gaming Market (2026-2032)
- Nauru RPG Gaming Market (2026-2032)
- Namibia RPG Gaming Market (2026-2032)
- Mozambique RPG Gaming Market (2026-2032)
- Montenegro RPG Gaming Market (2026-2032)
- Mongolia RPG Gaming Market (2026-2032)
- Monaco RPG Gaming Market (2026-2032)
- Micronesia RPG Gaming Market (2026-2032)
Industry Events and Analyst Meet

EV India Expo 2026

HIMTEX 2026

India Refining Summit 2026

India EV Show 2026

EV tech India Expo 2026
Whitepaper
- Middle East & Africa Commercial Security Market Click here to view more.
- Middle East & Africa Fire Safety Systems & Equipment Market Click here to view more.
- GCC Drone Market Click here to view more.
- Middle East Lighting Fixture Market Click here to view more.
- GCC Physical & Perimeter Security Market Click here to view more.