Latvia Pneumatic Valves Market (2026-2032) | Value, Companies, Growth, Forecast, Segmentation, Outlook, Revenue, Share, Trends, Analysis, Size & Industry
Market Forecast By Product Type (Sliding shaft, Rotating shaft), By End-Users (Chemicals and petrochemicals, Power generation and management, Mining, Water and wastewater management) And Competitive Landscape
| Product Code: ETC5076664 | Publication Date: Nov 2023 | Updated Date: Apr 2026 | Product Type: Market Research Report | |
| Publisher: 6Wresearch | Author: Shubham Padhi | No. of Pages: 60 | No. of Figures: 30 | No. of Tables: 5 |
Latvia Pneumatic Valves Market Size (2020-2030)
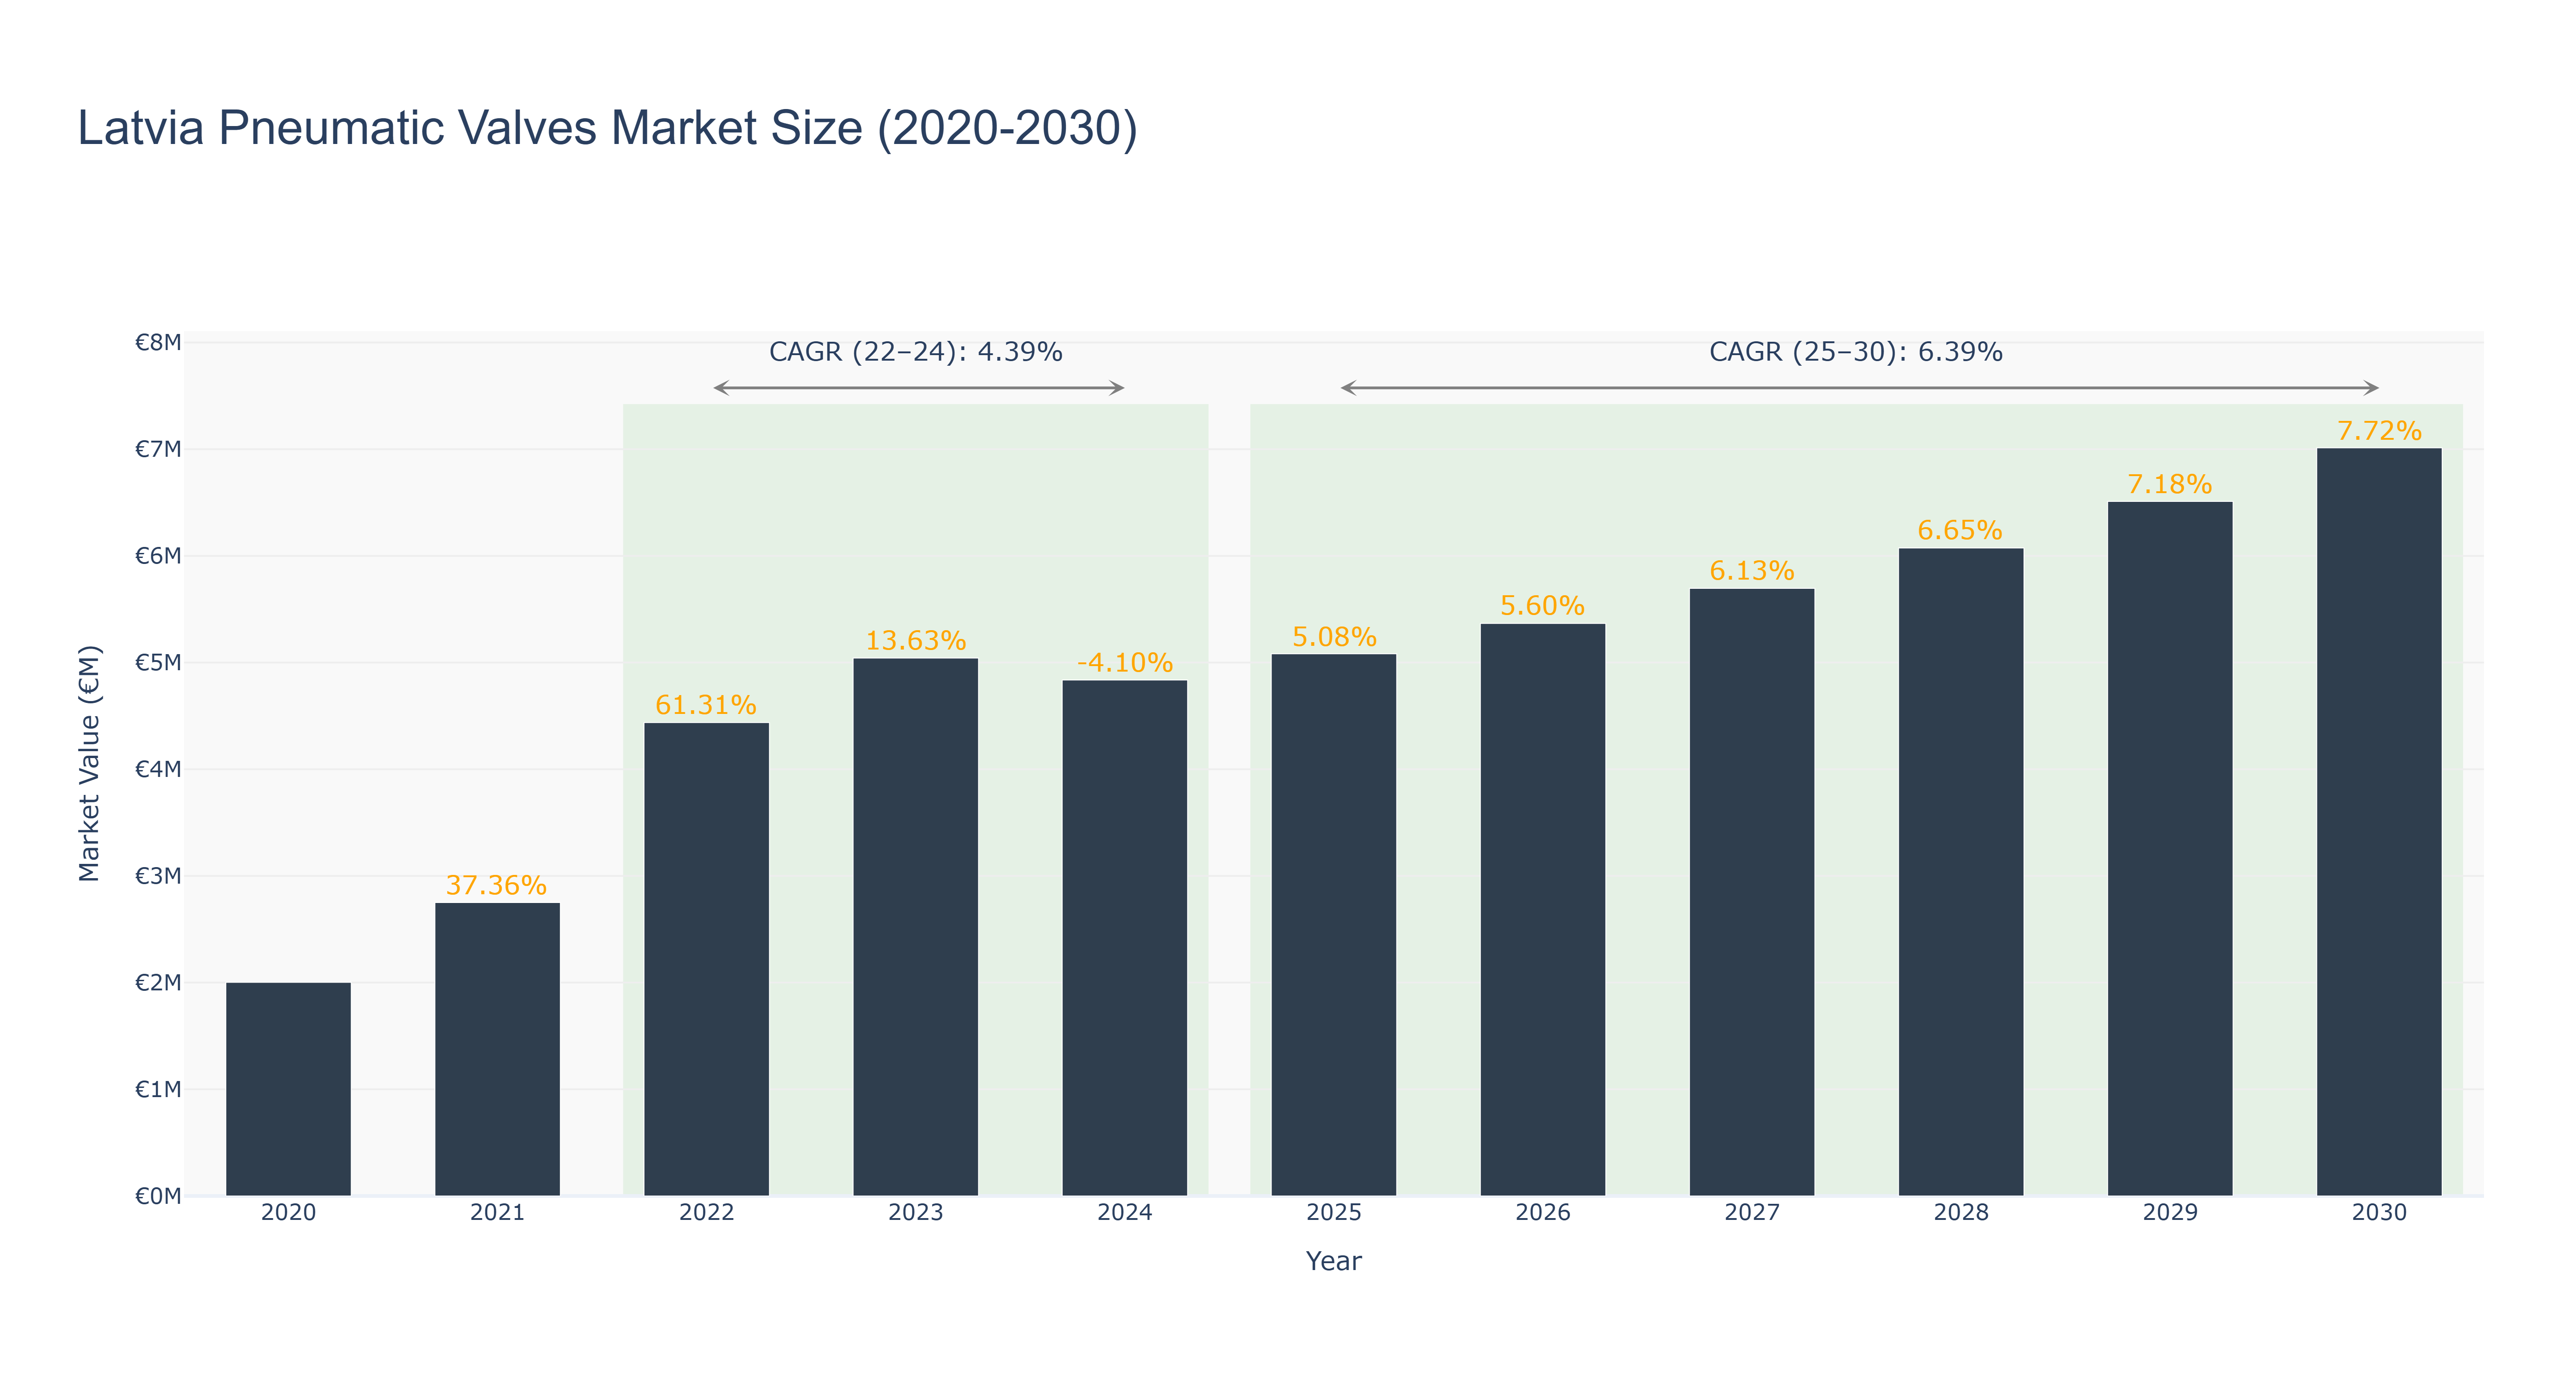
Latvia Pneumatic Valves Market has shown a steady growth trajectory over the years. The peak market size of €7.01 million was reached in 2030, with a consistent increase from €2.00 million in 2020. The market experienced fluctuations, with a slight decline in 2024 to €4.84 million due to economic uncertainties, followed by a recovery and growth trend in subsequent years. The CAGR for 2022-24 was 4.39%, while the CAGR for 2025-30 is projected at 6.39%. Industry drivers such as increasing industrial automation and demand for efficient valve systems have contributed to the market's expansion. Looking ahead, Latvia is set to implement new regulations promoting sustainable energy solutions, which is expected to drive further growth in the pneumatic valves market.
Latvia Pneumatic Valves Market: Production & Trade Performance (2019-2025)
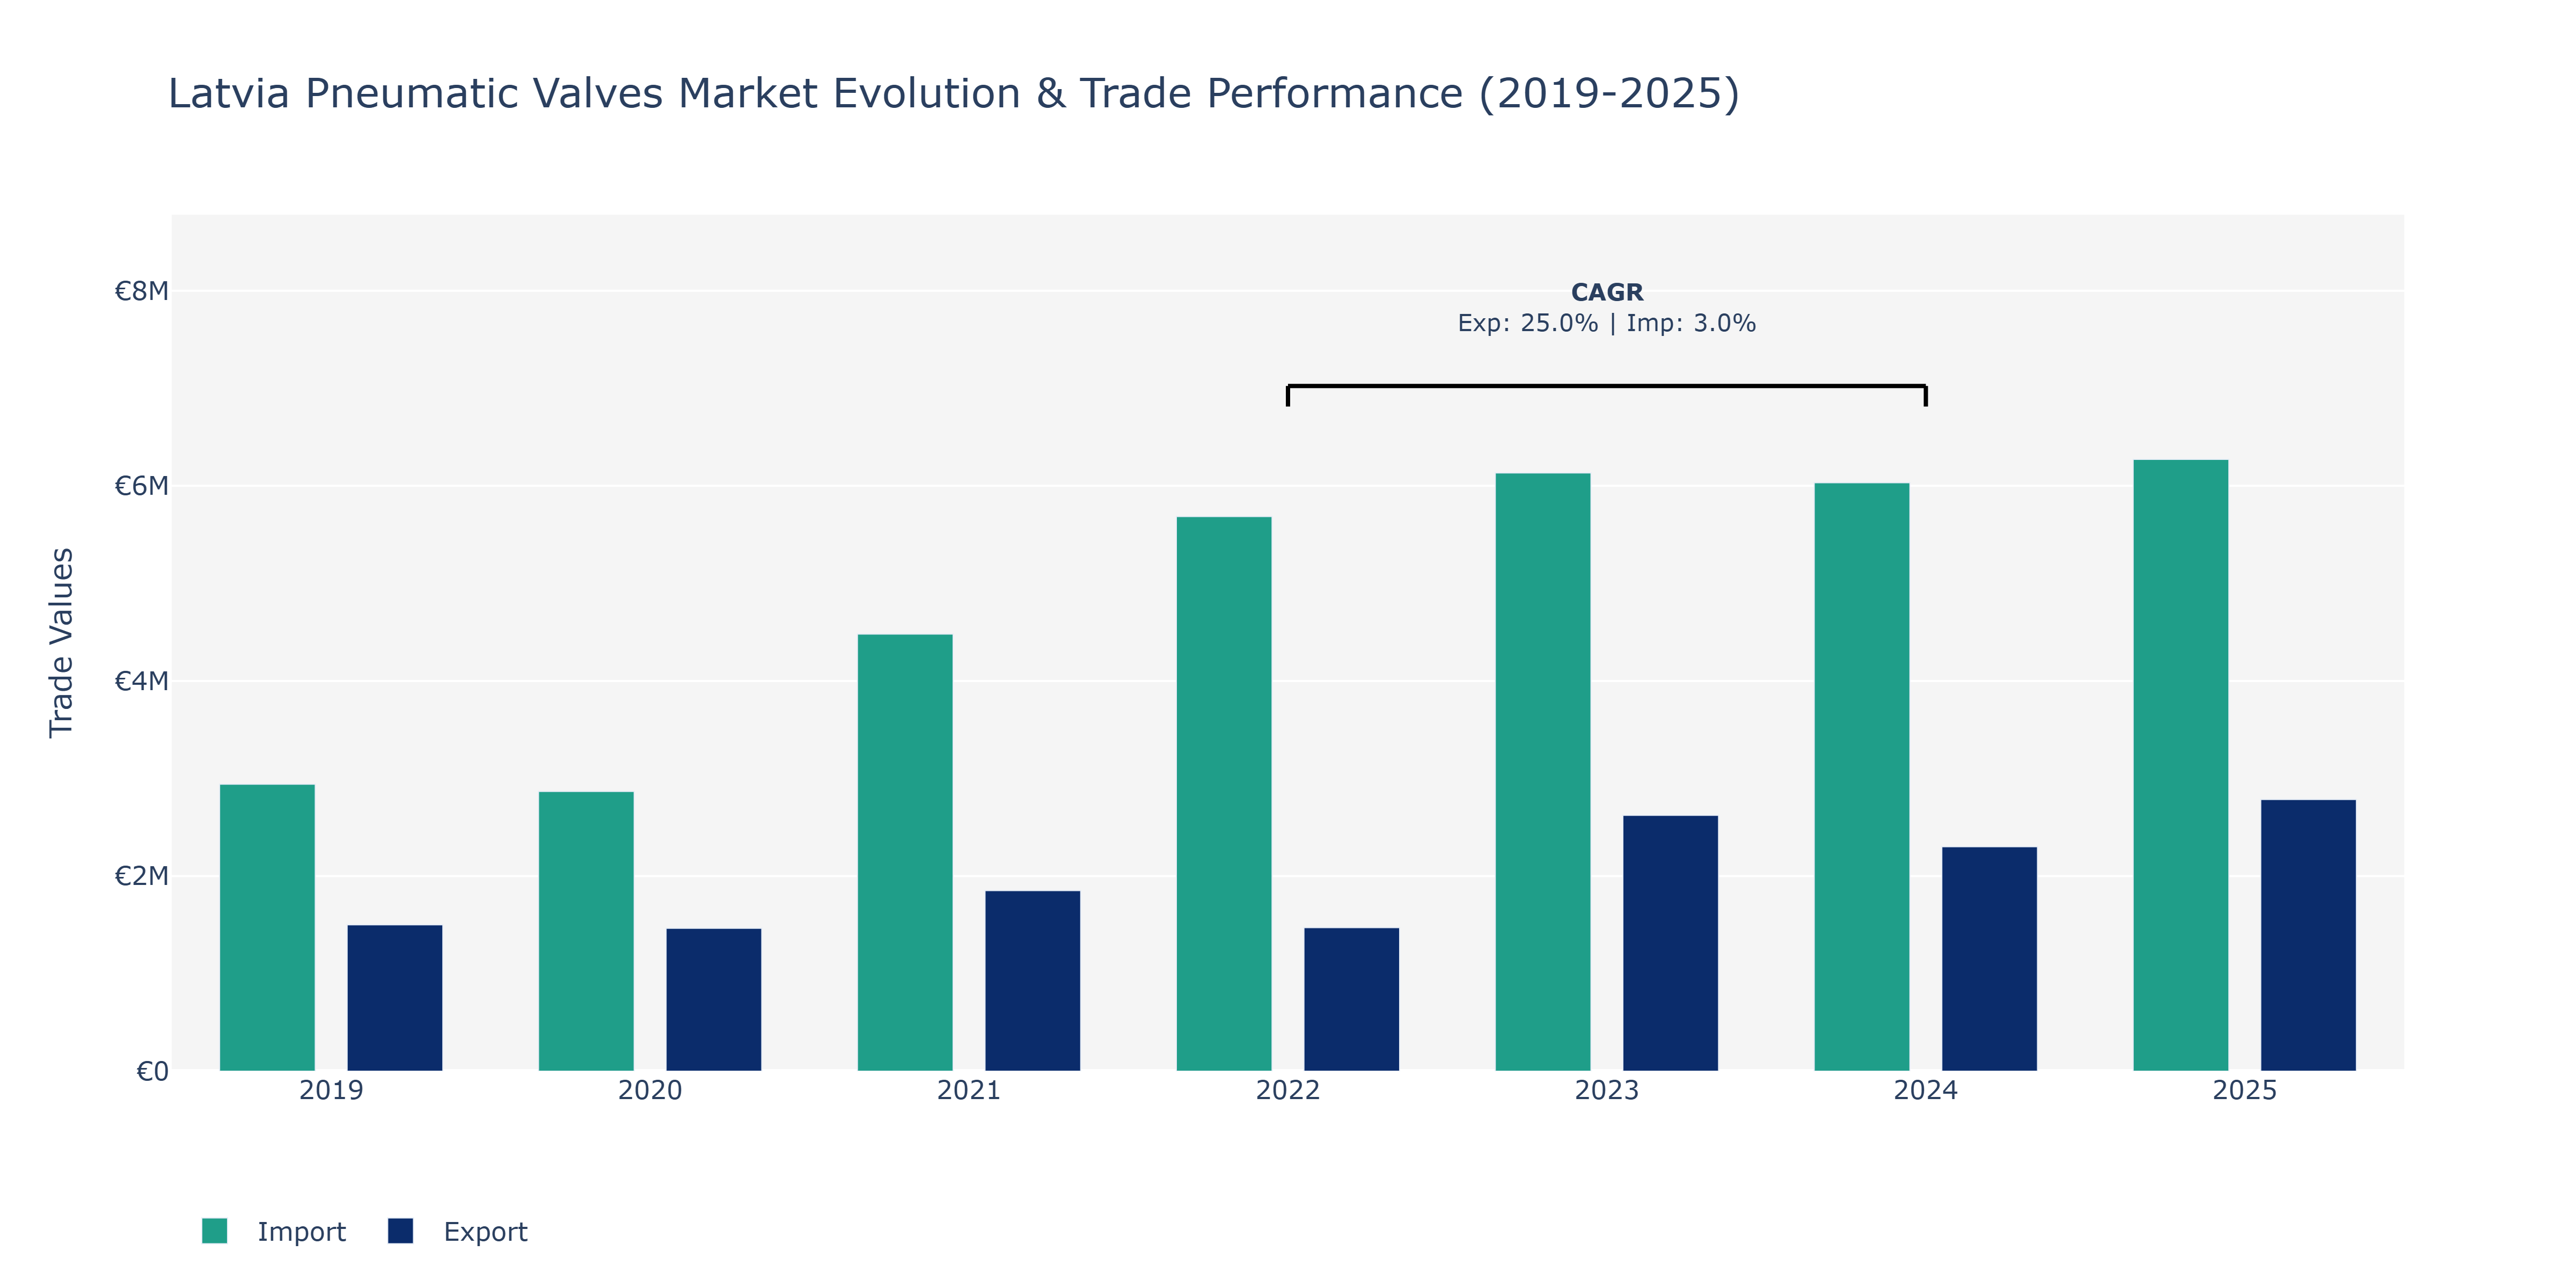
In the Latvia Pneumatic Valves Market, exports experienced fluctuations over the years, starting at €1.5 million in 2019, dropping to €1.46 million in 2020, and rebounding to €1.85 million in 2021. Subsequently, exports decreased to €1.47 million in 2022 before showing substantial growth to peak at €2.79 million in 2025. These fluctuations could be attributed to various factors such as global demand shifts, currency exchange rates, and market competition. On the other hand, imports also showcased variability, beginning at €2.94 million in 2019, decreasing to €2.87 million in 2020, and then increasing to €4.48 million in 2021. Imports continued to rise to €6.27 million in 2025, possibly driven by technological advancements, increased industrial automation, and infrastructure development in Latvia. These trends suggest a dynamic market influenced by both domestic and international factors, emphasizing the need for market players to adapt to evolving conditions and seize growth opportunities.
Key Highlights of the Report:
- Latvia Pneumatic Valves Market Outlook
- Market Size of Latvia Pneumatic Valves Market, 2025
- Forecast of Latvia Pneumatic Valves Market, 2032
- Historical Data and Forecast of Latvia Pneumatic Valves Revenues & Volume for the Period 2022 - 2032F
- Latvia Pneumatic Valves Market Trend Evolution
- Latvia Pneumatic Valves Market Drivers and Challenges
- Latvia Pneumatic Valves Price Trends
- Latvia Pneumatic Valves Porter`s Five Forces
- Latvia Pneumatic Valves Industry Life Cycle
- Historical Data and Forecast of Latvia Pneumatic Valves Market Revenues & Volume By Product Type for the Period 2022 - 2032F
- Historical Data and Forecast of Latvia Pneumatic Valves Market Revenues & Volume By Sliding shaft for the Period 2022 - 2032F
- Historical Data and Forecast of Latvia Pneumatic Valves Market Revenues & Volume By Rotating shaft for the Period 2022 - 2032F
- Historical Data and Forecast of Latvia Pneumatic Valves Market Revenues & Volume By End-Users for the Period 2022 - 2032F
- Historical Data and Forecast of Latvia Pneumatic Valves Market Revenues & Volume By Chemicals and petrochemicals for the Period 2022 - 2032F
- Historical Data and Forecast of Latvia Pneumatic Valves Market Revenues & Volume By Power generation and management for the Period 2022 - 2032F
- Historical Data and Forecast of Latvia Pneumatic Valves Market Revenues & Volume By Mining for the Period 2022 - 2032F
- Historical Data and Forecast of Latvia Pneumatic Valves Market Revenues & Volume By Water and wastewater management for the Period 2022 - 2032F
- Latvia Pneumatic Valves Import Export Trade Statistics
- Market Opportunity Assessment By Product Type
- Market Opportunity Assessment By End-Users
- Latvia Pneumatic Valves Top Companies Market Share
- Latvia Pneumatic Valves Competitive Benchmarking By Technical and Operational Parameters
- Latvia Pneumatic Valves Company Profiles
- Latvia Pneumatic Valves Key Strategic Recommendations
Frequently Asked Questions About the Market Study (FAQs):
6Wresearch actively monitors the Latvia Pneumatic Valves Market and publishes its comprehensive annual report, highlighting emerging trends, growth drivers, revenue analysis, and forecast outlook. Our insights help businesses to make data-backed strategic decisions with ongoing market dynamics. Our analysts track relevent industries related to the Latvia Pneumatic Valves Market, allowing our clients with actionable intelligence and reliable forecasts tailored to emerging regional needs.
Yes, we provide customisation as per your requirements. To learn more, feel free to contact us on sales@6wresearch.com
1 Executive Summary |
2 Introduction |
2.1 Key Highlights of the Report |
2.2 Report Description |
2.3 Market Scope & Segmentation |
2.4 Research Methodology |
2.5 Assumptions |
3 Latvia Pneumatic Valves Market Overview |
3.1 Latvia Country Macro Economic Indicators |
3.2 Latvia Pneumatic Valves Market Revenues & Volume, 2022 & 2032F |
3.3 Latvia Pneumatic Valves Market - Industry Life Cycle |
3.4 Latvia Pneumatic Valves Market - Porter's Five Forces |
3.5 Latvia Pneumatic Valves Market Revenues & Volume Share, By Product Type, 2022 & 2032F |
3.6 Latvia Pneumatic Valves Market Revenues & Volume Share, By End-Users, 2022 & 2032F |
4 Latvia Pneumatic Valves Market Dynamics |
4.1 Impact Analysis |
4.2 Market Drivers |
4.2.1 Increasing industrial automation in Latvia leading to higher demand for pneumatic valves |
4.2.2 Growth in manufacturing and processing industries in the country |
4.2.3 Emphasis on energy efficiency and sustainability driving the adoption of pneumatic valves |
4.3 Market Restraints |
4.3.1 Economic fluctuations impacting investments in industrial equipment |
4.3.2 Availability of substitutes like electric valves affecting market growth |
4.3.3 High initial costs associated with installing pneumatic valves |
5 Latvia Pneumatic Valves Market Trends |
6 Latvia Pneumatic Valves Market Segmentations |
6.1 Latvia Pneumatic Valves Market, By Product Type |
6.1.1 Overview and Analysis |
6.1.2 Latvia Pneumatic Valves Market Revenues & Volume, By Sliding shaft, 2022 - 2032F |
6.1.3 Latvia Pneumatic Valves Market Revenues & Volume, By Rotating shaft, 2022 - 2032F |
6.2 Latvia Pneumatic Valves Market, By End-Users |
6.2.1 Overview and Analysis |
6.2.2 Latvia Pneumatic Valves Market Revenues & Volume, By Chemicals and petrochemicals, 2022 - 2032F |
6.2.3 Latvia Pneumatic Valves Market Revenues & Volume, By Power generation and management, 2022 - 2032F |
6.2.4 Latvia Pneumatic Valves Market Revenues & Volume, By Mining, 2022 - 2032F |
6.2.5 Latvia Pneumatic Valves Market Revenues & Volume, By Water and wastewater management? , 2022 - 2032F |
7 Latvia Pneumatic Valves Market Import-Export Trade Statistics |
7.1 Latvia Pneumatic Valves Market Export to Major Countries |
7.2 Latvia Pneumatic Valves Market Imports from Major Countries |
8 Latvia Pneumatic Valves Market Key Performance Indicators |
8.1 Energy efficiency improvements achieved through the use of pneumatic valves |
8.2 Adoption rate of pneumatic valves in key industries in Latvia |
8.3 Maintenance cost savings realized by companies using pneumatic valves |
9 Latvia Pneumatic Valves Market - Opportunity Assessment |
9.1 Latvia Pneumatic Valves Market Opportunity Assessment, By Product Type, 2022 & 2032F |
9.2 Latvia Pneumatic Valves Market Opportunity Assessment, By End-Users, 2022 & 2032F |
10 Latvia Pneumatic Valves Market - Competitive Landscape |
10.1 Latvia Pneumatic Valves Market Revenue Share, By Companies, 2025 |
10.2 Latvia Pneumatic Valves Market Competitive Benchmarking, By Operating and Technical Parameters |
11 Company Profiles |
12 Recommendations | 13 Disclaimer |
Global Go To Market Strategy - 2030
Export potential enables firms to identify high-growth global markets with greater confidence by combining advanced trade intelligence with a structured quantitative methodology. The framework analyzes emerging demand trends and country-level import patterns while integrating macroeconomic and trade datasets such as GDP and population forecasts, bilateral import–export flows, tariff structures, elasticity differentials between developed and developing economies, geographic distance, and import demand projections. Using weighted trade values from 2020–2024 as the base period to project country-to-country export potential for 2030, these inputs are operationalized through calculated drivers such as gravity model parameters, tariff impact factors, and projected GDP per-capita growth. Through an analysis of hidden potentials, demand hotspots, and market conditions that are most favorable to success, this method enables firms to focus on target countries, maximize returns, and global expansion with data, backed by accuracy.
By factoring in the projected importer demand gap that is currently unmet and could be potential opportunity, it identifies the potential for the Exporter (Country) among 190 countries, against the general trade analysis, which identifies the biggest importer or exporter.
To discover high-growth global markets and optimize your business strategy:
Click Here
Pricing
- Single User License$ 1,995
- Department License$ 2,400
- Site License$ 3,120
- Global License$ 3,795

Leadership Perspectives from Industry Events
Search
Thought Leadership and Analyst Meet


Our Clients
6WResearch In News
- India Export Attractiveness Tracker 2026
- India Air Conditioner Market Set for Strong Rebound in 2026 After Weather-Led Correction and GST-Driven Recovery: 6Wresearch
- ADAS in India: How Automatic Emergency Braking, Blind Spot Detection & Driver Monitoring are Transforming Road Safety
- Doha a strategic location for EV manufacturing hub: IPA Qatar
- Demand for luxury TVs surging in the GCC, says Samsung
- Empowering Growth: The Thriving Journey of Bangladesh’s Cable Industry
Latest Reports
- Nicaragua RPG Gaming Market (2026-2032)
- New Zealand RPG Gaming Market (2026-2032)
- Netherlands RPG Gaming Market (2026-2032)
- Nauru RPG Gaming Market (2026-2032)
- Namibia RPG Gaming Market (2026-2032)
- Mozambique RPG Gaming Market (2026-2032)
- Montenegro RPG Gaming Market (2026-2032)
- Mongolia RPG Gaming Market (2026-2032)
- Monaco RPG Gaming Market (2026-2032)
- Micronesia RPG Gaming Market (2026-2032)
Industry Events and Analyst Meet

EV India Expo 2026

HIMTEX 2026

India Refining Summit 2026

India EV Show 2026

EV tech India Expo 2026
Whitepaper
- Middle East & Africa Commercial Security Market Click here to view more.
- Middle East & Africa Fire Safety Systems & Equipment Market Click here to view more.
- GCC Drone Market Click here to view more.
- Middle East Lighting Fixture Market Click here to view more.
- GCC Physical & Perimeter Security Market Click here to view more.