Latvia Talcum Powder Market (2026-2032) | Revenue, Share, Segmentation, Forecast, Companies, Growth, Outlook, Analysis, Size, Trends, Industry & Value
Market Forecast By Type (Cosmetics Grade, Paper Grade, Waterproofing Grade, Coatings Grade, Plastic Grade, Others), By Application (Paints & Coatings, Plastic & Rubber, Personal Care, Others) And Competitive Landscape
| Product Code: ETC5324443 | Publication Date: Nov 2023 | Updated Date: Apr 2026 | Product Type: Market Research Report | |
| Publisher: 6Wresearch | Author: Ravi Bhandari | No. of Pages: 60 | No. of Figures: 30 | No. of Tables: 5 |
Latvia Talcum Powder Market Size (2020-2030)
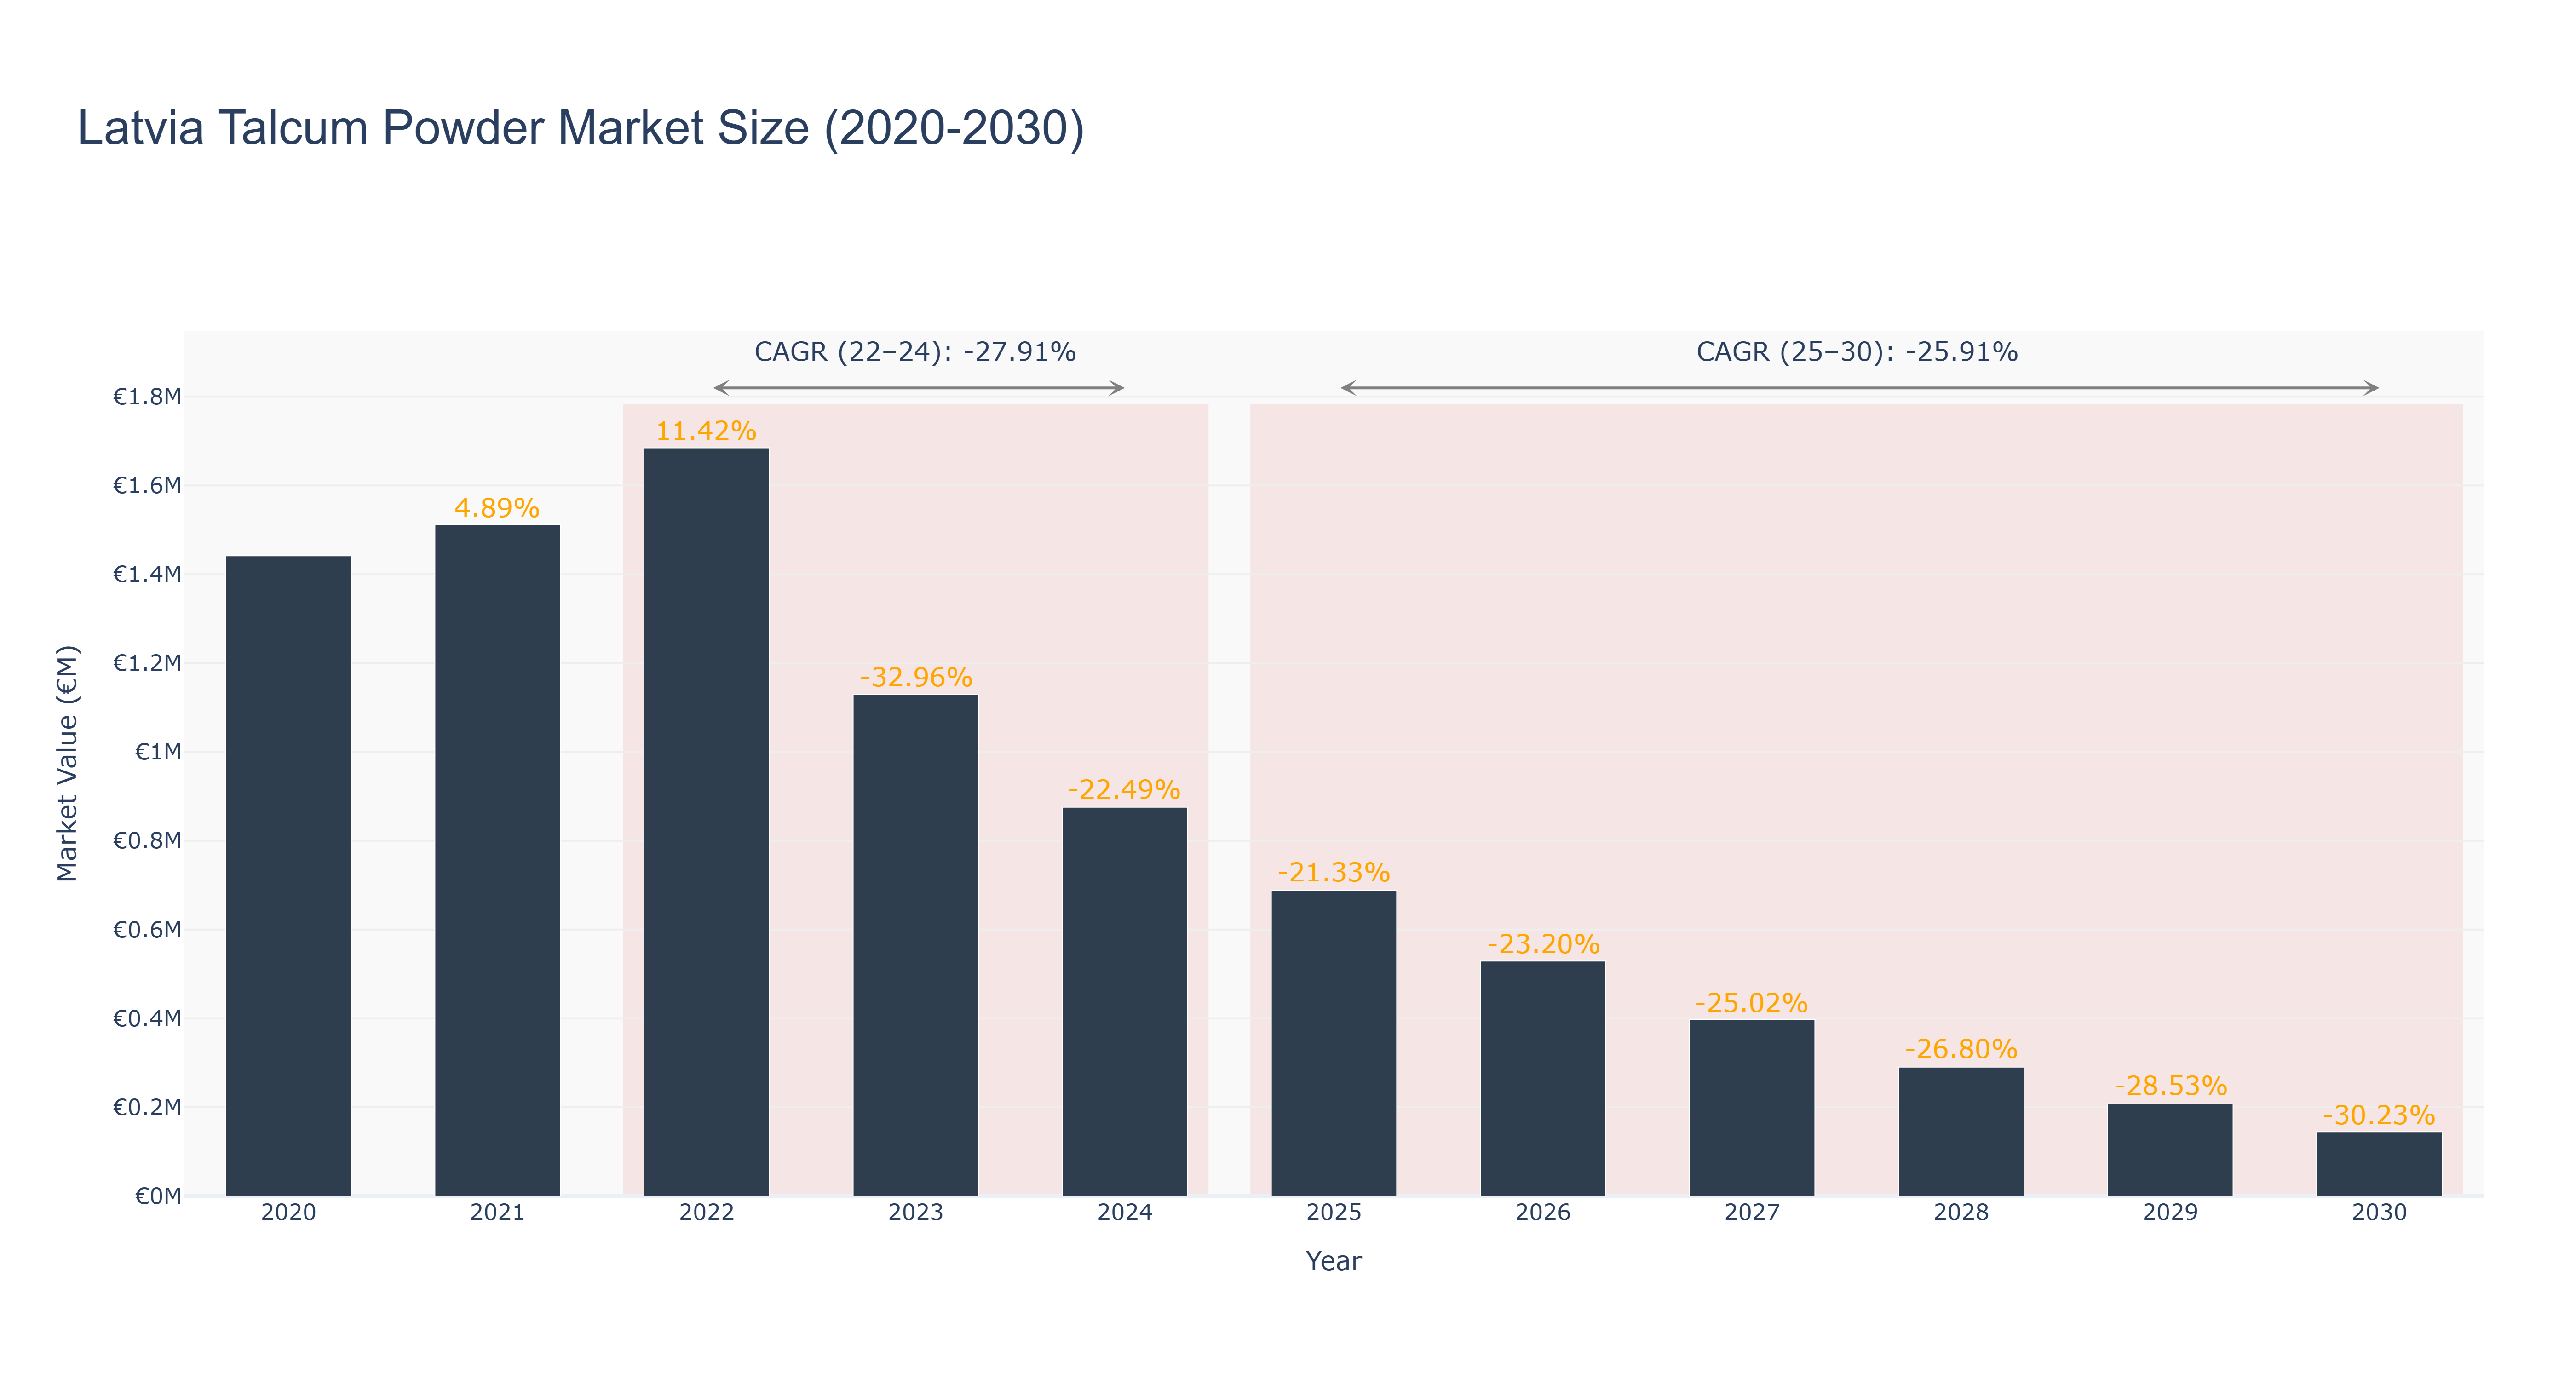
Latvia Talcum Powder Market has seen a decline in market size from €1.68 million in 2022 to €0.53 million in 2026, with a sharp decrease in CAGR from 2022-24 at -27.91%. The market is forecasted to continue its downward trend with a CAGR of -25.91% from 2025-30. This decline can be attributed to changing consumer preferences towards natural and organic alternatives, as well as increasing awareness about potential health risks associated with talcum powder. To counter this trend, market players are focusing on product innovation, such as introducing talcum-free alternatives and expanding distribution channels. In the near future, Latvia's Talcum Powder Market is expected to witness collaborations with dermatologists for product endorsements and increased marketing efforts to regain consumer trust and drive market growth.
Latvia Talcum Powder Market: Production & Trade Performance (2019-2025)
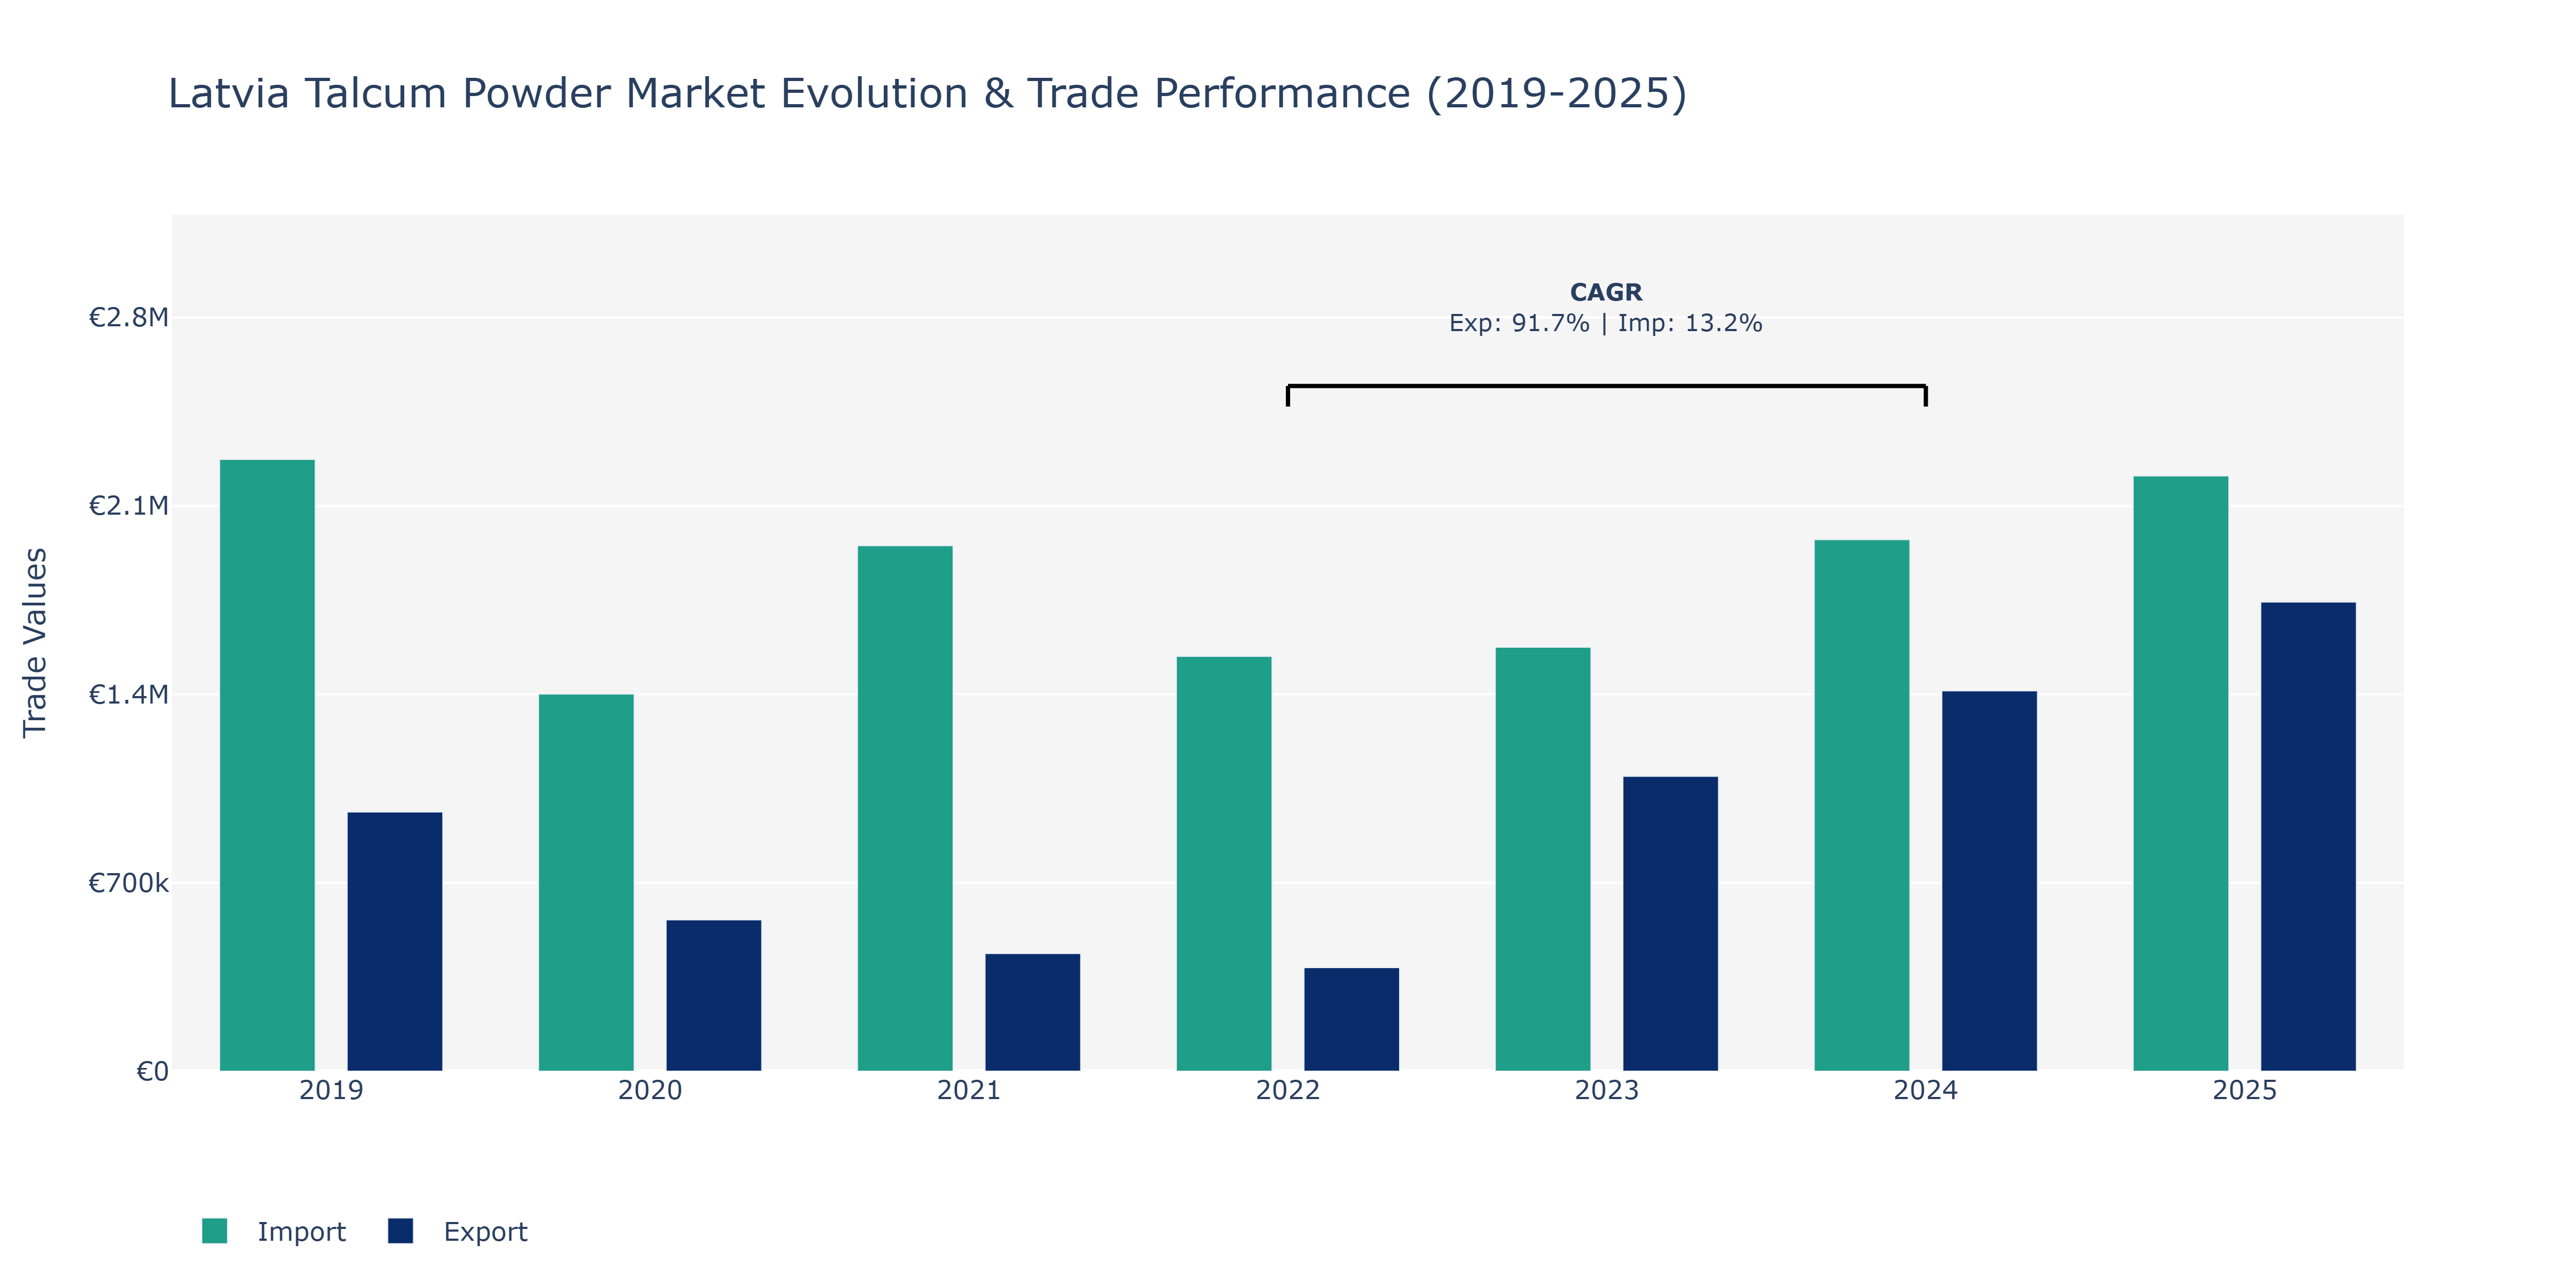
Between 2019 and 2025, Latvia's Talcum Powder Market saw fluctuations in both exports and imports. Exports started at €963.13 thousand in 2019, declining to €437.3 thousand in 2021 before rising to €1.74 million in 2025. Conversely, imports began at €2.27 million in 2019, decreased to €1.4 million in 2022, and then climbed to €2.21 million in 2025. The peak points for exports and imports were observed in 2025, indicating a substantial growth in market activity. These fluctuations can be attributed to various factors such as changes in consumer demand, competitive pricing strategies, and global market trends impacting the talcum powder industry. The rise in exports could be influenced by increased international demand, while the growth in imports might reflect the need for raw materials or specialized products to support domestic production. The 91.7% CAGR for exports (2022-2024) suggests a rapid expansion in overseas sales, potentially driven by successful marketing campaigns or product innovations. In contrast, the 13.2% CAGR for imports during the same period hints at a more stable procurement strategy, possibly aimed at ensuring a consistent supply chain or exploring new sourcing options to optimize costs in the long term. The market's resilience amidst these fluctuations signifies a dynamic and adaptable industry landscape, showcasing Latvia's competitiveness in the global talcum powder market. Further research into evolving consumer preferences, trade agreements, and technological advancements can provide valuable insights into sustaining this growth trajectory.
Key Highlights of the Report:
- Latvia Talcum Powder Market Outlook
- Market Size of Latvia Talcum Powder Market, 2025
- Forecast of Latvia Talcum Powder Market, 2032
- Historical Data and Forecast of Latvia Talcum Powder Revenues & Volume for the Period 2022 - 2032F
- Latvia Talcum Powder Market Trend Evolution
- Latvia Talcum Powder Market Drivers and Challenges
- Latvia Talcum Powder Price Trends
- Latvia Talcum Powder Porter`s Five Forces
- Latvia Talcum Powder Industry Life Cycle
- Historical Data and Forecast of Latvia Talcum Powder Market Revenues & Volume By Type for the Period 2022 - 2032F
- Historical Data and Forecast of Latvia Talcum Powder Market Revenues & Volume By Cosmetics Grade for the Period 2022 - 2032F
- Historical Data and Forecast of Latvia Talcum Powder Market Revenues & Volume By Paper Grade for the Period 2022 - 2032F
- Historical Data and Forecast of Latvia Talcum Powder Market Revenues & Volume By Waterproofing Grade for the Period 2022 - 2032F
- Historical Data and Forecast of Latvia Talcum Powder Market Revenues & Volume By Coatings Grade for the Period 2022 - 2032F
- Historical Data and Forecast of Latvia Talcum Powder Market Revenues & Volume By Plastic Grade for the Period 2022 - 2032F
- Historical Data and Forecast of Latvia Talcum Powder Market Revenues & Volume By Others for the Period 2022 - 2032F
- Historical Data and Forecast of Latvia Talcum Powder Market Revenues & Volume By Application for the Period 2022 - 2032F
- Historical Data and Forecast of Latvia Talcum Powder Market Revenues & Volume By Paints & Coatings for the Period 2022 - 2032F
- Historical Data and Forecast of Latvia Talcum Powder Market Revenues & Volume By Plastic & Rubber for the Period 2022 - 2032F
- Historical Data and Forecast of Latvia Talcum Powder Market Revenues & Volume By Personal Care for the Period 2022 - 2032F
- Historical Data and Forecast of Latvia Talcum Powder Market Revenues & Volume By Others for the Period 2022 - 2032F
- Latvia Talcum Powder Import Export Trade Statistics
- Market Opportunity Assessment By Type
- Market Opportunity Assessment By Application
- Latvia Talcum Powder Top Companies Market Share
- Latvia Talcum Powder Competitive Benchmarking By Technical and Operational Parameters
- Latvia Talcum Powder Company Profiles
- Latvia Talcum Powder Key Strategic Recommendations
Frequently Asked Questions About the Market Study (FAQs):
6Wresearch actively monitors the Latvia Talcum Powder Market and publishes its comprehensive annual report, highlighting emerging trends, growth drivers, revenue analysis, and forecast outlook. Our insights help businesses to make data-backed strategic decisions with ongoing market dynamics. Our analysts track relevent industries related to the Latvia Talcum Powder Market, allowing our clients with actionable intelligence and reliable forecasts tailored to emerging regional needs.
Yes, we provide customisation as per your requirements. To learn more, feel free to contact us on sales@6wresearch.com
1 Executive Summary |
2 Introduction |
2.1 Key Highlights of the Report |
2.2 Report Description |
2.3 Market Scope & Segmentation |
2.4 Research Methodology |
2.5 Assumptions |
3 Latvia Talcum Powder Market Overview |
3.1 Latvia Country Macro Economic Indicators |
3.2 Latvia Talcum Powder Market Revenues & Volume, 2022 & 2032F |
3.3 Latvia Talcum Powder Market - Industry Life Cycle |
3.4 Latvia Talcum Powder Market - Porter's Five Forces |
3.5 Latvia Talcum Powder Market Revenues & Volume Share, By Type, 2022 & 2032F |
3.6 Latvia Talcum Powder Market Revenues & Volume Share, By Application, 2022 & 2032F |
4 Latvia Talcum Powder Market Dynamics |
4.1 Impact Analysis |
4.2 Market Drivers |
4.2.1 Increasing awareness about personal hygiene and grooming practices in Latvia |
4.2.2 Growing demand for talcum powder in cosmetics and personal care products |
4.2.3 Rising disposable income levels leading to higher spending on personal care products |
4.3 Market Restraints |
4.3.1 Health concerns related to the use of talcum powder, including potential links to respiratory issues and cancer |
4.3.2 Availability of alternative products such as cornstarch-based powders or natural body powders |
5 Latvia Talcum Powder Market Trends |
6 Latvia Talcum Powder Market Segmentations |
6.1 Latvia Talcum Powder Market, By Type |
6.1.1 Overview and Analysis |
6.1.2 Latvia Talcum Powder Market Revenues & Volume, By Cosmetics Grade, 2022 - 2032F |
6.1.3 Latvia Talcum Powder Market Revenues & Volume, By Paper Grade, 2022 - 2032F |
6.1.4 Latvia Talcum Powder Market Revenues & Volume, By Waterproofing Grade, 2022 - 2032F |
6.1.5 Latvia Talcum Powder Market Revenues & Volume, By Coatings Grade, 2022 - 2032F |
6.1.6 Latvia Talcum Powder Market Revenues & Volume, By Plastic Grade, 2022 - 2032F |
6.1.7 Latvia Talcum Powder Market Revenues & Volume, By Others, 2022 - 2032F |
6.2 Latvia Talcum Powder Market, By Application |
6.2.1 Overview and Analysis |
6.2.2 Latvia Talcum Powder Market Revenues & Volume, By Paints & Coatings, 2022 - 2032F |
6.2.3 Latvia Talcum Powder Market Revenues & Volume, By Plastic & Rubber, 2022 - 2032F |
6.2.4 Latvia Talcum Powder Market Revenues & Volume, By Personal Care, 2022 - 2032F |
6.2.5 Latvia Talcum Powder Market Revenues & Volume, By Others, 2022 - 2032F |
7 Latvia Talcum Powder Market Import-Export Trade Statistics |
7.1 Latvia Talcum Powder Market Export to Major Countries |
7.2 Latvia Talcum Powder Market Imports from Major Countries |
8 Latvia Talcum Powder Market Key Performance Indicators |
8.1 Average selling price of talcum powder products in Latvia |
8.2 Number of new product launches and innovations in the talcum powder market |
8.3 Consumer satisfaction and loyalty towards talcum powder brands |
8.4 Market penetration rate of talcum powder products in different demographics within Latvia |
8.5 Environmental sustainability initiatives undertaken by talcum powder manufacturers |
9 Latvia Talcum Powder Market - Opportunity Assessment |
9.1 Latvia Talcum Powder Market Opportunity Assessment, By Type, 2022 & 2032F |
9.2 Latvia Talcum Powder Market Opportunity Assessment, By Application, 2022 & 2032F |
10 Latvia Talcum Powder Market - Competitive Landscape |
10.1 Latvia Talcum Powder Market Revenue Share, By Companies, 2025 |
10.2 Latvia Talcum Powder Market Competitive Benchmarking, By Operating and Technical Parameters |
11 Company Profiles |
12 Recommendations | 13 Disclaimer |
Global Go To Market Strategy - 2030
Export potential enables firms to identify high-growth global markets with greater confidence by combining advanced trade intelligence with a structured quantitative methodology. The framework analyzes emerging demand trends and country-level import patterns while integrating macroeconomic and trade datasets such as GDP and population forecasts, bilateral import–export flows, tariff structures, elasticity differentials between developed and developing economies, geographic distance, and import demand projections. Using weighted trade values from 2020–2024 as the base period to project country-to-country export potential for 2030, these inputs are operationalized through calculated drivers such as gravity model parameters, tariff impact factors, and projected GDP per-capita growth. Through an analysis of hidden potentials, demand hotspots, and market conditions that are most favorable to success, this method enables firms to focus on target countries, maximize returns, and global expansion with data, backed by accuracy.
By factoring in the projected importer demand gap that is currently unmet and could be potential opportunity, it identifies the potential for the Exporter (Country) among 190 countries, against the general trade analysis, which identifies the biggest importer or exporter.
To discover high-growth global markets and optimize your business strategy:
Click Here
Pricing
- Single User License$ 1,995
- Department License$ 2,400
- Site License$ 3,120
- Global License$ 3,795

Leadership Perspectives from Industry Events
Search
Thought Leadership and Analyst Meet


Our Clients
6WResearch In News
- India Export Attractiveness Tracker 2026
- India Air Conditioner Market Set for Strong Rebound in 2026 After Weather-Led Correction and GST-Driven Recovery: 6Wresearch
- ADAS in India: How Automatic Emergency Braking, Blind Spot Detection & Driver Monitoring are Transforming Road Safety
- Doha a strategic location for EV manufacturing hub: IPA Qatar
- Demand for luxury TVs surging in the GCC, says Samsung
- Empowering Growth: The Thriving Journey of Bangladesh’s Cable Industry
Latest Reports
- Nicaragua RPG Gaming Market (2026-2032)
- New Zealand RPG Gaming Market (2026-2032)
- Netherlands RPG Gaming Market (2026-2032)
- Nauru RPG Gaming Market (2026-2032)
- Namibia RPG Gaming Market (2026-2032)
- Mozambique RPG Gaming Market (2026-2032)
- Montenegro RPG Gaming Market (2026-2032)
- Mongolia RPG Gaming Market (2026-2032)
- Monaco RPG Gaming Market (2026-2032)
- Micronesia RPG Gaming Market (2026-2032)
Industry Events and Analyst Meet

EV India Expo 2026

HIMTEX 2026

India Refining Summit 2026

India EV Show 2026

EV tech India Expo 2026
Whitepaper
- Middle East & Africa Commercial Security Market Click here to view more.
- Middle East & Africa Fire Safety Systems & Equipment Market Click here to view more.
- GCC Drone Market Click here to view more.
- Middle East Lighting Fixture Market Click here to view more.
- GCC Physical & Perimeter Security Market Click here to view more.