Lebanon Chemical Packaging Market (2026-2032) | Share, Revenue, Industry, Size, Companies, Trends, Forecast, Value, Outlook, Growth, COVID-19 IMPACT & Analysis
Market Forecast By Product Types (Sacks, Drums, FIBC, Other), By Applications (Pharmaceutical Factory , Laboratory, Chemical Plant , Others) And Competitive Landscape
| Product Code: ETC006907 | Publication Date: Jun 2023 | Product Type: Report | ||
| Publisher: 6Wresearch | Author: Ravi Bhandari | No. of Pages: 70 | No. of Figures: 35 | No. of Tables: 5 |
Lebanon Chemical Packaging Market Summary
The lebanon chemical packaging market was estimated at USD 409 Million in 2025 and is projected to reach USD 569 Million by 2032, growing at a CAGR of 5.9% from 2026 to 2032.
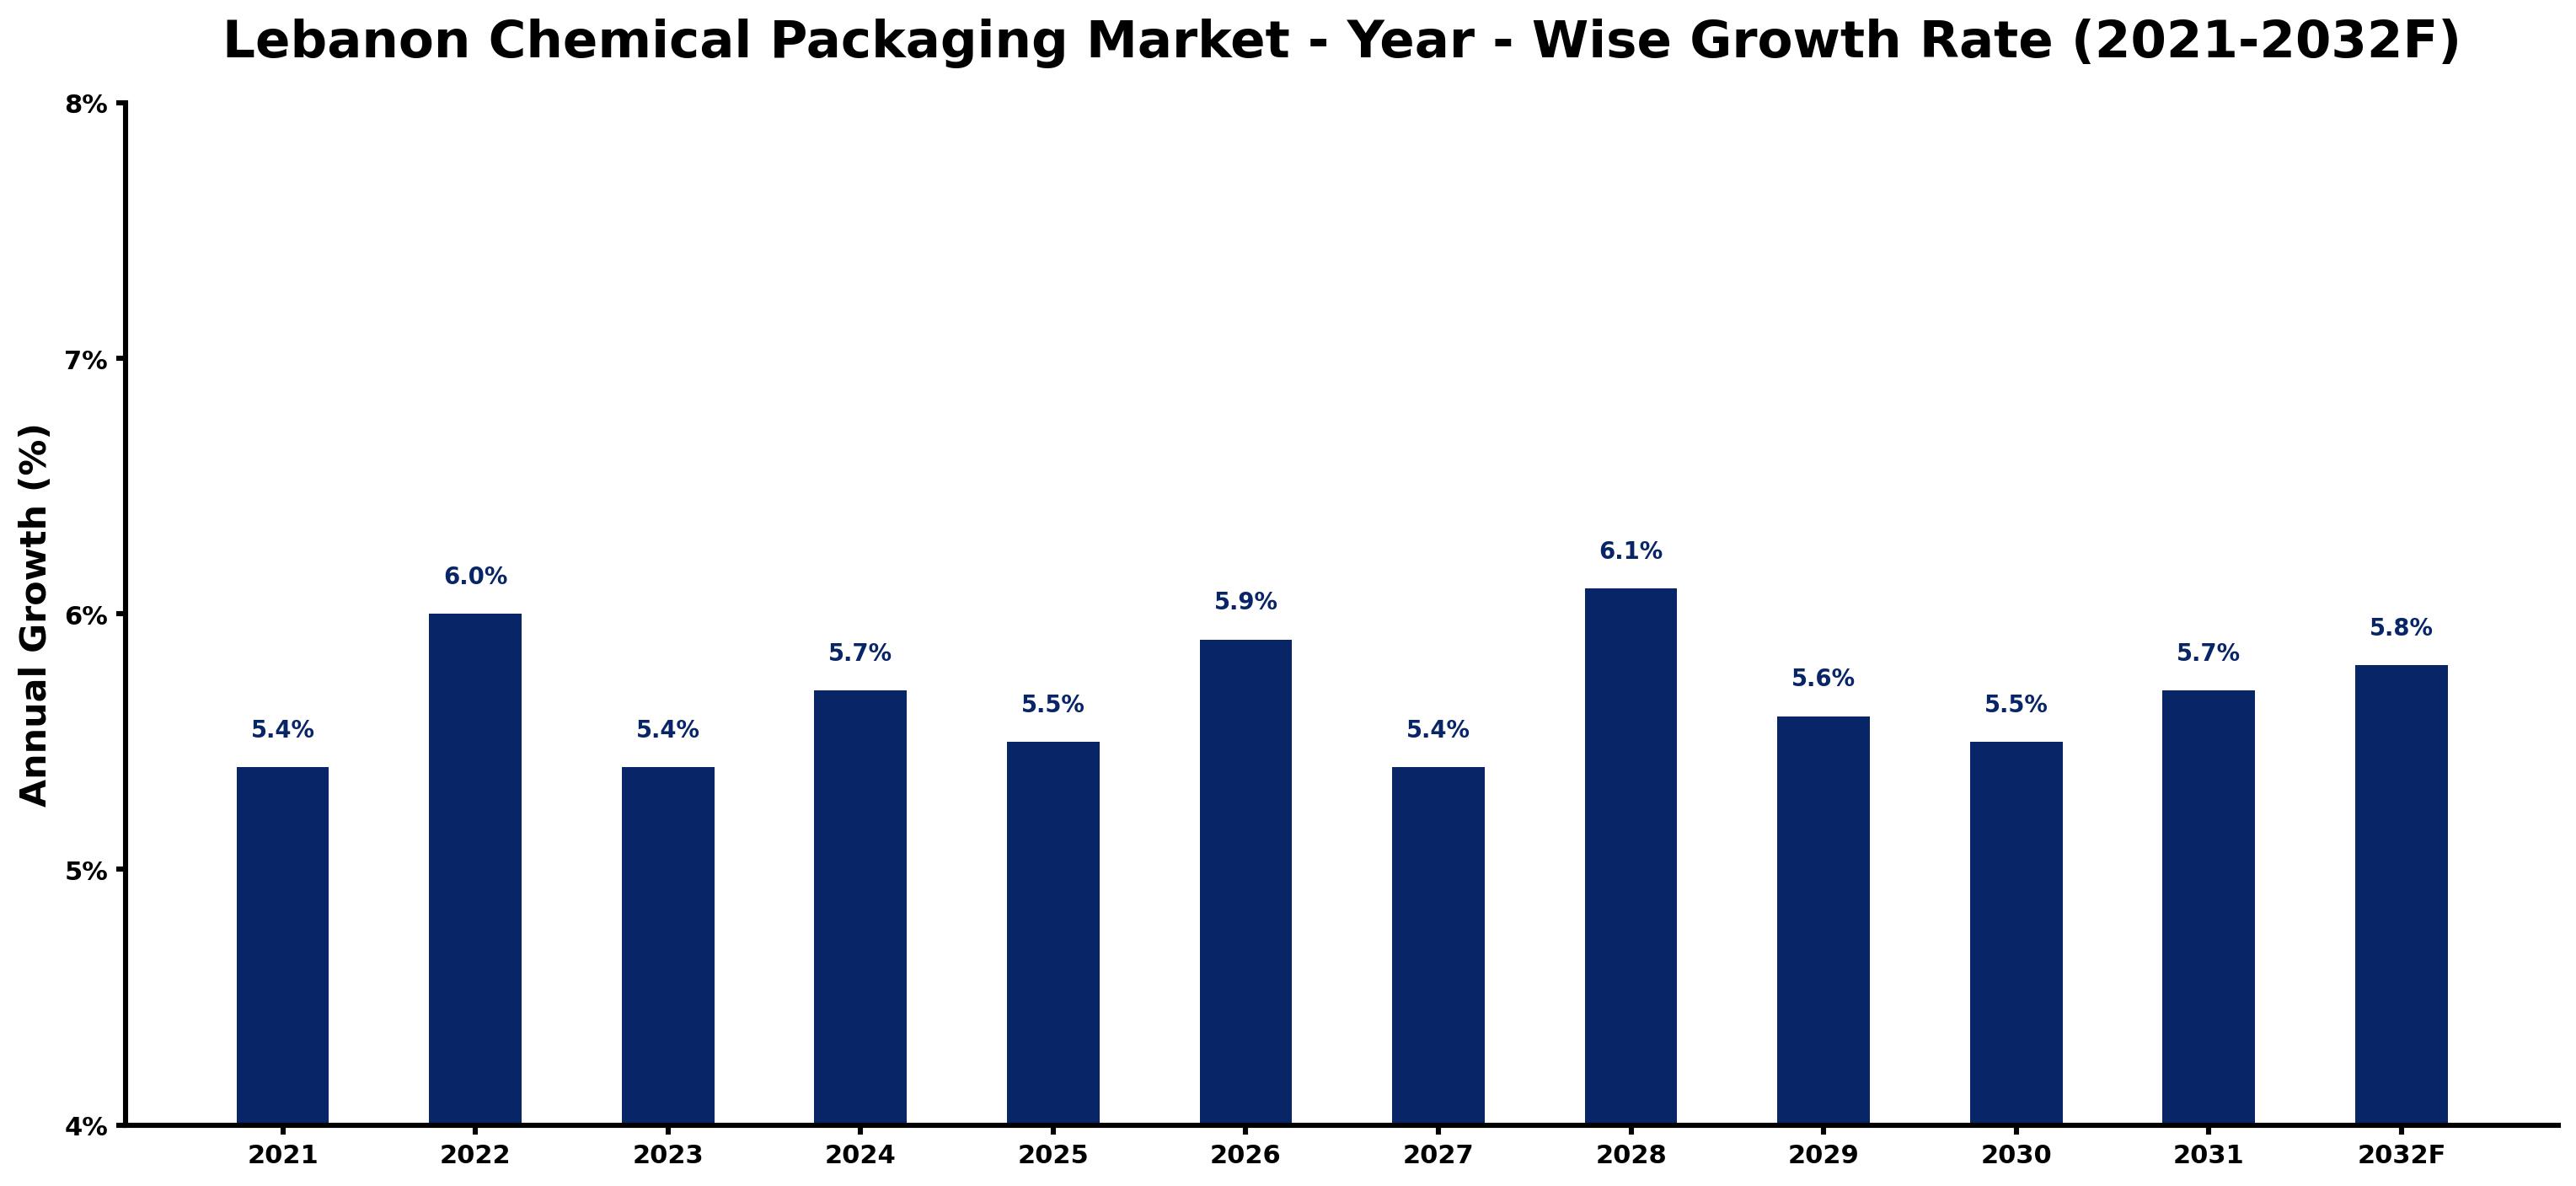
Lebanon Chemical Packaging Market Growth Rate Analysis (2021-2032)
The Lebanon Chemical Packaging market is poised for steady advancement, with growth rates projected at 5.4% in 2021 and 6.0% in 2022, reflecting increasing investments in sustainable packaging solutions. As the market stabilizes, growth rates are expected to fluctuate slightly—5.4% in 2023 to a peak of 6.1% in 2028—driven by heightened consumer demand for eco-friendly options and improvements in local manufacturing capabilities. Factors such as policy shifts favoring environmental sustainability and ongoing digitalization efforts in packaging processes are enhancing operational efficiency. Additionally, a robust energy transition infrastructure supports this market's resilience, despite minor dips like the 5.4% in 2023. By 2032, a growth rate of 5.8% is anticipated, solidifying its positive trajectory.
Lebanon Chemical Packaging Market Year-wise Growth Rate and Key Drivers
This graph highlights how the Lebanon Chemical Packaging Market has steadily grown over the past five years, supported by major growth factors.
The table below presents the year wise growth rates along with the key drivers influencing the market
| Year | Growth Rate | Major Drivers |
| 2021 | 5.4% | Manufacturers are focusing on sustainable materials due to rising environmental awareness. |
| 2022 | 6.0% | Emerging technologies in packaging solutions are enhancing operational efficiencies significantly. |
| 2023 | 5.4% | Supply chain disruptions are pushing companies to localize their sourcing strategies. |
| 2024 | 5.7% | Investments in eco-friendly packaging innovations are attracting new market players rapidly. |
| 2025 | 5.5% | Increased export activities from Lebanon are creating additional packaging requirements. |
| 2026 | 5.9% | Rising consumer preferences for customized packaging solutions drive market diversification efforts. |
| 2027 | 5.4% | Partnerships with international brands are boosting local manufacturers' production capabilities. |
| 2028 | 6.1% | Technological upgrades in production lines are reducing costs and increasing output flexibility. |
| 2029 | 5.6% | Sustainability certifications are becoming crucial for manufacturers seeking competitive advantages. |
| 2030 | 5.5% | Expansion of the food and beverage sector is significantly increasing packaging demand. |
| 2031 | 5.7% | Regulatory changes are encouraging adoption of safer and more sustainable packaging formats. |
| 2032 | 5.8% | Digital transformation initiatives are revolutionizing how packaging companies engage consumers. |
Note - Market size estimations and growth projections presented in this report are based on 6Wresearch's advanced forecasting approach, validated with industry datasets as of June 2026.
Lebanon Chemical Packaging Market Synopsis
The Lebanon Chemical Packaging Market is projected to reach 5.9% and witness significant growth during the forecast period (2026-2032). The market's expansion is primarily driven by the escalating demand for packaging materials across various industries, including food beverage, pharmaceuticals, cosmetics & personal care, and household products. As consumer health consciousness continues to rise, there has been a notable increase in the consumption of packaged foods and beverages, further propelling the growth of the chemical packaging sector in Lebanon. Additionally, an increase in disposable income enables consumers to spend more on fast-moving consumer goods (FMCG) that feature eye-catching designs and vibrant colors. This trend significantly contributes to the development of the Lebanon Chemical Packaging Market from 2026 to 2032.
Lebanon Chemical Packaging Market Growth Drivers
- The heightened demand for sustainable and innovative packaging solutions is reshaping the Lebanon Chemical Packaging Market. As consumers become more environmentally aware, packaging that minimizes waste becomes increasingly appealing.
- The ongoing growth in the food and beverage sector is a pivotal factor driving the Lebanon Chemical Packaging Market. The need for effective preservation and convenience continues to enhance the demand for reliable packaging materials.
- Pharmaceutical advancements are also contributing to market growth, as the need for secure and compliant packaging solutions is paramount. This sector mandates high-quality, durable materials that ensure product integrity.
- The cosmetics and personal care industry's continuous expansion fuels demand for attractive packaging options. Unique designs and functionalities enhance brand appeal, driving the Lebanon Chemical Packaging Market.
- Rising disposable incomes among Lebanese consumers enable increased expenditure on FMCG products, thereby supporting growth in the Lebanon Chemical Packaging Market as they seek appealing and functional packaging.
Lebanon Chemical Packaging Market Trends and Opportunities
The Lebanon Chemical Packaging Market is witnessing several trends that present significant opportunities for growth. The growing focus on sustainable packaging solutions is leading manufacturers to invest in eco-friendly materials that reduce environmental impact. Moreover, technological innovations such as smart packaging are enhancing consumer experience by providing additional information about products. As e-commerce continues to rise, the demand for packaging that can protect products during transit represents a notable opportunity. Additionally, customization in packaging design is becoming a key trend, allowing businesses to cater to specific consumer needs and preferences.
Lebanon Chemical Packaging Market Challenges and Restraints
- Increasing environmental concerns surrounding plastic pollution pose significant challenges to the Lebanon Chemical Packaging Market. Stricter regulations governing plastic use and waste management may lead to higher production costs for manufacturers.
- The reliance on imported materials for packaging production can hinder growth, particularly in times of economic instability. Fluctuations in supply chains may affect the availability and cost of essential raw materials.
- Elevated competition among domestic and international players in the Lebanon Chemical Packaging Market can pressure profit margins, particularly for smaller firms trying to establish a foothold in the market.
- The economic challenges faced by Lebanon, including inflation and currency depreciation, can impact consumer purchasing power, thus affecting the sales of packaged goods.
- Technological advancements require continuous investment, which may not be feasible for all manufacturers, particularly smaller companies. This can limit their ability to innovate and compete efficiently.
Lebanon Chemical Packaging Market Government Investment and Initiatives
The Lebanese government is actively pursuing initiatives to enhance the chemical packaging sector, recognizing its significance in the overall economy. Investments are being directed towards fostering sustainable practices, with an emphasis on reducing environmental footprints associated with packaging waste. Moreover, public spending on infrastructure improvements aims to support manufacturing capabilities within the country. Incentives for adopting eco-friendly materials and innovative technologies are also being introduced to stimulate growth in the Lebanon Chemical Packaging Market. These government policies are crucial in providing a conducive environment for manufacturers and promoting advancements in the packaging sector.
Lebanon Chemical Packaging Market Latest Developments (May 2025 - June 2026)
Recent developments in the Lebanon Chemical Packaging Market indicate a shift towards more sustainable practices as manufacturers explore biodegradable and recyclable materials. Industry players have been adapting to changing consumer preferences by enhancing the functionality of packaging to improve user experience. Notably, the trend of personalized packaging is gaining traction, allowing businesses to differentiate their products in a crowded marketplace. Furthermore, collaborations among manufacturers and suppliers are on the rise to streamline processes and improve supply chain efficiencies. Overall, the market is evolving to align with global trends while addressing local consumer demands.
Lebanon Chemical Packaging Market - Key Attractiveness of the Report
- 10 Years of Market Numbers
- Historical Data Starting from 2022 to 2025
- Base Year: 2025
- Forecast Data until 2032
- Key Performance Indicators Impacting the Market
- Major Upcoming Developments and Projects
Key Highlights of the Report:
- Lebanon Chemical Packaging Market Outlook
- Market Size of Lebanon Chemical Packaging Market, 2025
- Forecast of Lebanon Chemical Packaging Market, 2032F
- Historical Data and Forecast of Lebanon Chemical Packaging Revenues & Volume for the Period 2022-2032F
- Lebanon Chemical Packaging Market Trend Evolution
- Lebanon Chemical Packaging Market Drivers and Challenges
- Lebanon Chemical Packaging Price Trends
- Lebanon Chemical Packaging Porter's Five Forces
- Lebanon Chemical Packaging Industry Life Cycle
- Historical Data and Forecast of Lebanon Chemical Packaging Market Revenues & Volume By Product Types for the Period 2022-2032F
- Historical Data and Forecast of Lebanon Chemical Packaging Market Revenues & Volume By Sacks for the Period 2022-2032F
- Historical Data and Forecast of Lebanon Chemical Packaging Market Revenues & Volume By Drums for the Period 2022-2032F
- Historical Data and Forecast of Lebanon Chemical Packaging Market Revenues & Volume By FIBC for the Period 2022-2032F
- Historical Data and Forecast of Lebanon Chemical Packaging Market Revenues & Volume By Other for the Period 2022-2032F
- Historical Data and Forecast of Lebanon Chemical Packaging Market Revenues & Volume By Applications for the Period 2022-2032F
- Historical Data and Forecast of Lebanon Chemical Packaging Market Revenues & Volume By Pharmaceutical Factory? for the Period 2022-2032F
- Historical Data and Forecast of Lebanon Chemical Packaging Market Revenues & Volume By Laboratory for the Period 2022-2032F
- Historical Data and Forecast of Lebanon Chemical Packaging Market Revenues & Volume By Chemical Plant? for the Period 2022-2032F
- Historical Data and Forecast of Lebanon Chemical Packaging Market Revenues & Volume By Others for the Period 2022-2032F
- Lebanon Chemical Packaging Import Export Trade Statistics
- Market Opportunity Assessment By Product Types
- Market Opportunity Assessment By Applications
- Lebanon Chemical Packaging Top Companies Market Share
- Lebanon Chemical Packaging Competitive Benchmarking By Technical and Operational Parameters
- Lebanon Chemical Packaging Company Profiles
- Lebanon Chemical Packaging Key Strategic Recommendations
Frequently Asked Questions About the Market Study (FAQs):
The Lebanon Chemical Packaging Market is expected to grow at a CAGR of 4.5% during the forecast period from 2026 to 2032.
The demand for chemical packaging in Lebanon is largely driven by the food & beverage, pharmaceuticals, cosmetics & personal care, and household products sectors.
Challenges include environmental concerns regarding plastic pollution and economic instability affecting supply chains.
The government is investing in sustainable practices and infrastructure improvements while providing incentives for the adoption of eco-friendly packaging solutions.
6Wresearch actively monitors the Lebanon Chemical Packaging Market and publishes its comprehensive annual report, highlighting emerging trends, growth drivers, revenue analysis, and forecast outlook. Our insights help businesses to make data-backed strategic decisions with ongoing market dynamics. Our analysts track relevent industries related to the Lebanon Chemical Packaging Market, allowing our clients with actionable intelligence and reliable forecasts tailored to emerging regional needs.
Yes, we provide customisation as per your requirements. To learn more, feel free to contact us on sales@6wresearch.com
1 Executive Summary |
2 Introduction |
2.1 Key Highlights of the Report |
2.2 Report Description |
2.3 Market Scope & Segmentation |
2.4 Research Methodology |
2.5 Assumptions |
3 Lebanon Chemical Packaging Market Overview |
3.1 Lebanon Country Macro Economic Indicators |
3.2 Lebanon Chemical Packaging Market Revenues & Volume, 2022 & 2032F |
3.3 Lebanon Chemical Packaging Market - Industry Life Cycle |
3.4 Lebanon Chemical Packaging Market - Porter's Five Forces |
3.5 Lebanon Chemical Packaging Market Revenues & Volume Share, By Product Types, 2022 & 2032F |
3.6 Lebanon Chemical Packaging Market Revenues & Volume Share, By Applications, 2022 & 2032F |
4 Lebanon Chemical Packaging Market Dynamics |
4.1 Impact Analysis |
4.2 Market Drivers |
4.3 Market Restraints |
5 Lebanon Chemical Packaging Market Trends |
6 Lebanon Chemical Packaging Market, By Types |
6.1 Lebanon Chemical Packaging Market, By Product Types |
6.1.1 Overview and Analysis |
6.1.2 Lebanon Chemical Packaging Market Revenues & Volume, By Product Types, 2022-2032F |
6.1.3 Lebanon Chemical Packaging Market Revenues & Volume, By Sacks, 2022-2032F |
6.1.4 Lebanon Chemical Packaging Market Revenues & Volume, By Drums, 2022-2032F |
6.1.5 Lebanon Chemical Packaging Market Revenues & Volume, By FIBC, 2022-2032F |
6.1.6 Lebanon Chemical Packaging Market Revenues & Volume, By Other, 2022-2032F |
6.2 Lebanon Chemical Packaging Market, By Applications |
6.2.1 Overview and Analysis |
6.2.2 Lebanon Chemical Packaging Market Revenues & Volume, By Pharmaceutical Factory , 2022-2032F |
6.2.3 Lebanon Chemical Packaging Market Revenues & Volume, By Laboratory, 2022-2032F |
6.2.4 Lebanon Chemical Packaging Market Revenues & Volume, By Chemical Plant , 2022-2032F |
6.2.5 Lebanon Chemical Packaging Market Revenues & Volume, By Others, 2022-2032F |
7 Lebanon Chemical Packaging Market Import-Export Trade Statistics |
7.1 Lebanon Chemical Packaging Market Export to Major Countries |
7.2 Lebanon Chemical Packaging Market Imports from Major Countries |
8 Lebanon Chemical Packaging Market Key Performance Indicators |
9 Lebanon Chemical Packaging Market - Opportunity Assessment |
9.1 Lebanon Chemical Packaging Market Opportunity Assessment, By Product Types, 2022 & 2032F |
9.2 Lebanon Chemical Packaging Market Opportunity Assessment, By Applications, 2022 & 2032F |
10 Lebanon Chemical Packaging Market - Competitive Landscape |
10.1 Lebanon Chemical Packaging Market Revenue Share, By Companies, 2025 |
10.2 Lebanon Chemical Packaging Market Competitive Benchmarking, By Operating and Technical Parameters |
11 Company Profiles |
12 Recommendations |
13 Disclaimer |
Global Go To Market Strategy - 2030
Export potential enables firms to identify high-growth global markets with greater confidence by combining advanced trade intelligence with a structured quantitative methodology. The framework analyzes emerging demand trends and country-level import patterns while integrating macroeconomic and trade datasets such as GDP and population forecasts, bilateral import–export flows, tariff structures, elasticity differentials between developed and developing economies, geographic distance, and import demand projections. Using weighted trade values from 2020–2024 as the base period to project country-to-country export potential for 2030, these inputs are operationalized through calculated drivers such as gravity model parameters, tariff impact factors, and projected GDP per-capita growth. Through an analysis of hidden potentials, demand hotspots, and market conditions that are most favorable to success, this method enables firms to focus on target countries, maximize returns, and global expansion with data, backed by accuracy.
By factoring in the projected importer demand gap that is currently unmet and could be potential opportunity, it identifies the potential for the Exporter (Country) among 190 countries, against the general trade analysis, which identifies the biggest importer or exporter.
To discover high-growth global markets and optimize your business strategy:
Click Here
Pricing
- Single User License$ 1,995
- Department License$ 2,400
- Site License$ 3,120
- Global License$ 3,795

Leadership Perspectives from Industry Events
Search
Thought Leadership and Analyst Meet


Our Clients
6WResearch In News
- India Air Conditioner Market Set for Strong Rebound in 2026 After Weather-Led Correction and GST-Driven Recovery: 6Wresearch
- ADAS in India: How Automatic Emergency Braking, Blind Spot Detection & Driver Monitoring are Transforming Road Safety
- Doha a strategic location for EV manufacturing hub: IPA Qatar
- Demand for luxury TVs surging in the GCC, says Samsung
- Empowering Growth: The Thriving Journey of Bangladesh’s Cable Industry
- Demand for luxury TVs surging in the GCC, says Samsung
Latest Reports
- Nicaragua RPG Gaming Market (2026-2032)
- New Zealand RPG Gaming Market (2026-2032)
- Netherlands RPG Gaming Market (2026-2032)
- Nauru RPG Gaming Market (2026-2032)
- Namibia RPG Gaming Market (2026-2032)
- Mozambique RPG Gaming Market (2026-2032)
- Montenegro RPG Gaming Market (2026-2032)
- Mongolia RPG Gaming Market (2026-2032)
- Monaco RPG Gaming Market (2026-2032)
- Micronesia RPG Gaming Market (2026-2032)
Industry Events and Analyst Meet

HIMTEX 2026

India Refining Summit 2026

India EV Show 2026

EV tech India Expo 2026

Auto Tech Asia 2026
Whitepaper
- Middle East & Africa Commercial Security Market Click here to view more.
- Middle East & Africa Fire Safety Systems & Equipment Market Click here to view more.
- GCC Drone Market Click here to view more.
- Middle East Lighting Fixture Market Click here to view more.
- GCC Physical & Perimeter Security Market Click here to view more.