Lebanon Rare Earth & Products Market (2026-2032) | Industry, Analysis, Trends, Value, Size, COVID-19 IMPACT, Share, Growth, Revenue, Companies, Forecast & Outlook
Market Forecast By Product Types (Cerium, Dysprosium, Erbium, Europium, Gadolinium, Holmium, Lanthanum, Others), By Applications (Magnets, Catalysts, Metallurgy, Polishing, Glass, Phosphors, Ceramics, Others) And Competitive Landscape
| Product Code: ETC008767 | Publication Date: Jun 2023 | Product Type: Report | ||
| Publisher: 6Wresearch | Author: Ravi Bhandari | No. of Pages: 70 | No. of Figures: 35 | No. of Tables: 5 |
Lebanon Rare Earth & Products Market Summary
The lebanon rare earth & products market was estimated at USD 281 Million in 2025 and is projected to reach USD 375 Million by 2032, growing at a CAGR of 5.1% from 2026 to 2032.
Lebanon Rare Earth & Products Market Year-wise Growth Rate and Key Drivers
This graph highlights how the Lebanon Rare Earth & Products Market has steadily grown over the past five years, supported by major growth factors.
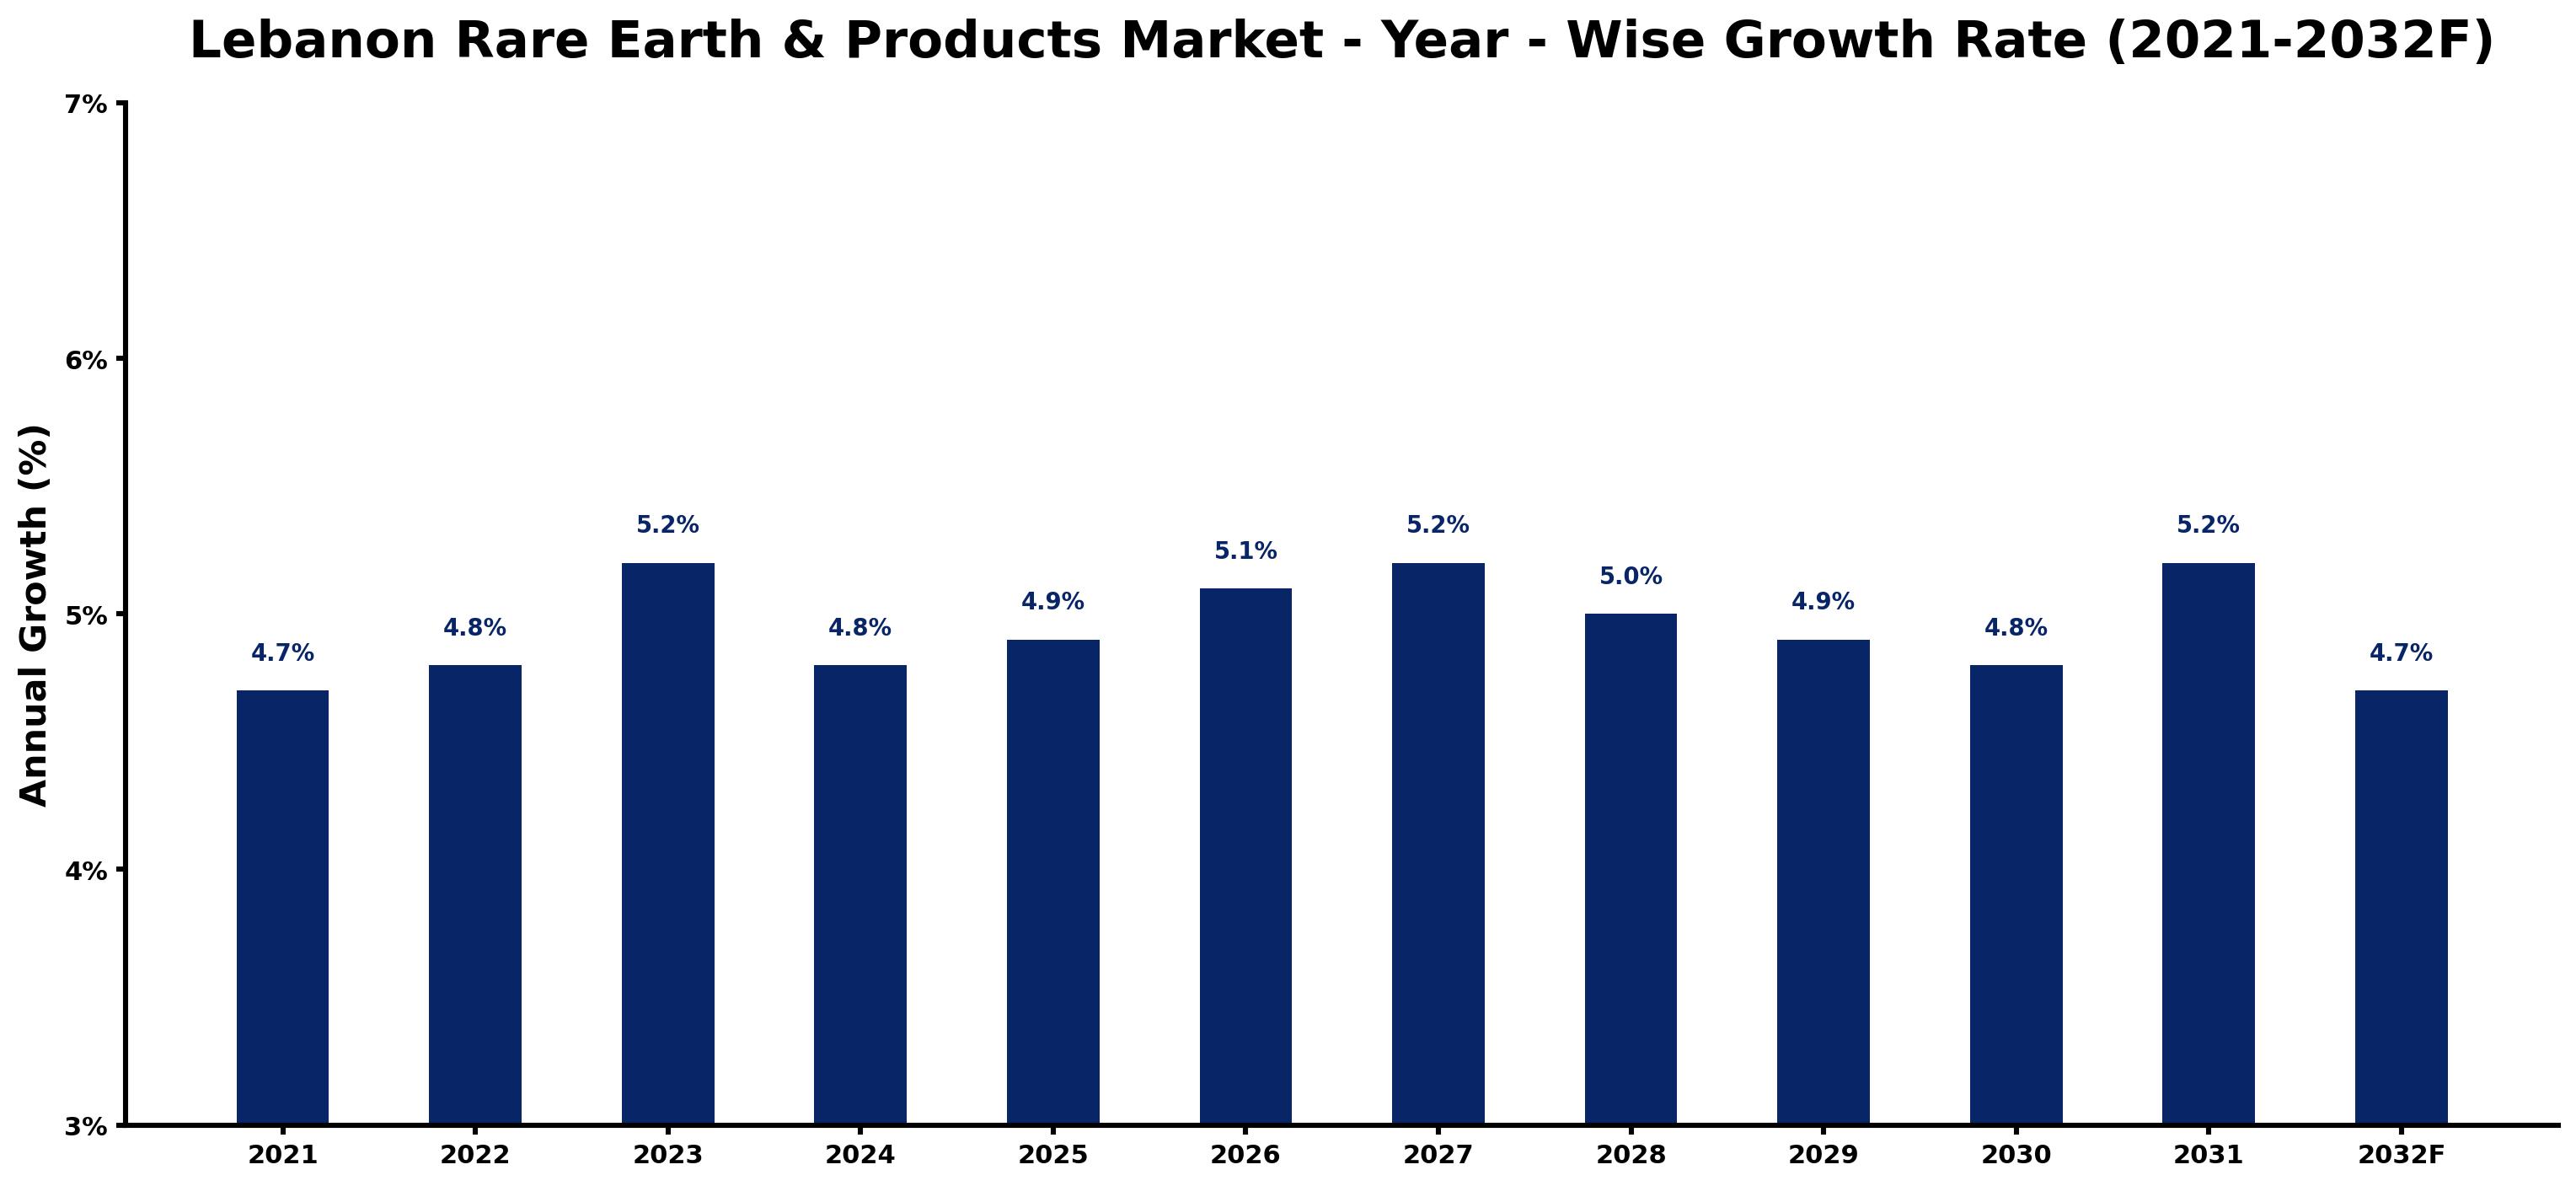
The table below presents the year wise growth rates along with the key drivers influencing the market
| Year | Growth Rate | Major Drivers |
| 2021 | 4.7% | Manufacturers face supply chain constraints, impacting the rare earth product availability. |
| 2022 | 4.8% | Local enterprises increasingly recognize the value of sourcing rare earth materials domestically. |
| 2023 | 5.2% | Investment in research and development fosters innovation within the rare earth sector. |
| 2024 | 4.8% | International partnerships promote technology transfer, enhancing local processing capabilities. |
| 2025 | 4.9% | Emerging applications in green technologies create new opportunities for rare earth usage. |
| 2026 | 5.1% | Lebanon's geological surveys reveal untapped reserves, attracting exploratory investments. |
| 2027 | 5.2% | Consumer awareness around sustainable products encourages demand for eco-friendly rare earths. |
| 2028 | 5.0% | Infrastructure projects expand, necessitating increased rare earth materials for construction. |
| 2029 | 4.9% | Regional trade agreements facilitate easier access to global rare earth supply chains. |
| 2030 | 4.8% | Educational programs focus on rare earth mining, generating skilled labor for the market. |
| 2031 | 5.2% | Technological advancements reduce extraction costs, improving profitability for local producers. |
| 2032 | 4.7% | Government collaborations with private sector drive growth through targeted investment initiatives. |
Note - Market size estimations and growth projections presented in this report are based on 6Wresearch's advanced forecasting approach, validated with industry datasets as of June 2026.
Lebanon Rare Earth & Products Market Synopsis
The Lebanon Rare Earth Products Market is projected to reach 5.1% and witness significant growth during the forecast period (2026-2032). The anticipated moderate compound annual growth rate (CAGR) of 4.86% can be attributed to an increasing demand for rare earth materials such as phosphors, magnets, and advanced ceramics across key sectors like automotive, electronics, and semiconductors. Furthermore, the Lebanese government is actively promoting the development of local rare earth metal production, enhancing the industry's potential to meet growing domestic and international demands.
Lebanon Rare Earth & Products Market Growth Drivers
Several factors are fostering growth within the Lebanon Rare Earth & Products Market. The primary growth drivers include:
- Rising Industrial Demand: The adoption of rare earth materials in manufacturing sectors, particularly in electronics and automotive, is expanding rapidly due to their unique chemical and physical properties.
- Government Support: Initiatives aimed at domestic production of rare earth metals have created a more favorable environment for investment and development.
- Focus on Sustainability: The increasing emphasis on environmentally friendly products is driving demand for rare earth substitutes that offer sustainable solutions in manufacturing.
- Technological Advancements: Innovations in extraction and processing technologies are improving the efficiency of rare earth production, thereby supporting market growth.
- Global Market Trends: The global shift towards renewable energy sources and high-tech goods has further enhanced the demand for rare earth materials, positioning Lebanon to benefit from this trend.
Lebanon Rare Earth & Products Market Challenges and Restraints
Despite the positive outlook, the Lebanon Rare Earth & Products Market faces certain challenges that may hinder its progress:
- Resource Accessibility: Limited availability of rare earth deposits within Lebanon could constrain the ability to meet local and international demand effectively.
- Environmental Regulations: Stricter environmental laws can impose additional costs and operational challenges on rare earth extraction and processing companies.
- Market Competition: Increasing competition from other countries with established rare earth production capabilities may impact Lebanon's market share.
- Infrastructure Limitations: Inadequate infrastructure and logistical challenges might slow down the development and distribution channels needed for rare earth products.
- Economic Fluctuations: Economic instability or downturns can significantly affect investment in the rare earth industry, limiting growth potential.
Lebanon Rare Earth & Products Market Investment Opportunities
The investment landscape for the Lebanon Rare Earth & Products Market is promising, with several avenues for economic growth:
- Mining and Exploration: Opportunities exist for investments in exploration and development of rare earth deposits, focusing on untapped resources in Lebanon.
- Production Facilities: Establishing local production facilities can capitalize on the growing demand for rare earth materials, creating jobs and boosting local economies.
- Research and Development: Funding R&D initiatives aimed at innovative uses of rare earth materials can lead to advanced applications and enhanced market offerings.
- Public-Private Partnerships: Collaborations with the government to develop sustainable mining practices can attract foreign investments.
- Export Potential: Developing an export framework for processed rare earth products can open up international markets and enhance revenue streams.
Lebanon Rare Earth & Products Market Government Investment and Initiatives
The Lebanese government has been proactive in promoting the rare earth products sector through various initiatives. Efforts include:
- Policy Development: The government is crafting policies aimed at encouraging local production of rare earth materials and reducing reliance on imports.
- Financial Incentives: Initiatives that provide financial support and tax breaks to businesses engaged in rare earth extraction and refining have been introduced.
- Industry Collaboration: The government is facilitating partnerships between local companies and international stakeholders to enhance technological capabilities and market access.
- Sustainability Programs: Initiatives to promote environmentally friendly mining practices are being rolled out to ensure sustainable industry growth.
- Investment in Infrastructure: The government is investing in infrastructure improvements to support the logistics of rare earth production and distribution.
Lebanon Rare Earth & Products Market Latest Developments (May 2025 - June 2026)
In the period from May 2025 to June 2026, the Lebanon Rare Earth & Products Market has witnessed several noteworthy developments that indicate a forward momentum within the industry:
- Enhanced Regulatory Framework: New regulations have been introduced to streamline the licensing process for rare earth mining, improving the investment climate.
- Increased Collaboration: Partnerships between local enterprises and international firms are being formed, leading to knowledge transfer and technology sharing.
- Focus on Clean Technology: There has been a marked increase in the development of clean extraction technologies aimed at minimizing environmental impact.
- Market Research Initiatives: Local agencies are conducting research to assess rare earth resource potential, laying the groundwork for future exploration projects.
- Investment in Human Capital: Education and training programs have been initiated to develop a skilled workforce capable of supporting the rare earth industry.
Lebanon Rare Earth & Products Market - Key Attractiveness of the Report
- 10 Years of Market Numbers
- Historical Data Starting from 2022 to 2025
- Base Year: 2025
- Forecast Data until 2032
- Key Performance Indicators Impacting the Market
- Major Upcoming Developments and Projects
Key Highlights of the Report:
- Lebanon Rare Earth & Products Market Outlook
- Market Size of Lebanon Rare Earth & Products Market, 2025
- Forecast of Lebanon Rare Earth & Products Market, 2032F
- Historical Data and Forecast of Lebanon Rare Earth & Products Revenues & Volume for the Period 2022-2032F
- Lebanon Rare Earth & Products Market Trend Evolution
- Lebanon Rare Earth & Products Market Drivers and Challenges
- Lebanon Rare Earth & Products Price Trends
- Lebanon Rare Earth & Products Porter's Five Forces
- Lebanon Rare Earth & Products Industry Life Cycle
- Historical Data and Forecast of Lebanon Rare Earth & Products Market Revenues & Volume By Product Types for the Period 2022-2032F
- Historical Data and Forecast of Lebanon Rare Earth & Products Market Revenues & Volume By Cerium for the Period 2022-2032F
- Historical Data and Forecast of Lebanon Rare Earth & Products Market Revenues & Volume By Dysprosium for the Period 2022-2032F
- Historical Data and Forecast of Lebanon Rare Earth & Products Market Revenues & Volume By Erbium for the Period 2022-2032F
- Historical Data and Forecast of Lebanon Rare Earth & Products Market Revenues & Volume By Europium for the Period 2022-2032F
- Historical Data and Forecast of Lebanon Rare Earth & Products Market Revenues & Volume By Gadolinium for the Period 2022-2032F
- Historical Data and Forecast of Lebanon Rare Earth & Products Market Revenues & Volume By Holmium for the Period 2022-2032F
- Historical Data and Forecast of Lebanon Rare Earth & Products Market Revenues & Volume By Lanthanum for the Period 2022-2032F
- Historical Data and Forecast of Lebanon Cerium Rare Earth & Products Market Revenues & Volume By Others for the Period 2022-2032F
- Historical Data and Forecast of Lebanon Rare Earth & Products Market Revenues & Volume By Applications for the Period 2022-2032F
- Historical Data and Forecast of Lebanon Rare Earth & Products Market Revenues & Volume By Magnets for the Period 2022-2032F
- Historical Data and Forecast of Lebanon Rare Earth & Products Market Revenues & Volume By Catalysts for the Period 2022-2032F
- Historical Data and Forecast of Lebanon Rare Earth & Products Market Revenues & Volume By Metallurgy for the Period 2022-2032F
- Historical Data and Forecast of Lebanon Rare Earth & Products Market Revenues & Volume By Polishing for the Period 2022-2032F
- Historical Data and Forecast of Lebanon Rare Earth & Products Market Revenues & Volume By Glass for the Period 2022-2032F
- Historical Data and Forecast of Lebanon Rare Earth & Products Market Revenues & Volume By Phosphors for the Period 2022-2032F
- Historical Data and Forecast of Lebanon Rare Earth & Products Market Revenues & Volume By Ceramics for the Period 2022-2032F
- Historical Data and Forecast of Lebanon Rare Earth & Products Market Revenues & Volume By Others for the Period 2022-2032F
- Lebanon Rare Earth & Products Import Export Trade Statistics
- Market Opportunity Assessment By Product Types
- Market Opportunity Assessment By Applications
- Lebanon Rare Earth & Products Top Companies Market Share
- Lebanon Rare Earth & Products Competitive Benchmarking By Technical and Operational Parameters
- Lebanon Rare Earth & Products Company Profiles
- Lebanon Rare Earth & Products Key Strategic Recommendations
Frequently Asked Questions About the Market Study (FAQs):
The market is driven by increased demand from industries such as automotive and electronics, government support for local production, and a growing emphasis on sustainability.
Challenges include limited resource availability, stringent environmental regulations, market competition, and infrastructure limitations.
Government initiatives include developing favorable policies, providing financial incentives, fostering industry collaboration, and investing in infrastructure improvements.
Recent developments include enhanced regulatory frameworks, increased collaboration with international firms, a focus on clean technology, and investment in workforce development.
6Wresearch actively monitors the Lebanon Rare Earth & Products Market and publishes its comprehensive annual report, highlighting emerging trends, growth drivers, revenue analysis, and forecast outlook. Our insights help businesses to make data-backed strategic decisions with ongoing market dynamics. Our analysts track relevent industries related to the Lebanon Rare Earth & Products Market, allowing our clients with actionable intelligence and reliable forecasts tailored to emerging regional needs.
Yes, we provide customisation as per your requirements. To learn more, feel free to contact us on sales@6wresearch.com
1 Executive Summary |
2 Introduction |
2.1 Key Highlights of the Report |
2.2 Report Description |
2.3 Market Scope & Segmentation |
2.4 Research Methodology |
2.5 Assumptions |
3 Lebanon Rare Earth & Products Market Overview |
3.1 Lebanon Country Macro Economic Indicators |
3.2 Lebanon Rare Earth & Products Market Revenues & Volume, 2022 & 2032F |
3.3 Lebanon Rare Earth & Products Market - Industry Life Cycle |
3.4 Lebanon Rare Earth & Products Market - Porter's Five Forces |
3.5 Lebanon Rare Earth & Products Market Revenues & Volume Share, By Product Types, 2022 & 2032F |
3.6 Lebanon Rare Earth & Products Market Revenues & Volume Share, By Applications, 2022 & 2032F |
4 Lebanon Rare Earth & Products Market Dynamics |
4.1 Impact Analysis |
4.2 Market Drivers |
4.3 Market Restraints |
5 Lebanon Rare Earth & Products Market Trends |
6 Lebanon Rare Earth & Products Market, By Types |
6.1 Lebanon Rare Earth & Products Market, By Product Types |
6.1.1 Overview and Analysis |
6.1.2 Lebanon Rare Earth & Products Market Revenues & Volume, By Product Types, 2022-2032F |
6.1.3 Lebanon Rare Earth & Products Market Revenues & Volume, By Cerium, 2022-2032F |
6.1.4 Lebanon Rare Earth & Products Market Revenues & Volume, By Dysprosium, 2022-2032F |
6.1.5 Lebanon Rare Earth & Products Market Revenues & Volume, By Erbium, 2022-2032F |
6.1.6 Lebanon Rare Earth & Products Market Revenues & Volume, By Europium, 2022-2032F |
6.1.7 Lebanon Rare Earth & Products Market Revenues & Volume, By Gadolinium, 2022-2032F |
6.1.8 Lebanon Rare Earth & Products Market Revenues & Volume, By Holmium, 2022-2032F |
6.1.9 Lebanon Rare Earth & Products Market Revenues & Volume, By Others, 2022-2032F |
6.1.10 Lebanon Rare Earth & Products Market Revenues & Volume, By Others, 2022-2032F |
6.2 Lebanon Rare Earth & Products Market, By Applications |
6.2.1 Overview and Analysis |
6.2.2 Lebanon Rare Earth & Products Market Revenues & Volume, By Magnets, 2022-2032F |
6.2.3 Lebanon Rare Earth & Products Market Revenues & Volume, By Catalysts, 2022-2032F |
6.2.4 Lebanon Rare Earth & Products Market Revenues & Volume, By Metallurgy, 2022-2032F |
6.2.5 Lebanon Rare Earth & Products Market Revenues & Volume, By Polishing, 2022-2032F |
6.2.6 Lebanon Rare Earth & Products Market Revenues & Volume, By Glass, 2022-2032F |
6.2.7 Lebanon Rare Earth & Products Market Revenues & Volume, By Phosphors, 2022-2032F |
6.2.8 Lebanon Rare Earth & Products Market Revenues & Volume, By Others, 2022-2032F |
6.2.9 Lebanon Rare Earth & Products Market Revenues & Volume, By Others, 2022-2032F |
7 Lebanon Rare Earth & Products Market Import-Export Trade Statistics |
7.1 Lebanon Rare Earth & Products Market Export to Major Countries |
7.2 Lebanon Rare Earth & Products Market Imports from Major Countries |
8 Lebanon Rare Earth & Products Market Key Performance Indicators |
9 Lebanon Rare Earth & Products Market - Opportunity Assessment |
9.1 Lebanon Rare Earth & Products Market Opportunity Assessment, By Product Types, 2022 & 2032F |
9.2 Lebanon Rare Earth & Products Market Opportunity Assessment, By Applications, 2022 & 2032F |
10 Lebanon Rare Earth & Products Market - Competitive Landscape |
10.1 Lebanon Rare Earth & Products Market Revenue Share, By Companies, 2025 |
10.2 Lebanon Rare Earth & Products Market Competitive Benchmarking, By Operating and Technical Parameters |
11 Company Profiles |
12 Recommendations |
13 Disclaimer |
Global Go To Market Strategy - 2030
Export potential enables firms to identify high-growth global markets with greater confidence by combining advanced trade intelligence with a structured quantitative methodology. The framework analyzes emerging demand trends and country-level import patterns while integrating macroeconomic and trade datasets such as GDP and population forecasts, bilateral import–export flows, tariff structures, elasticity differentials between developed and developing economies, geographic distance, and import demand projections. Using weighted trade values from 2020–2024 as the base period to project country-to-country export potential for 2030, these inputs are operationalized through calculated drivers such as gravity model parameters, tariff impact factors, and projected GDP per-capita growth. Through an analysis of hidden potentials, demand hotspots, and market conditions that are most favorable to success, this method enables firms to focus on target countries, maximize returns, and global expansion with data, backed by accuracy.
By factoring in the projected importer demand gap that is currently unmet and could be potential opportunity, it identifies the potential for the Exporter (Country) among 190 countries, against the general trade analysis, which identifies the biggest importer or exporter.
To discover high-growth global markets and optimize your business strategy:
Click Here
Pricing
- Single User License$ 1,995
- Department License$ 2,400
- Site License$ 3,120
- Global License$ 3,795

Leadership Perspectives from Industry Events
Search
Thought Leadership and Analyst Meet


Our Clients
6WResearch In News
- India Air Conditioner Market Set for Strong Rebound in 2026 After Weather-Led Correction and GST-Driven Recovery: 6Wresearch
- ADAS in India: How Automatic Emergency Braking, Blind Spot Detection & Driver Monitoring are Transforming Road Safety
- Doha a strategic location for EV manufacturing hub: IPA Qatar
- Demand for luxury TVs surging in the GCC, says Samsung
- Empowering Growth: The Thriving Journey of Bangladesh’s Cable Industry
- Demand for luxury TVs surging in the GCC, says Samsung
Latest Reports
- Nicaragua RPG Gaming Market (2026-2032)
- New Zealand RPG Gaming Market (2026-2032)
- Netherlands RPG Gaming Market (2026-2032)
- Nauru RPG Gaming Market (2026-2032)
- Namibia RPG Gaming Market (2026-2032)
- Mozambique RPG Gaming Market (2026-2032)
- Montenegro RPG Gaming Market (2026-2032)
- Mongolia RPG Gaming Market (2026-2032)
- Monaco RPG Gaming Market (2026-2032)
- Micronesia RPG Gaming Market (2026-2032)
Industry Events and Analyst Meet

EV India Expo 2026

HIMTEX 2026

India Refining Summit 2026

India EV Show 2026

EV tech India Expo 2026
Whitepaper
- Middle East & Africa Commercial Security Market Click here to view more.
- Middle East & Africa Fire Safety Systems & Equipment Market Click here to view more.
- GCC Drone Market Click here to view more.
- Middle East Lighting Fixture Market Click here to view more.
- GCC Physical & Perimeter Security Market Click here to view more.