Lithuania 3D Medical Imaging Devices Market (2026-2032) | Restraints, Opportunities, Challenges, Demand, Growth, Investment Trends, Companies, Value, Segments, Drivers, Supply, Industry, Share, Competitive, Forecast, Analysis, Pricing Analysis, Size, Strategic Insights, Strategy, Outlook, Competition, Segmentation, Consumer Insights, Revenue, Trends
Market Forecast By Device Type (Hardware, X-ray Devices, CT Devices, Ultrasound Systems, MRI Equipment, Software), By Application (Oncology, Cardiology, Orthopedic, Gynecology, Others), By End Use (Hospitals, Diagnostic Imaging Centers, Others, Clinics) And Competitive Landscape
| Product Code: ETC11535738 | Publication Date: Apr 2025 | Updated Date: Apr 2026 | Product Type: Market Research Report | |
| Publisher: 6Wresearch | Author: Bhawna Singh | No. of Pages: 65 | No. of Figures: 34 | No. of Tables: 19 |
Lithuania 3D Medical Imaging Devices Market Size (2020-2030)
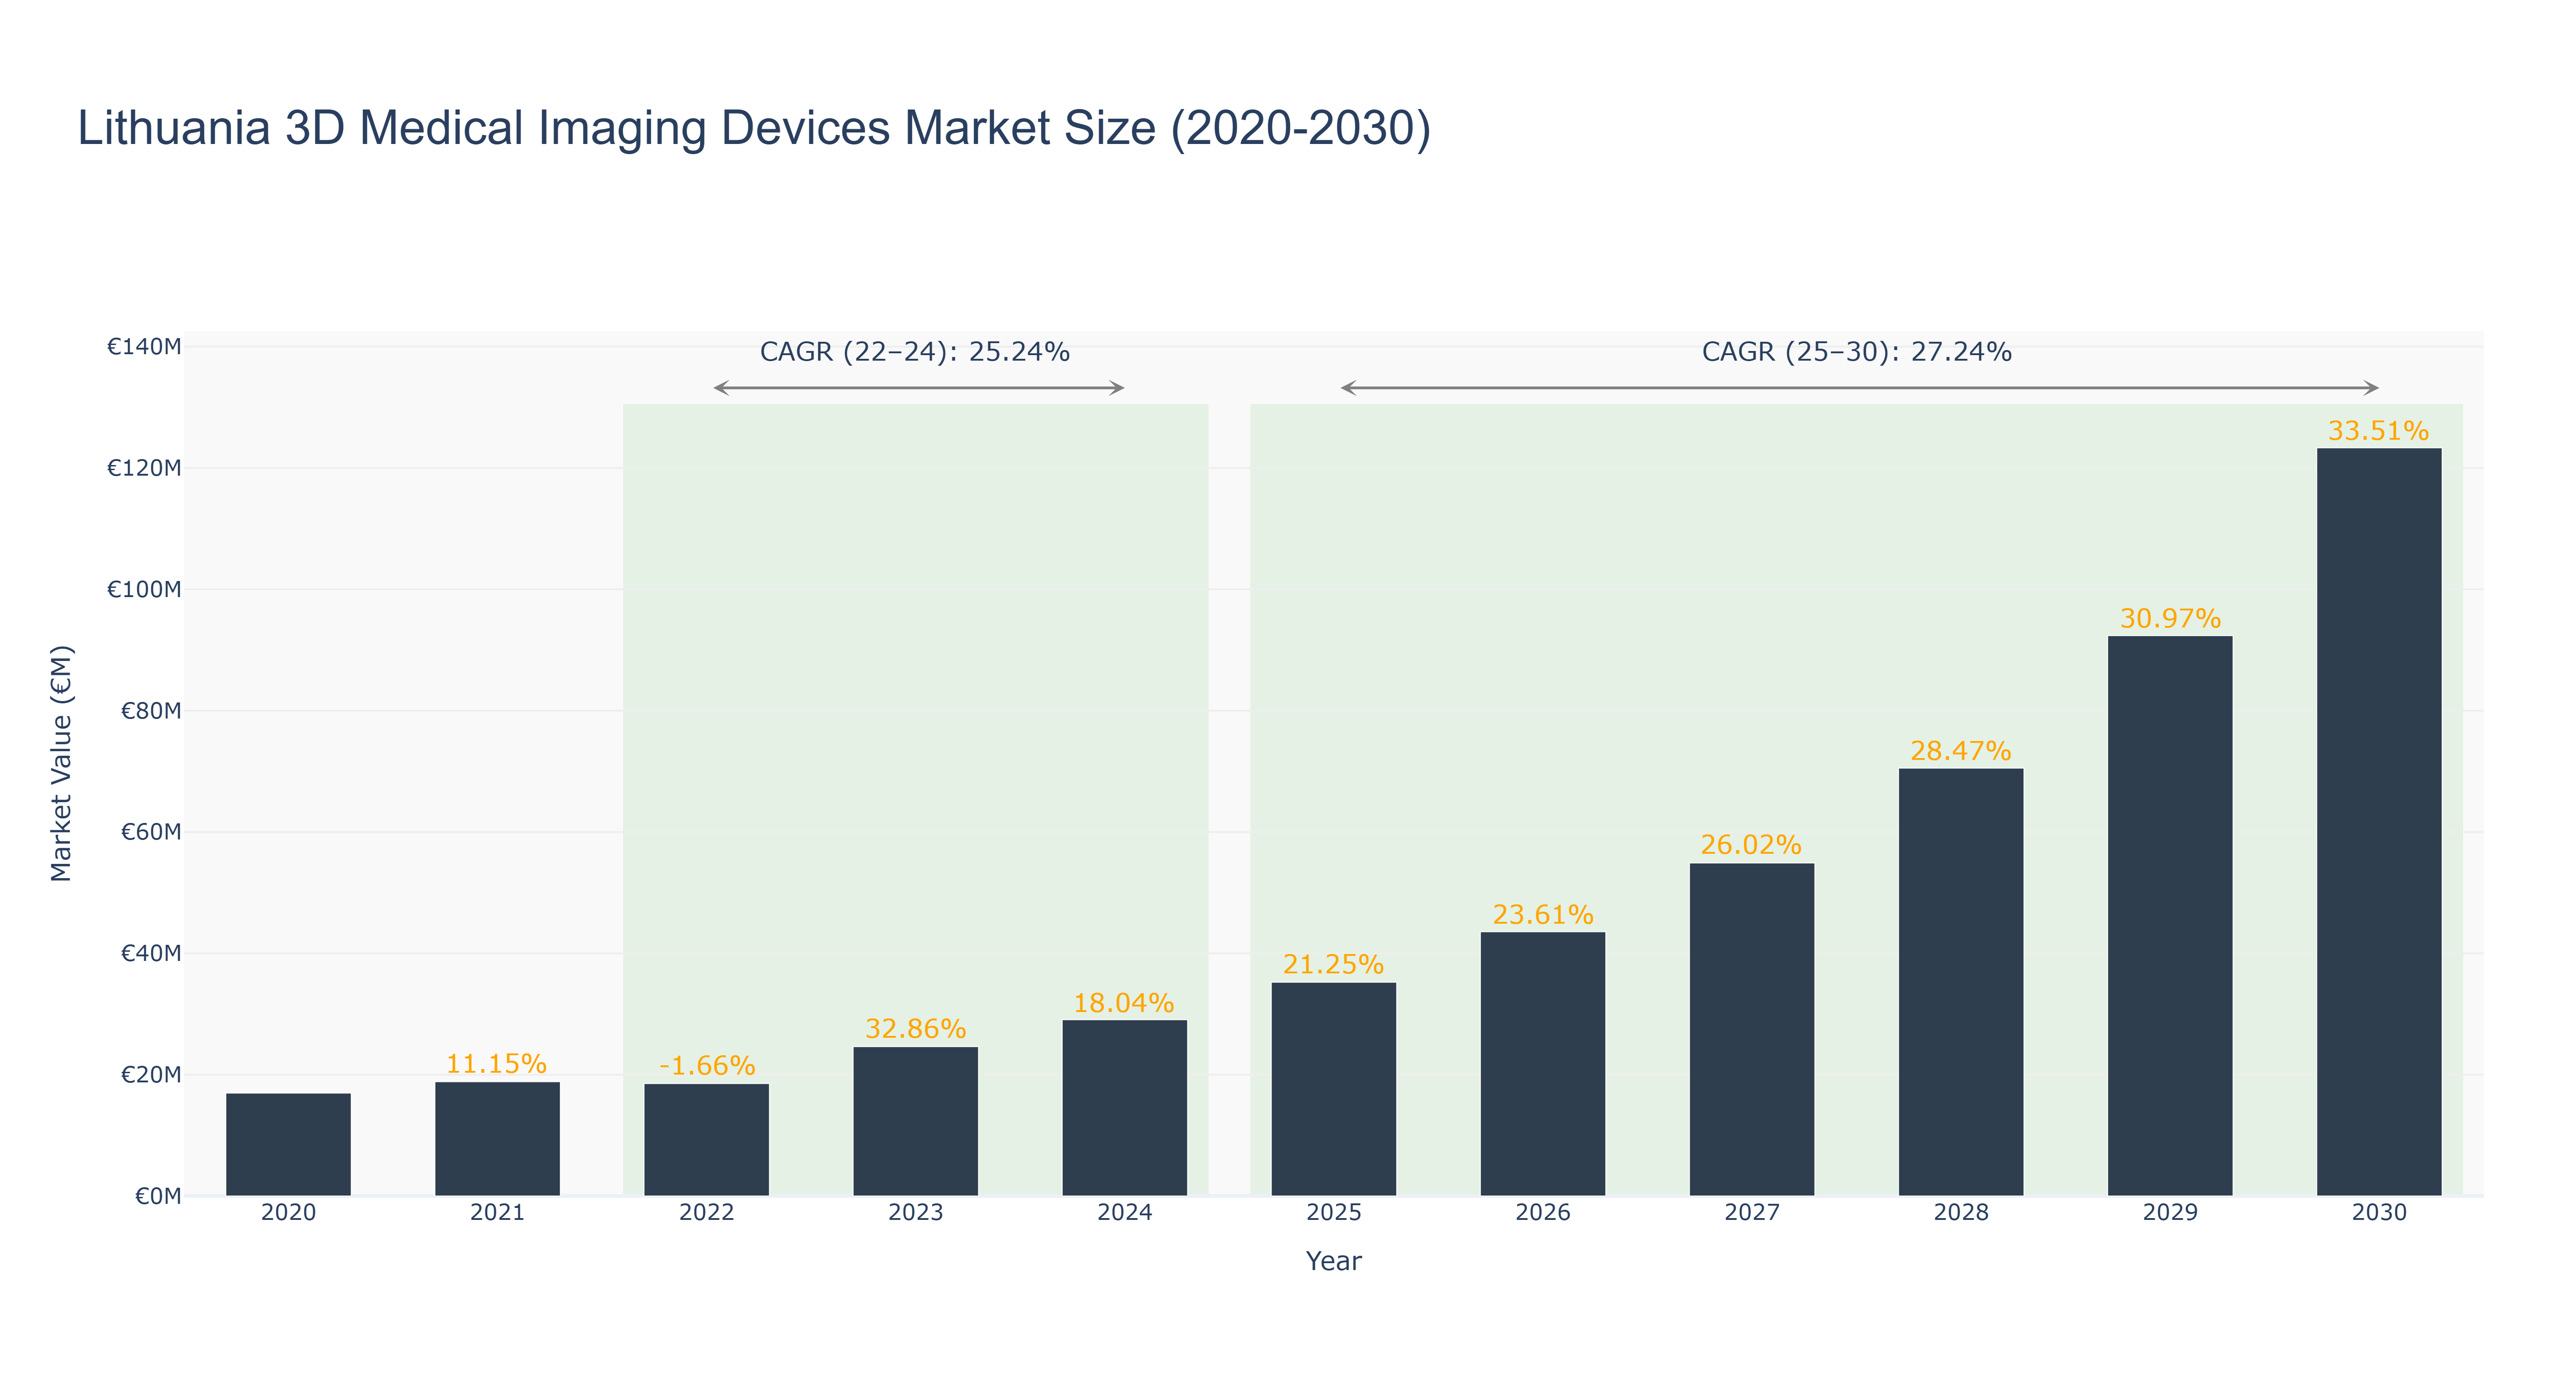
The Lithuania 3D Medical Imaging Devices Market has shown a promising trend over the years. The peak market size was recorded at €123.33 million in 2030, with a steady growth trajectory. From 2020 to 2024, the market size increased from €16.96 million to €29.07 million, showcasing a positive growth pattern. The forecasted market size from 2025 to 2030 is expected to continue this upward trend, reaching €92.37 million in 2029. The CAGR for the period 2022-24 stands at 25.24%, while for 2025-30, it is projected at 27.24%. The market's growth can be attributed to advancements in medical technology, increasing demand for diagnostic imaging, and a growing focus on precision healthcare solutions. Looking ahead, upcoming projects in Lithuania's healthcare sector, such as the integration of AI in medical imaging, are set to further drive market expansion and innovation.
Lithuania 3D Medical Imaging Devices Market: Production & Trade Performance (2019-2025)
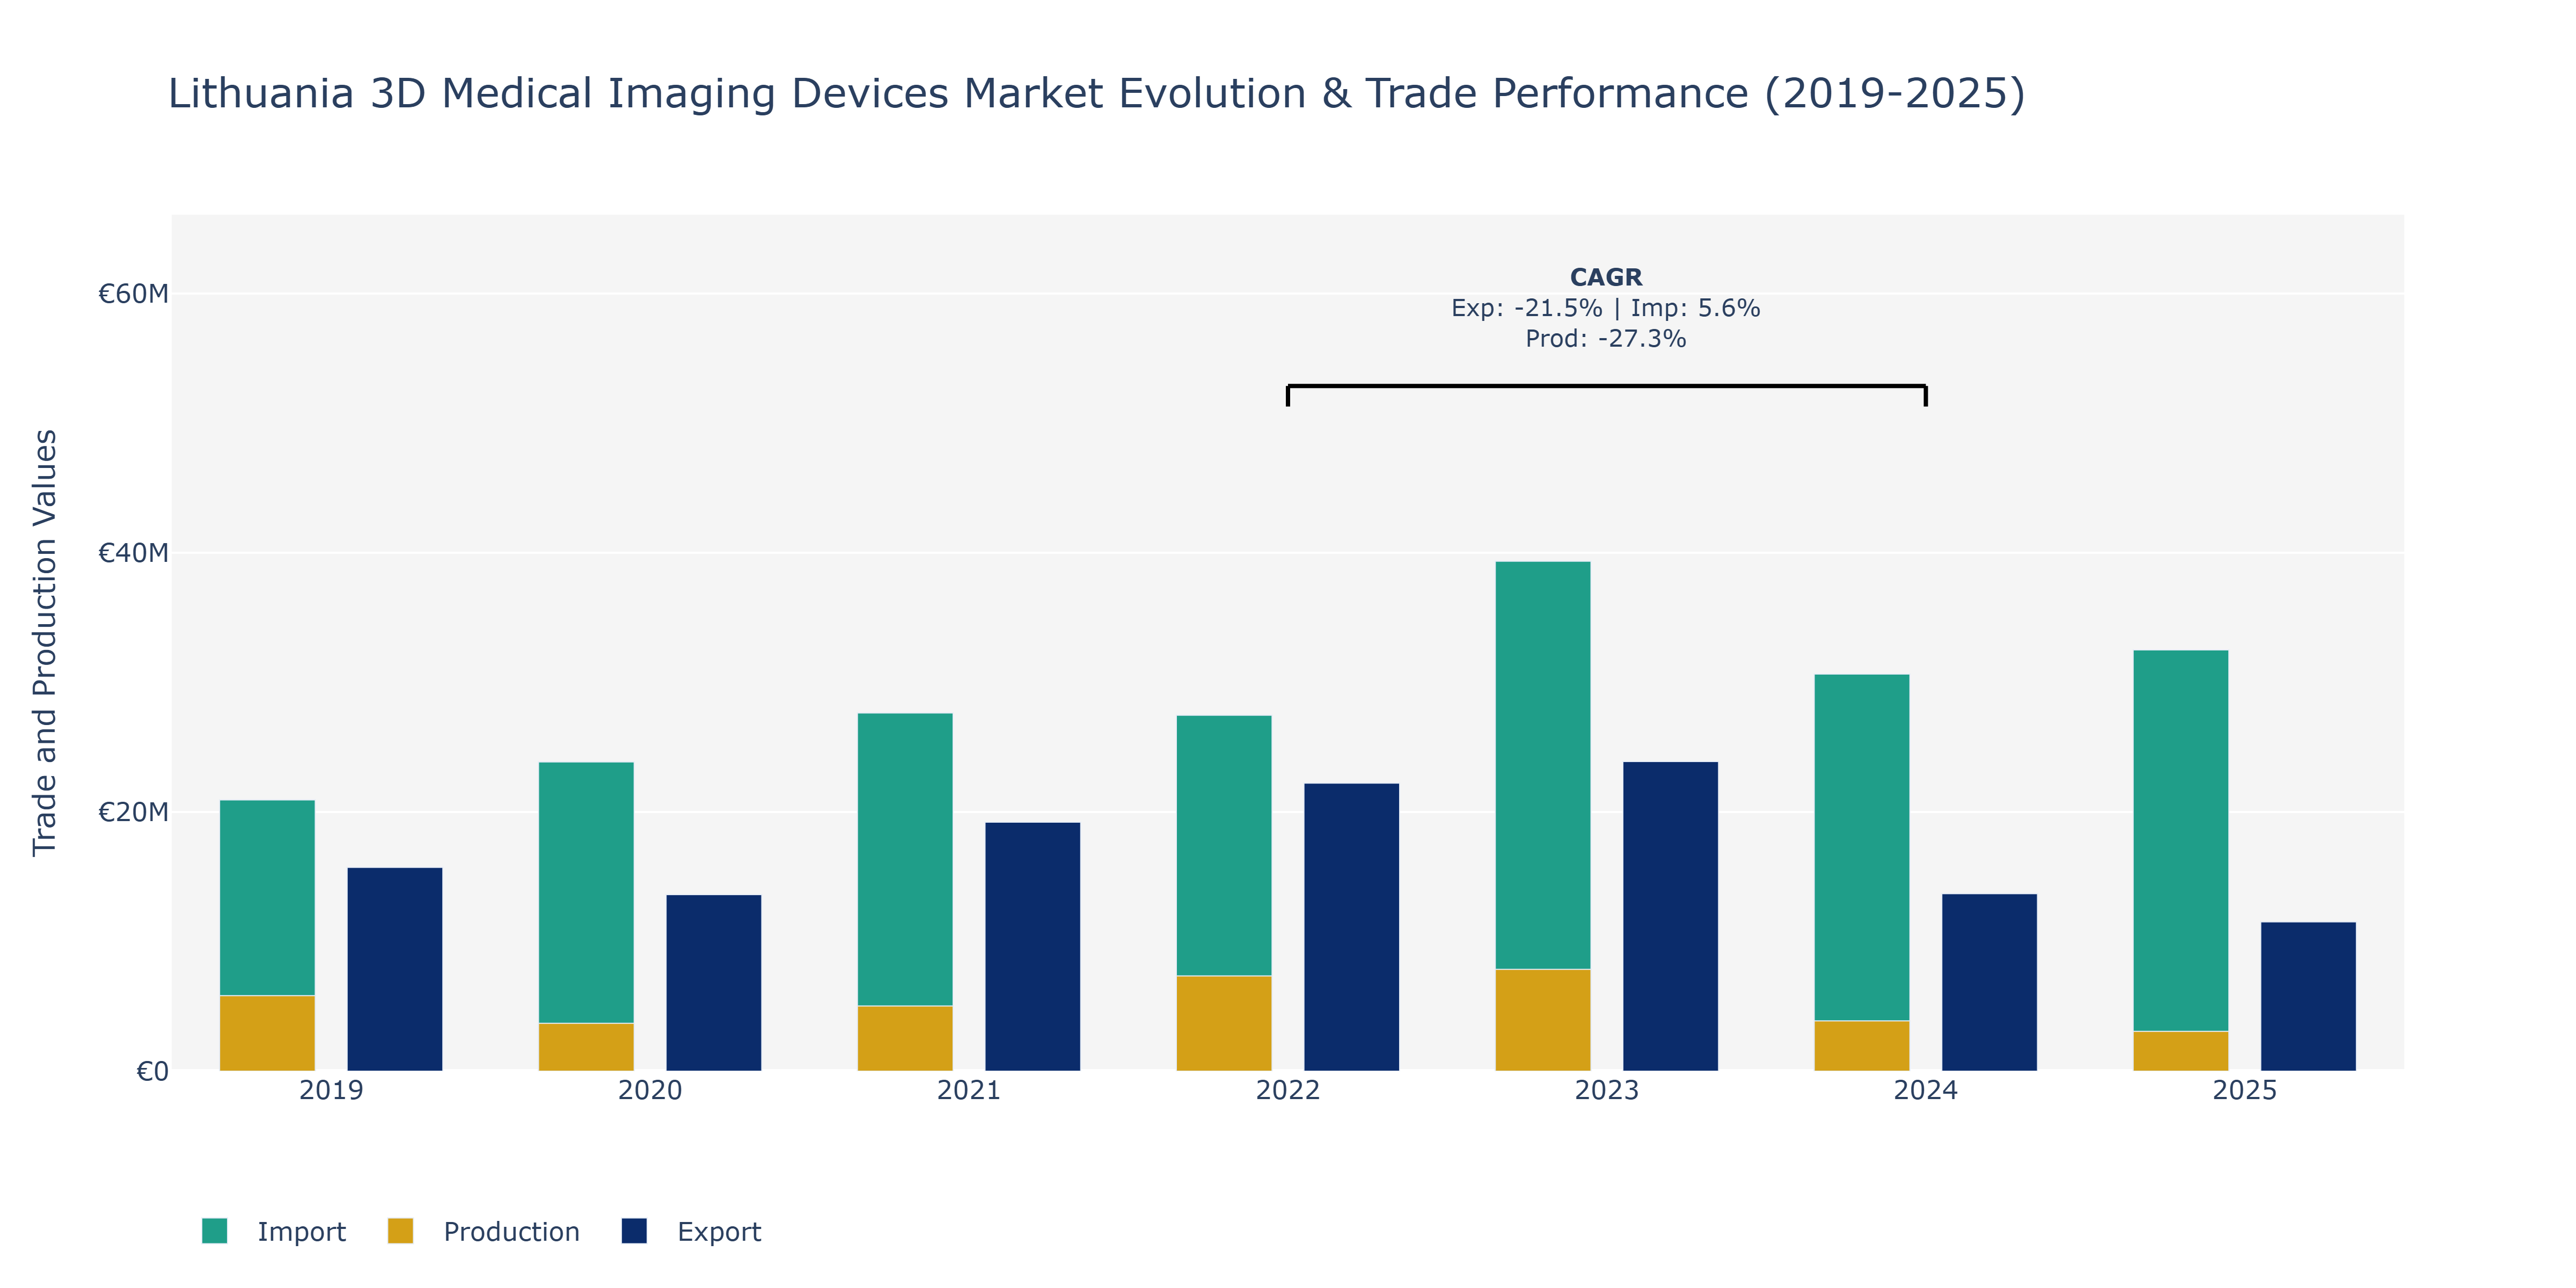
Between 2019 and 2025, Lithuania's 3D Medical Imaging Devices Market displayed varying trends in Exports, Imports, and Production. In 2019, Exports stood at €15.73 million, declining to €11.52 million in 2025, indicating a significant decrease. Imports showed fluctuations, increasing from €20.93 million in 2019 to €32.5 million in 2025. Production value witnessed a decline from €5.83 million in 2019 to €3.08 million in 2025. The peak point for Exports was in 2023, reaching €23.9 million, while Imports peaked in the same year at €39.34 million. Production saw its highest value in 2022 at €7.35 million. These trends can be attributed to factors such as shifts in global demand, technological advancements, and regulatory changes impacting market dynamics in the medical imaging industry. As the market evolves, investment in research and development, strategic partnerships, and product innovation will likely play key roles in shaping future trends in Lithuania's 3D Medical Imaging Devices Market.
Key Highlights of the Report:
- Lithuania 3D Medical Imaging Devices Market Outlook
- Market Size of Lithuania 3D Medical Imaging Devices Market, 2025
- Forecast of Lithuania 3D Medical Imaging Devices Market, 2032
- Historical Data and Forecast of Lithuania 3D Medical Imaging Devices Revenues & Volume for the Period 2022 - 2032F
- Lithuania 3D Medical Imaging Devices Market Trend Evolution
- Lithuania 3D Medical Imaging Devices Market Drivers and Challenges
- Lithuania 3D Medical Imaging Devices Price Trends
- Lithuania 3D Medical Imaging Devices Porter's Five Forces
- Lithuania 3D Medical Imaging Devices Industry Life Cycle
- Historical Data and Forecast of Lithuania 3D Medical Imaging Devices Market Revenues & Volume By Device Type for the Period 2022 - 2032F
- Historical Data and Forecast of Lithuania 3D Medical Imaging Devices Market Revenues & Volume By Hardware for the Period 2022 - 2032F
- Historical Data and Forecast of Lithuania 3D Medical Imaging Devices Market Revenues & Volume By X-ray Devices for the Period 2022 - 2032F
- Historical Data and Forecast of Lithuania 3D Medical Imaging Devices Market Revenues & Volume By CT Devices for the Period 2022 - 2032F
- Historical Data and Forecast of Lithuania 3D Medical Imaging Devices Market Revenues & Volume By Ultrasound Systems for the Period 2022 - 2032F
- Historical Data and Forecast of Lithuania 3D Medical Imaging Devices Market Revenues & Volume By MRI Equipment for the Period 2022 - 2032F
- Historical Data and Forecast of Lithuania 3D Medical Imaging Devices Market Revenues & Volume By Software for the Period 2022 - 2032F
- Historical Data and Forecast of Lithuania 3D Medical Imaging Devices Market Revenues & Volume By Application for the Period 2022 - 2032F
- Historical Data and Forecast of Lithuania 3D Medical Imaging Devices Market Revenues & Volume By Oncology for the Period 2022 - 2032F
- Historical Data and Forecast of Lithuania 3D Medical Imaging Devices Market Revenues & Volume By Cardiology for the Period 2022 - 2032F
- Historical Data and Forecast of Lithuania 3D Medical Imaging Devices Market Revenues & Volume By Orthopedic for the Period 2022 - 2032F
- Historical Data and Forecast of Lithuania 3D Medical Imaging Devices Market Revenues & Volume By Gynecology for the Period 2022 - 2032F
- Historical Data and Forecast of Lithuania 3D Medical Imaging Devices Market Revenues & Volume By Others for the Period 2022 - 2032F
- Historical Data and Forecast of Lithuania 3D Medical Imaging Devices Market Revenues & Volume By End Use for the Period 2022 - 2032F
- Historical Data and Forecast of Lithuania 3D Medical Imaging Devices Market Revenues & Volume By Hospitals for the Period 2022 - 2032F
- Historical Data and Forecast of Lithuania 3D Medical Imaging Devices Market Revenues & Volume By Diagnostic Imaging Centers for the Period 2022 - 2032F
- Historical Data and Forecast of Lithuania 3D Medical Imaging Devices Market Revenues & Volume By Others for the Period 2022 - 2032F
- Historical Data and Forecast of Lithuania 3D Medical Imaging Devices Market Revenues & Volume By Clinics for the Period 2022 - 2032F
- Lithuania 3D Medical Imaging Devices Import Export Trade Statistics
- Market Opportunity Assessment By Device Type
- Market Opportunity Assessment By Application
- Market Opportunity Assessment By End Use
- Lithuania 3D Medical Imaging Devices Top Companies Market Share
- Lithuania 3D Medical Imaging Devices Competitive Benchmarking By Technical and Operational Parameters
- Lithuania 3D Medical Imaging Devices Company Profiles
- Lithuania 3D Medical Imaging Devices Key Strategic Recommendations
Frequently Asked Questions About the Market Study (FAQs):
6Wresearch actively monitors the Lithuania 3D Medical Imaging Devices Market and publishes its comprehensive annual report, highlighting emerging trends, growth drivers, revenue analysis, and forecast outlook. Our insights help businesses to make data-backed strategic decisions with ongoing market dynamics. Our analysts track relevent industries related to the Lithuania 3D Medical Imaging Devices Market, allowing our clients with actionable intelligence and reliable forecasts tailored to emerging regional needs.
Yes, we provide customisation as per your requirements. To learn more, feel free to contact us on sales@6wresearch.com
1 Executive Summary |
2 Introduction |
2.1 Key Highlights of the Report |
2.2 Report Description |
2.3 Market Scope & Segmentation |
2.4 Research Methodology |
2.5 Assumptions |
3 Lithuania 3D Medical Imaging Devices Market Overview |
3.1 Lithuania Country Macro Economic Indicators |
3.2 Lithuania 3D Medical Imaging Devices Market Revenues & Volume, 2022 & 2032F |
3.3 Lithuania 3D Medical Imaging Devices Market - Industry Life Cycle |
3.4 Lithuania 3D Medical Imaging Devices Market - Porter's Five Forces |
3.5 Lithuania 3D Medical Imaging Devices Market Revenues & Volume Share, By Device Type, 2022 & 2032F |
3.6 Lithuania 3D Medical Imaging Devices Market Revenues & Volume Share, By Application, 2022 & 2032F |
3.7 Lithuania 3D Medical Imaging Devices Market Revenues & Volume Share, By End Use, 2022 & 2032F |
4 Lithuania 3D Medical Imaging Devices Market Dynamics |
4.1 Impact Analysis |
4.2 Market Drivers |
4.2.1 Increasing demand for advanced medical imaging technologies in Lithuania |
4.2.2 Growing prevalence of chronic diseases driving the need for accurate diagnostics |
4.2.3 Technological advancements in 3D imaging devices enhancing diagnostic capabilities |
4.3 Market Restraints |
4.3.1 High initial investment and maintenance costs associated with 3D medical imaging devices |
4.3.2 Limited healthcare budget and reimbursement policies impacting adoption rates |
4.3.3 Regulatory challenges and compliance requirements affecting market entry barriers |
5 Lithuania 3D Medical Imaging Devices Market Trends |
6 Lithuania 3D Medical Imaging Devices Market, By Types |
6.1 Lithuania 3D Medical Imaging Devices Market, By Device Type |
6.1.1 Overview and Analysis |
6.1.2 Lithuania 3D Medical Imaging Devices Market Revenues & Volume, By Device Type, 2022 - 2032F |
6.1.3 Lithuania 3D Medical Imaging Devices Market Revenues & Volume, By Hardware, 2022 - 2032F |
6.1.4 Lithuania 3D Medical Imaging Devices Market Revenues & Volume, By X-ray Devices, 2022 - 2032F |
6.1.5 Lithuania 3D Medical Imaging Devices Market Revenues & Volume, By CT Devices, 2022 - 2032F |
6.1.6 Lithuania 3D Medical Imaging Devices Market Revenues & Volume, By Ultrasound Systems, 2022 - 2032F |
6.1.7 Lithuania 3D Medical Imaging Devices Market Revenues & Volume, By MRI Equipment, 2022 - 2032F |
6.1.8 Lithuania 3D Medical Imaging Devices Market Revenues & Volume, By Software, 2022 - 2032F |
6.2 Lithuania 3D Medical Imaging Devices Market, By Application |
6.2.1 Overview and Analysis |
6.2.2 Lithuania 3D Medical Imaging Devices Market Revenues & Volume, By Oncology, 2022 - 2032F |
6.2.3 Lithuania 3D Medical Imaging Devices Market Revenues & Volume, By Cardiology, 2022 - 2032F |
6.2.4 Lithuania 3D Medical Imaging Devices Market Revenues & Volume, By Orthopedic, 2022 - 2032F |
6.2.5 Lithuania 3D Medical Imaging Devices Market Revenues & Volume, By Gynecology, 2022 - 2032F |
6.2.6 Lithuania 3D Medical Imaging Devices Market Revenues & Volume, By Others, 2022 - 2032F |
6.3 Lithuania 3D Medical Imaging Devices Market, By End Use |
6.3.1 Overview and Analysis |
6.3.2 Lithuania 3D Medical Imaging Devices Market Revenues & Volume, By Hospitals, 2022 - 2032F |
6.3.3 Lithuania 3D Medical Imaging Devices Market Revenues & Volume, By Diagnostic Imaging Centers, 2022 - 2032F |
6.3.4 Lithuania 3D Medical Imaging Devices Market Revenues & Volume, By Others, 2022 - 2032F |
6.3.5 Lithuania 3D Medical Imaging Devices Market Revenues & Volume, By Clinics, 2022 - 2032F |
7 Lithuania 3D Medical Imaging Devices Market Import-Export Trade Statistics |
7.1 Lithuania 3D Medical Imaging Devices Market Export to Major Countries |
7.2 Lithuania 3D Medical Imaging Devices Market Imports from Major Countries |
8 Lithuania 3D Medical Imaging Devices Market Key Performance Indicators |
8.1 Adoption rate of 3D medical imaging devices in healthcare facilities |
8.2 Average time taken for diagnosis using 3D imaging compared to traditional methods |
8.3 Number of research collaborations and partnerships for advancing 3D imaging technologies |
8.4 Rate of integration of 3D imaging devices with other healthcare IT systems |
8.5 Patient outcomes and satisfaction levels post-implementation of 3D imaging technologies |
9 Lithuania 3D Medical Imaging Devices Market - Opportunity Assessment |
9.1 Lithuania 3D Medical Imaging Devices Market Opportunity Assessment, By Device Type, 2022 & 2032F |
9.2 Lithuania 3D Medical Imaging Devices Market Opportunity Assessment, By Application, 2022 & 2032F |
9.3 Lithuania 3D Medical Imaging Devices Market Opportunity Assessment, By End Use, 2022 & 2032F |
10 Lithuania 3D Medical Imaging Devices Market - Competitive Landscape |
10.1 Lithuania 3D Medical Imaging Devices Market Revenue Share, By Companies, 2025 |
10.2 Lithuania 3D Medical Imaging Devices Market Competitive Benchmarking, By Operating and Technical Parameters |
11 Company Profiles |
12 Recommendations |
13 Disclaimer |
Export potential assessment - trade Analytics for 2030
Export potential enables firms to identify high-growth global markets with greater confidence by combining advanced trade intelligence with a structured quantitative methodology. The framework analyzes emerging demand trends and country-level import patterns while integrating macroeconomic and trade datasets such as GDP and population forecasts, bilateral import–export flows, tariff structures, elasticity differentials between developed and developing economies, geographic distance, and import demand projections. Using weighted trade values from 2020–2024 as the base period to project country-to-country export potential for 2030, these inputs are operationalized through calculated drivers such as gravity model parameters, tariff impact factors, and projected GDP per-capita growth. Through an analysis of hidden potentials, demand hotspots, and market conditions that are most favorable to success, this method enables firms to focus on target countries, maximize returns, and global expansion with data, backed by accuracy.
By factoring in the projected importer demand gap that is currently unmet and could be potential opportunity, it identifies the potential for the Exporter (Country) among 190 countries, against the general trade analysis, which identifies the biggest importer or exporter.
To discover high-growth global markets and optimize your business strategy:
Click Here
Pricing
- Single User License$ 1,995
- Department License$ 2,400
- Site License$ 3,120
- Global License$ 3,795

Search
Thought Leadership and Analyst Meet


Our Clients
Latest Reports
- Canada Cloud CFD Market (2026-2032) | Size & Revenue, Industry, Growth, Competitive Landscape, Forecast, Segmentation, Value, Outlook, Trends, Share, Analysis, Companies
- Taiwan Food Delivery Platform Market (2026-2032) | Companies, Outlook, Analysis, Trends, Value, Revenue, Segmentation, Share, Forecast, Competitive Landscape, Growth, Size & Forecast
- United Kingdom (UK) Long-term Care Insurance Market (2026-2032) | Growth, Share, Consumer Insights, Drivers, Opportunities, Competition, Pricing Analysis, Segments, Restraints, Companies, Competitive, Value, Outlook, Size, Demand, Analysis, Challenges, Strategic Insights, Investment Trends, Revenue, Trends, Supply, Forecast
- United Kingdom (UK) Long Term Care Market (2026-2032) | Companies, Outlook, Analysis, Trends, Value, Revenue, Segmentation, Share, Forecast, Competitive Landscape, Growth, Size & Forecast
- Iraq Insulation and Waterproofing Market (2026-2032) | Outlook, Drivers, Growth, Size, Share, Industry, Revenue, Trends, Demand, Competitive, Strategic Insights, Opportunities, Segments, Companies, Challenges, Strategy, Consumer Insights, Analysis, Investment Trends, Value, Segmentation, Forecast, Restraints
- India Switchgear Market Outlook (2026-2032) | Size, Share, Trends, Growth, Revenue, Forecast, Analysis, Value, Outlook
- Pakistan Contraceptive Implants Market (2025-2031) | Demand, Growth, Size, Share, Industry, Pricing Analysis, Competitive, Strategic Insights, Strategy, Consumer Insights, Analysis, Investment Trends, Opportunities, Revenue, Segments, Value, Segmentation, Supply, Forecast, Restraints, Outlook, Competition, Drivers, Trends, Companies, Challenges
- Sri Lanka Packaging Market (2026-2032) | Outlook, Competition, Drivers, Trends, Demand, Pricing Analysis, Competitive, Strategic Insights, Companies, Challenges, Strategy, Consumer Insights, Analysis, Investment Trends, Opportunities, Growth, Size, Share, Industry, Revenue, Segments, Value, Segmentation, Supply, Forecast, Restraints
- India Kids Watches Market (2026-2032) | Strategy, Consumer Insights, Analysis, Investment Trends, Opportunities, Growth, Size, Share, Industry, Revenue, Segments, Value, Segmentation, Supply, Forecast, Restraints, Outlook, Competition, Drivers, Trends, Demand, Pricing Analysis, Competitive, Strategic Insights, Companies, Challenges
- Saudi Arabia Core Assurance Service Market (2025-2031) | Strategy, Consumer Insights, Analysis, Investment Trends, Opportunities, Growth, Size, Share, Industry, Revenue, Segments, Value, Segmentation, Supply, Forecast, Restraints, Outlook, Competition, Drivers, Trends, Demand, Pricing Analysis, Competitive, Strategic Insights, Companies, Challenges
Industry Events and Analyst Meet

India EV Show 2026

EV tech India Expo 2026

Auto Tech Asia 2026

Battery Tech India 2026

Smart Production Solutions Guangzhou 2026
Whitepaper
- Middle East & Africa Commercial Security Market Click here to view more.
- Middle East & Africa Fire Safety Systems & Equipment Market Click here to view more.
- GCC Drone Market Click here to view more.
- Middle East Lighting Fixture Market Click here to view more.
- GCC Physical & Perimeter Security Market Click here to view more.
6WResearch In News
- Doha a strategic location for EV manufacturing hub: IPA Qatar
- Demand for luxury TVs surging in the GCC, says Samsung
- Empowering Growth: The Thriving Journey of Bangladesh’s Cable Industry
- Demand for luxury TVs surging in the GCC, says Samsung
- Video call with a traditional healer? Once unthinkable, it’s now common in South Africa
- Intelligent Buildings To Smooth GCC’s Path To Net Zero