Lithuania Air Insulated Switchgear Market (2026-2032) | Trends, Growth, Segmentation, Companies, Share, Analysis, Revenue, Size, Outlook, Industry, Value & Forecast
Market Forecast By Voltage Range (3 kV‚œ36 kV , >36 kV), By Installation (Indoor , Outdoor), By Application (Transmission & Distribution, Manufacturing & Processing, Infrastructure & Transportation) And Competitive Landscape
| Product Code: ETC5767851 | Publication Date: Nov 2023 | Updated Date: Apr 2026 | Product Type: Market Research Report | |
| Publisher: 6Wresearch | Author: Ravi Bhandari | No. of Pages: 60 | No. of Figures: 30 | No. of Tables: 5 |
Lithuania Air Insulated Switchgear Market Size (2020-2030)
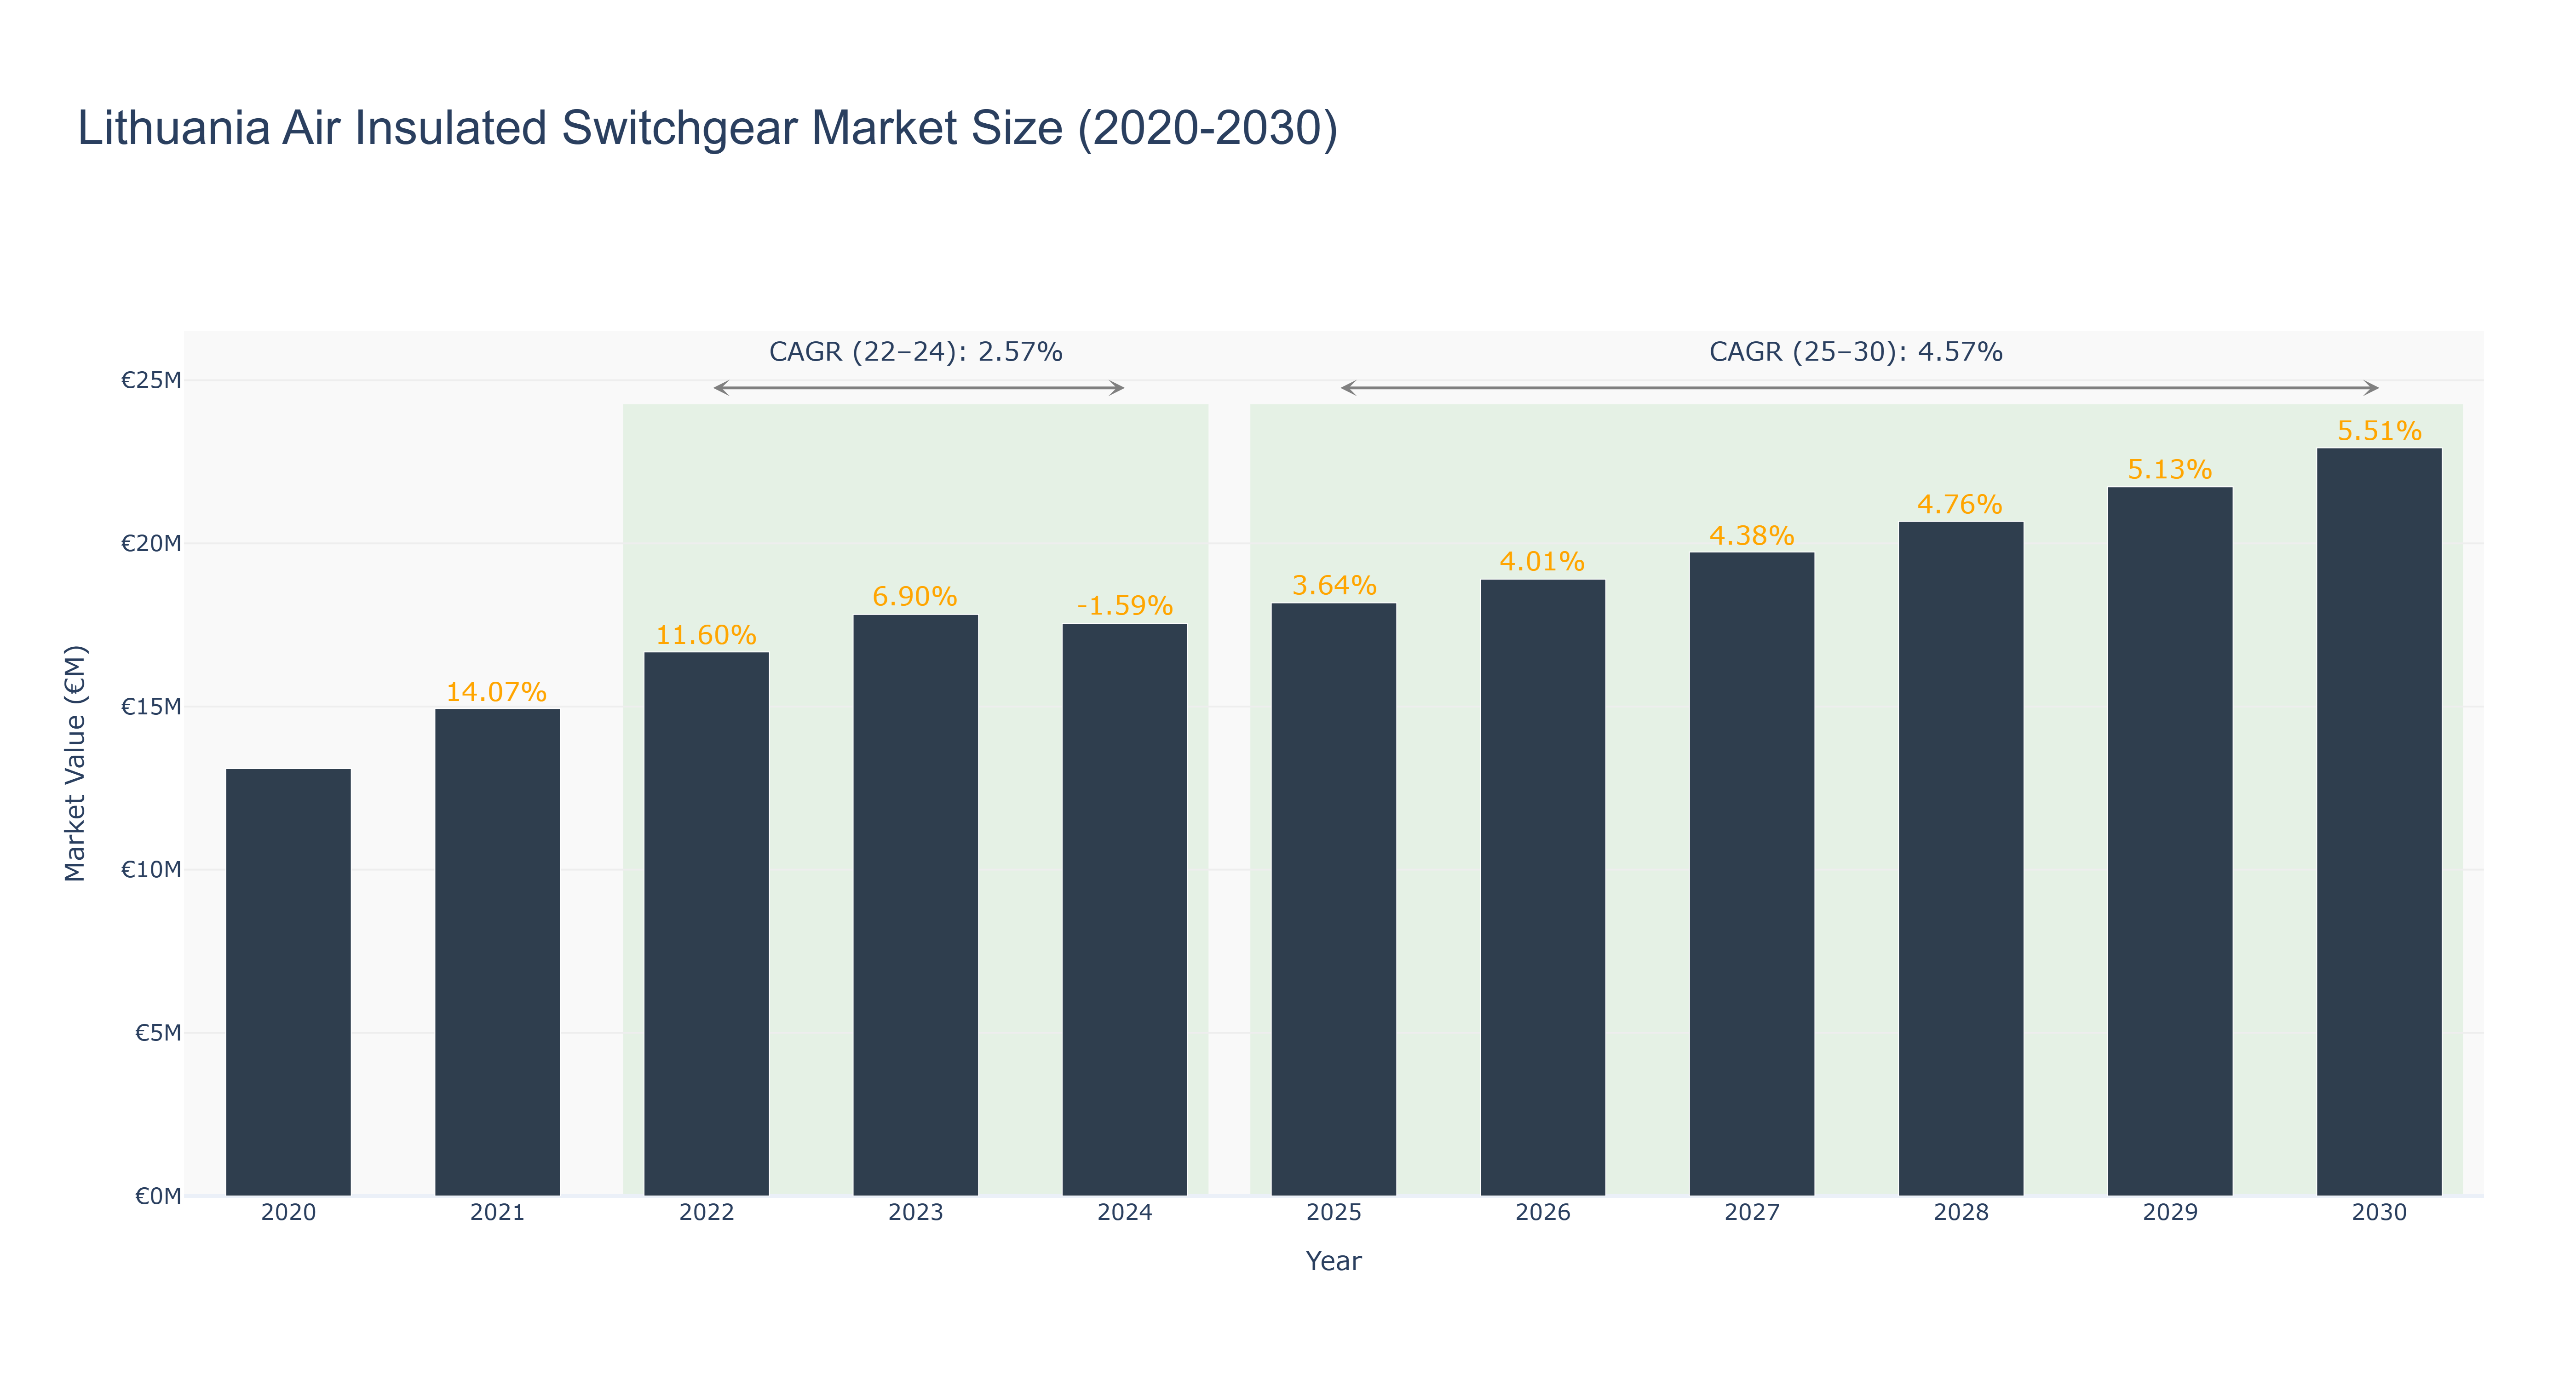
The Lithuania Air Insulated Switchgear Market experienced steady growth from 2020 to 2024, reaching a peak size of €17.82 million in 2023. However, a slight decline was observed in 2024 to €17.54 million due to market adjustments. Moving forward, the market is forecasted to continue its growth trajectory, with an estimated size of €22.93 million in 2030. The CAGR for the period 2022-24 is 2.57%, while for 2025-30, it is projected at 4.57%. The market's growth can be attributed to increasing demand for reliable power distribution solutions in Lithuania, driven by infrastructure development and industrial expansion. Looking ahead, upcoming projects in the country's energy sector, such as the implementation of smart grid technologies, are set to further boost the demand for air insulated switchgear systems.
Lithuania Air Insulated Switchgear Market: Production & Trade Performance (2019-2025)
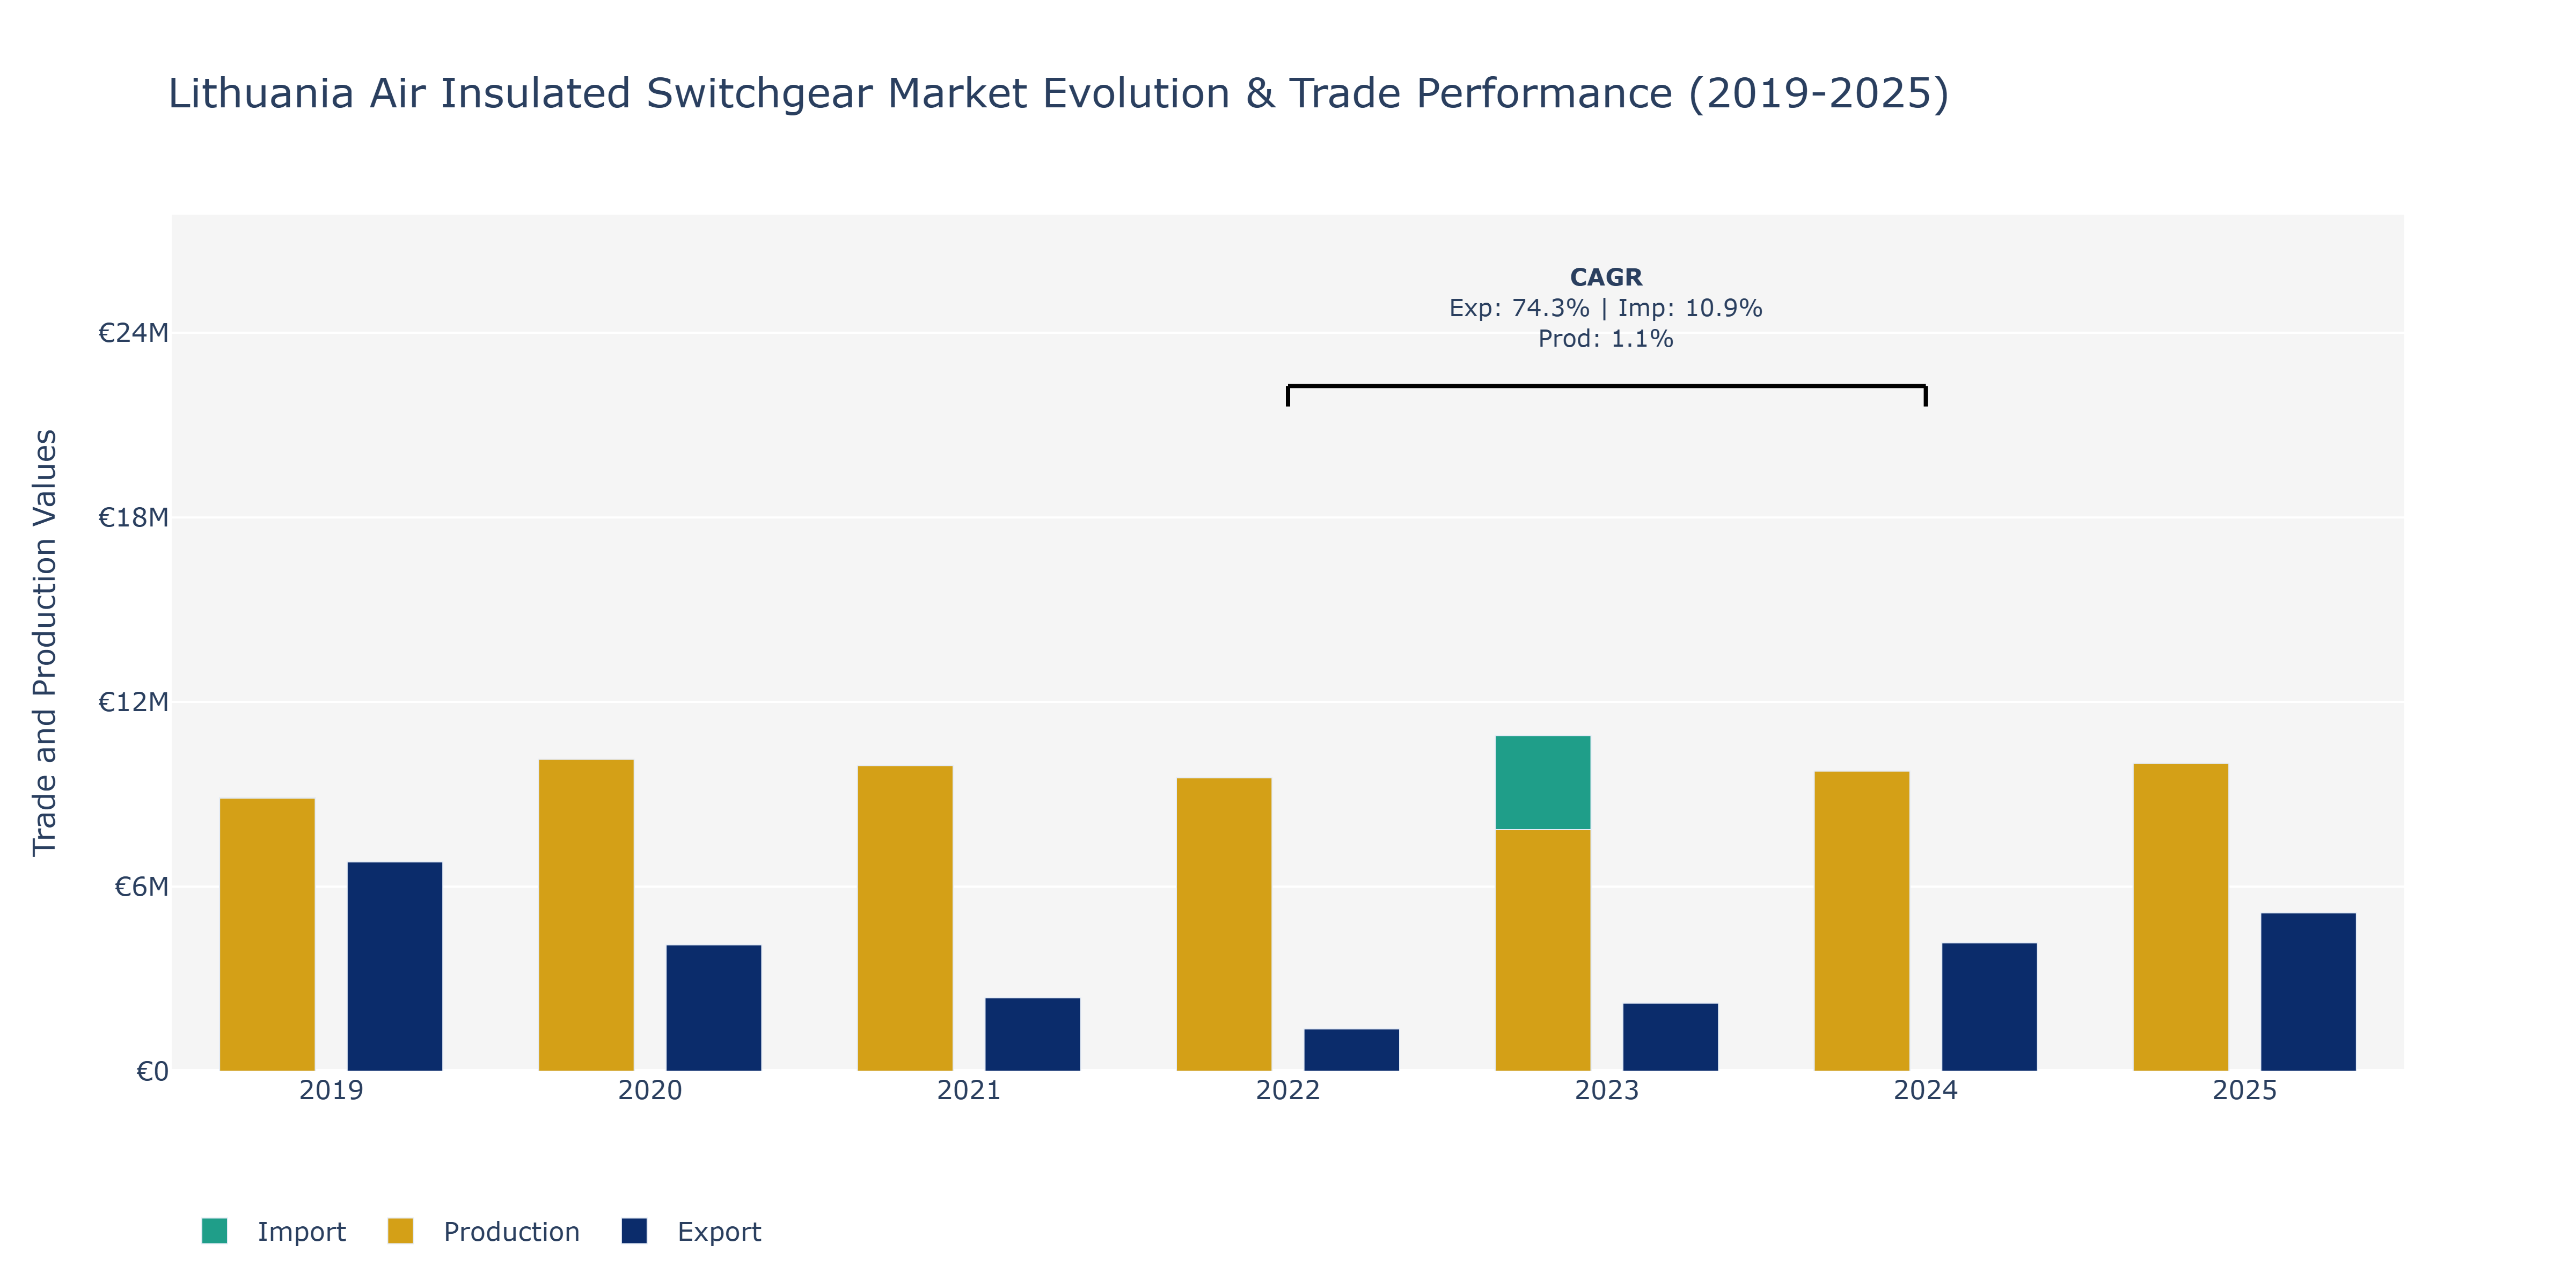
Between 2019 and 2025, Lithuania's Air Insulated Switchgear market witnessed varying trends in Exports, Imports, and Production. Exports experienced a notable decline from €6.81 million in 2019 to €2.38 million in 2021 before showing a gradual recovery to €5.15 million in 2025. In contrast, Imports fluctuated, reaching a peak of €10.91 million in 2023 before decreasing to €8.97 million in 2024. Production remained relatively stable, with a slight increase from €8.88 million in 2019 to €10.00 million in 2025. The fluctuations in exports and imports can be attributed to global economic conditions impacting demand and supply chains, along with domestic production capacity affecting the need for imports. The stability in production indicates the market's resilience and ability to meet local demand consistently. To sustain export growth, market players may focus on product innovation and expanding their international presence, aligning with Lithuania's strategic positioning as a manufacturing hub in the region.
Key Highlights of the Report:
- Lithuania Air Insulated Switchgear Market Outlook
- Market Size of Lithuania Air Insulated Switchgear Market, 2025
- Forecast of Lithuania Air Insulated Switchgear Market, 2032
- Historical Data and Forecast of Lithuania Air Insulated Switchgear Revenues & Volume for the Period 2022 - 2032F
- Lithuania Air Insulated Switchgear Market Trend Evolution
- Lithuania Air Insulated Switchgear Market Drivers and Challenges
- Lithuania Air Insulated Switchgear Price Trends
- Lithuania Air Insulated Switchgear Porter`s Five Forces
- Lithuania Air Insulated Switchgear Industry Life Cycle
- Historical Data and Forecast of Lithuania Air Insulated Switchgear Market Revenues & Volume By Voltage Range for the Period 2022 - 2032F
- Historical Data and Forecast of Lithuania Air Insulated Switchgear Market Revenues & Volume By 3 kV???36 kV for the Period 2022 - 2032F
- Historical Data and Forecast of Lithuania Air Insulated Switchgear Market Revenues & Volume By >36 kV for the Period 2022 - 2032F
- Historical Data and Forecast of Lithuania Air Insulated Switchgear Market Revenues & Volume By Installation for the Period 2022 - 2032F
- Historical Data and Forecast of Lithuania Air Insulated Switchgear Market Revenues & Volume By Indoor for the Period 2022 - 2032F
- Historical Data and Forecast of Lithuania Air Insulated Switchgear Market Revenues & Volume By Outdoor for the Period 2022 - 2032F
- Historical Data and Forecast of Lithuania Air Insulated Switchgear Market Revenues & Volume By Application for the Period 2022 - 2032F
- Historical Data and Forecast of Lithuania Air Insulated Switchgear Market Revenues & Volume By Transmission & Distribution for the Period 2022 - 2032F
- Historical Data and Forecast of Lithuania Air Insulated Switchgear Market Revenues & Volume By Manufacturing & Processing for the Period 2022 - 2032F
- Historical Data and Forecast of Lithuania Air Insulated Switchgear Market Revenues & Volume By Infrastructure & Transportation for the Period 2022 - 2032F
- Lithuania Air Insulated Switchgear Import Export Trade Statistics
- Market Opportunity Assessment By Voltage Range
- Market Opportunity Assessment By Installation
- Market Opportunity Assessment By Application
- Lithuania Air Insulated Switchgear Top Companies Market Share
- Lithuania Air Insulated Switchgear Competitive Benchmarking By Technical and Operational Parameters
- Lithuania Air Insulated Switchgear Company Profiles
- Lithuania Air Insulated Switchgear Key Strategic Recommendations
Frequently Asked Questions About the Market Study (FAQs):
6Wresearch actively monitors the Lithuania Air Insulated Switchgear Market and publishes its comprehensive annual report, highlighting emerging trends, growth drivers, revenue analysis, and forecast outlook. Our insights help businesses to make data-backed strategic decisions with ongoing market dynamics. Our analysts track relevent industries related to the Lithuania Air Insulated Switchgear Market, allowing our clients with actionable intelligence and reliable forecasts tailored to emerging regional needs.
Yes, we provide customisation as per your requirements. To learn more, feel free to contact us on sales@6wresearch.com
1 Executive Summary |
2 Introduction |
2.1 Key Highlights of the Report |
2.2 Report Description |
2.3 Market Scope & Segmentation |
2.4 Research Methodology |
2.5 Assumptions |
3 Lithuania Air Insulated Switchgear Market Overview |
3.1 Lithuania Country Macro Economic Indicators |
3.2 Lithuania Air Insulated Switchgear Market Revenues & Volume, 2022 & 2032F |
3.3 Lithuania Air Insulated Switchgear Market - Industry Life Cycle |
3.4 Lithuania Air Insulated Switchgear Market - Porter's Five Forces |
3.5 Lithuania Air Insulated Switchgear Market Revenues & Volume Share, By Voltage Range, 2022 & 2032F |
3.6 Lithuania Air Insulated Switchgear Market Revenues & Volume Share, By Installation, 2022 & 2032F |
3.7 Lithuania Air Insulated Switchgear Market Revenues & Volume Share, By Application, 2022 & 2032F |
4 Lithuania Air Insulated Switchgear Market Dynamics |
4.1 Impact Analysis |
4.2 Market Drivers |
4.2.1 Increasing demand for reliable and efficient power distribution infrastructure in Lithuania |
4.2.2 Growing focus on renewable energy sources driving the need for upgrades and expansion of electrical grids |
4.2.3 Technological advancements leading to the development of more efficient and compact air insulated switchgear solutions |
4.3 Market Restraints |
4.3.1 High initial investment costs associated with installing air insulated switchgear systems |
4.3.2 Regulatory challenges and compliance requirements in the energy sector affecting market growth |
4.3.3 Competition from alternative switchgear technologies such as gas insulated switchgear |
5 Lithuania Air Insulated Switchgear Market Trends |
6 Lithuania Air Insulated Switchgear Market Segmentations |
6.1 Lithuania Air Insulated Switchgear Market, By Voltage Range |
6.1.1 Overview and Analysis |
6.1.2 Lithuania Air Insulated Switchgear Market Revenues & Volume, By 3 kV? ??36 kV , 2022 - 2032F |
6.1.3 Lithuania Air Insulated Switchgear Market Revenues & Volume, By >36 kV, 2022 - 2032F |
6.2 Lithuania Air Insulated Switchgear Market, By Installation |
6.2.1 Overview and Analysis |
6.2.2 Lithuania Air Insulated Switchgear Market Revenues & Volume, By Indoor , 2022 - 2032F |
6.2.3 Lithuania Air Insulated Switchgear Market Revenues & Volume, By Outdoor, 2022 - 2032F |
6.3 Lithuania Air Insulated Switchgear Market, By Application |
6.3.1 Overview and Analysis |
6.3.2 Lithuania Air Insulated Switchgear Market Revenues & Volume, By Transmission & Distribution, 2022 - 2032F |
6.3.3 Lithuania Air Insulated Switchgear Market Revenues & Volume, By Manufacturing & Processing, 2022 - 2032F |
6.3.4 Lithuania Air Insulated Switchgear Market Revenues & Volume, By Infrastructure & Transportation, 2022 - 2032F |
7 Lithuania Air Insulated Switchgear Market Import-Export Trade Statistics |
7.1 Lithuania Air Insulated Switchgear Market Export to Major Countries |
7.2 Lithuania Air Insulated Switchgear Market Imports from Major Countries |
8 Lithuania Air Insulated Switchgear Market Key Performance Indicators |
8.1 Average age of existing switchgear infrastructure in Lithuania |
8.2 Number of new renewable energy projects being implemented in the country |
8.3 Adoption rate of smart grid technologies in Lithuania |
9 Lithuania Air Insulated Switchgear Market - Opportunity Assessment |
9.1 Lithuania Air Insulated Switchgear Market Opportunity Assessment, By Voltage Range, 2022 & 2032F |
9.2 Lithuania Air Insulated Switchgear Market Opportunity Assessment, By Installation, 2022 & 2032F |
9.3 Lithuania Air Insulated Switchgear Market Opportunity Assessment, By Application, 2022 & 2032F |
10 Lithuania Air Insulated Switchgear Market - Competitive Landscape |
10.1 Lithuania Air Insulated Switchgear Market Revenue Share, By Companies, 2025 |
10.2 Lithuania Air Insulated Switchgear Market Competitive Benchmarking, By Operating and Technical Parameters |
11 Company Profiles |
12 Recommendations | 13 Disclaimer |
Global Go To Market Strategy - 2030
Export potential enables firms to identify high-growth global markets with greater confidence by combining advanced trade intelligence with a structured quantitative methodology. The framework analyzes emerging demand trends and country-level import patterns while integrating macroeconomic and trade datasets such as GDP and population forecasts, bilateral import–export flows, tariff structures, elasticity differentials between developed and developing economies, geographic distance, and import demand projections. Using weighted trade values from 2020–2024 as the base period to project country-to-country export potential for 2030, these inputs are operationalized through calculated drivers such as gravity model parameters, tariff impact factors, and projected GDP per-capita growth. Through an analysis of hidden potentials, demand hotspots, and market conditions that are most favorable to success, this method enables firms to focus on target countries, maximize returns, and global expansion with data, backed by accuracy.
By factoring in the projected importer demand gap that is currently unmet and could be potential opportunity, it identifies the potential for the Exporter (Country) among 190 countries, against the general trade analysis, which identifies the biggest importer or exporter.
To discover high-growth global markets and optimize your business strategy:
Click Here
Pricing
- Single User License$ 1,995
- Department License$ 2,400
- Site License$ 3,120
- Global License$ 3,795

Leadership Perspectives from Industry Events
Search
Thought Leadership and Analyst Meet


Our Clients
6WResearch In News
- India Export Attractiveness Tracker 2026
- India Air Conditioner Market Set for Strong Rebound in 2026 After Weather-Led Correction and GST-Driven Recovery: 6Wresearch
- ADAS in India: How Automatic Emergency Braking, Blind Spot Detection & Driver Monitoring are Transforming Road Safety
- Doha a strategic location for EV manufacturing hub: IPA Qatar
- Demand for luxury TVs surging in the GCC, says Samsung
- Empowering Growth: The Thriving Journey of Bangladesh’s Cable Industry
Latest Reports
- Nicaragua RPG Gaming Market (2026-2032)
- New Zealand RPG Gaming Market (2026-2032)
- Netherlands RPG Gaming Market (2026-2032)
- Nauru RPG Gaming Market (2026-2032)
- Namibia RPG Gaming Market (2026-2032)
- Mozambique RPG Gaming Market (2026-2032)
- Montenegro RPG Gaming Market (2026-2032)
- Mongolia RPG Gaming Market (2026-2032)
- Monaco RPG Gaming Market (2026-2032)
- Micronesia RPG Gaming Market (2026-2032)
Industry Events and Analyst Meet

EV India Expo 2026

HIMTEX 2026

India Refining Summit 2026

India EV Show 2026

EV tech India Expo 2026
Whitepaper
- Middle East & Africa Commercial Security Market Click here to view more.
- Middle East & Africa Fire Safety Systems & Equipment Market Click here to view more.
- GCC Drone Market Click here to view more.
- Middle East Lighting Fixture Market Click here to view more.
- GCC Physical & Perimeter Security Market Click here to view more.