Lithuania Antiglare Glass Market (2026-2032) | Outlook, Strategic Insights, Strategy, Opportunities, Forecast, Investment Trends, Segments, Size, Drivers, Trends, Pricing Analysis, Analysis, Share, Value, Restraints, Challenges, Competition, Growth, Segmentation, Competitive, Industry, Consumer Insights, Supply, Demand, Companies, Revenue
Market Forecast By Type (Etched, Coated), By Application (Automotive, Electronics, Architectural), By End User (Construction, Consumer Electronics) And Competitive Landscape
| Product Code: ETC11392506 | Publication Date: Apr 2025 | Updated Date: Apr 2026 | Product Type: Market Research Report | |
| Publisher: 6Wresearch | Author: Bhawna Singh | No. of Pages: 65 | No. of Figures: 34 | No. of Tables: 19 |
Lithuania Antiglare Glass Market Size (2020-2030)
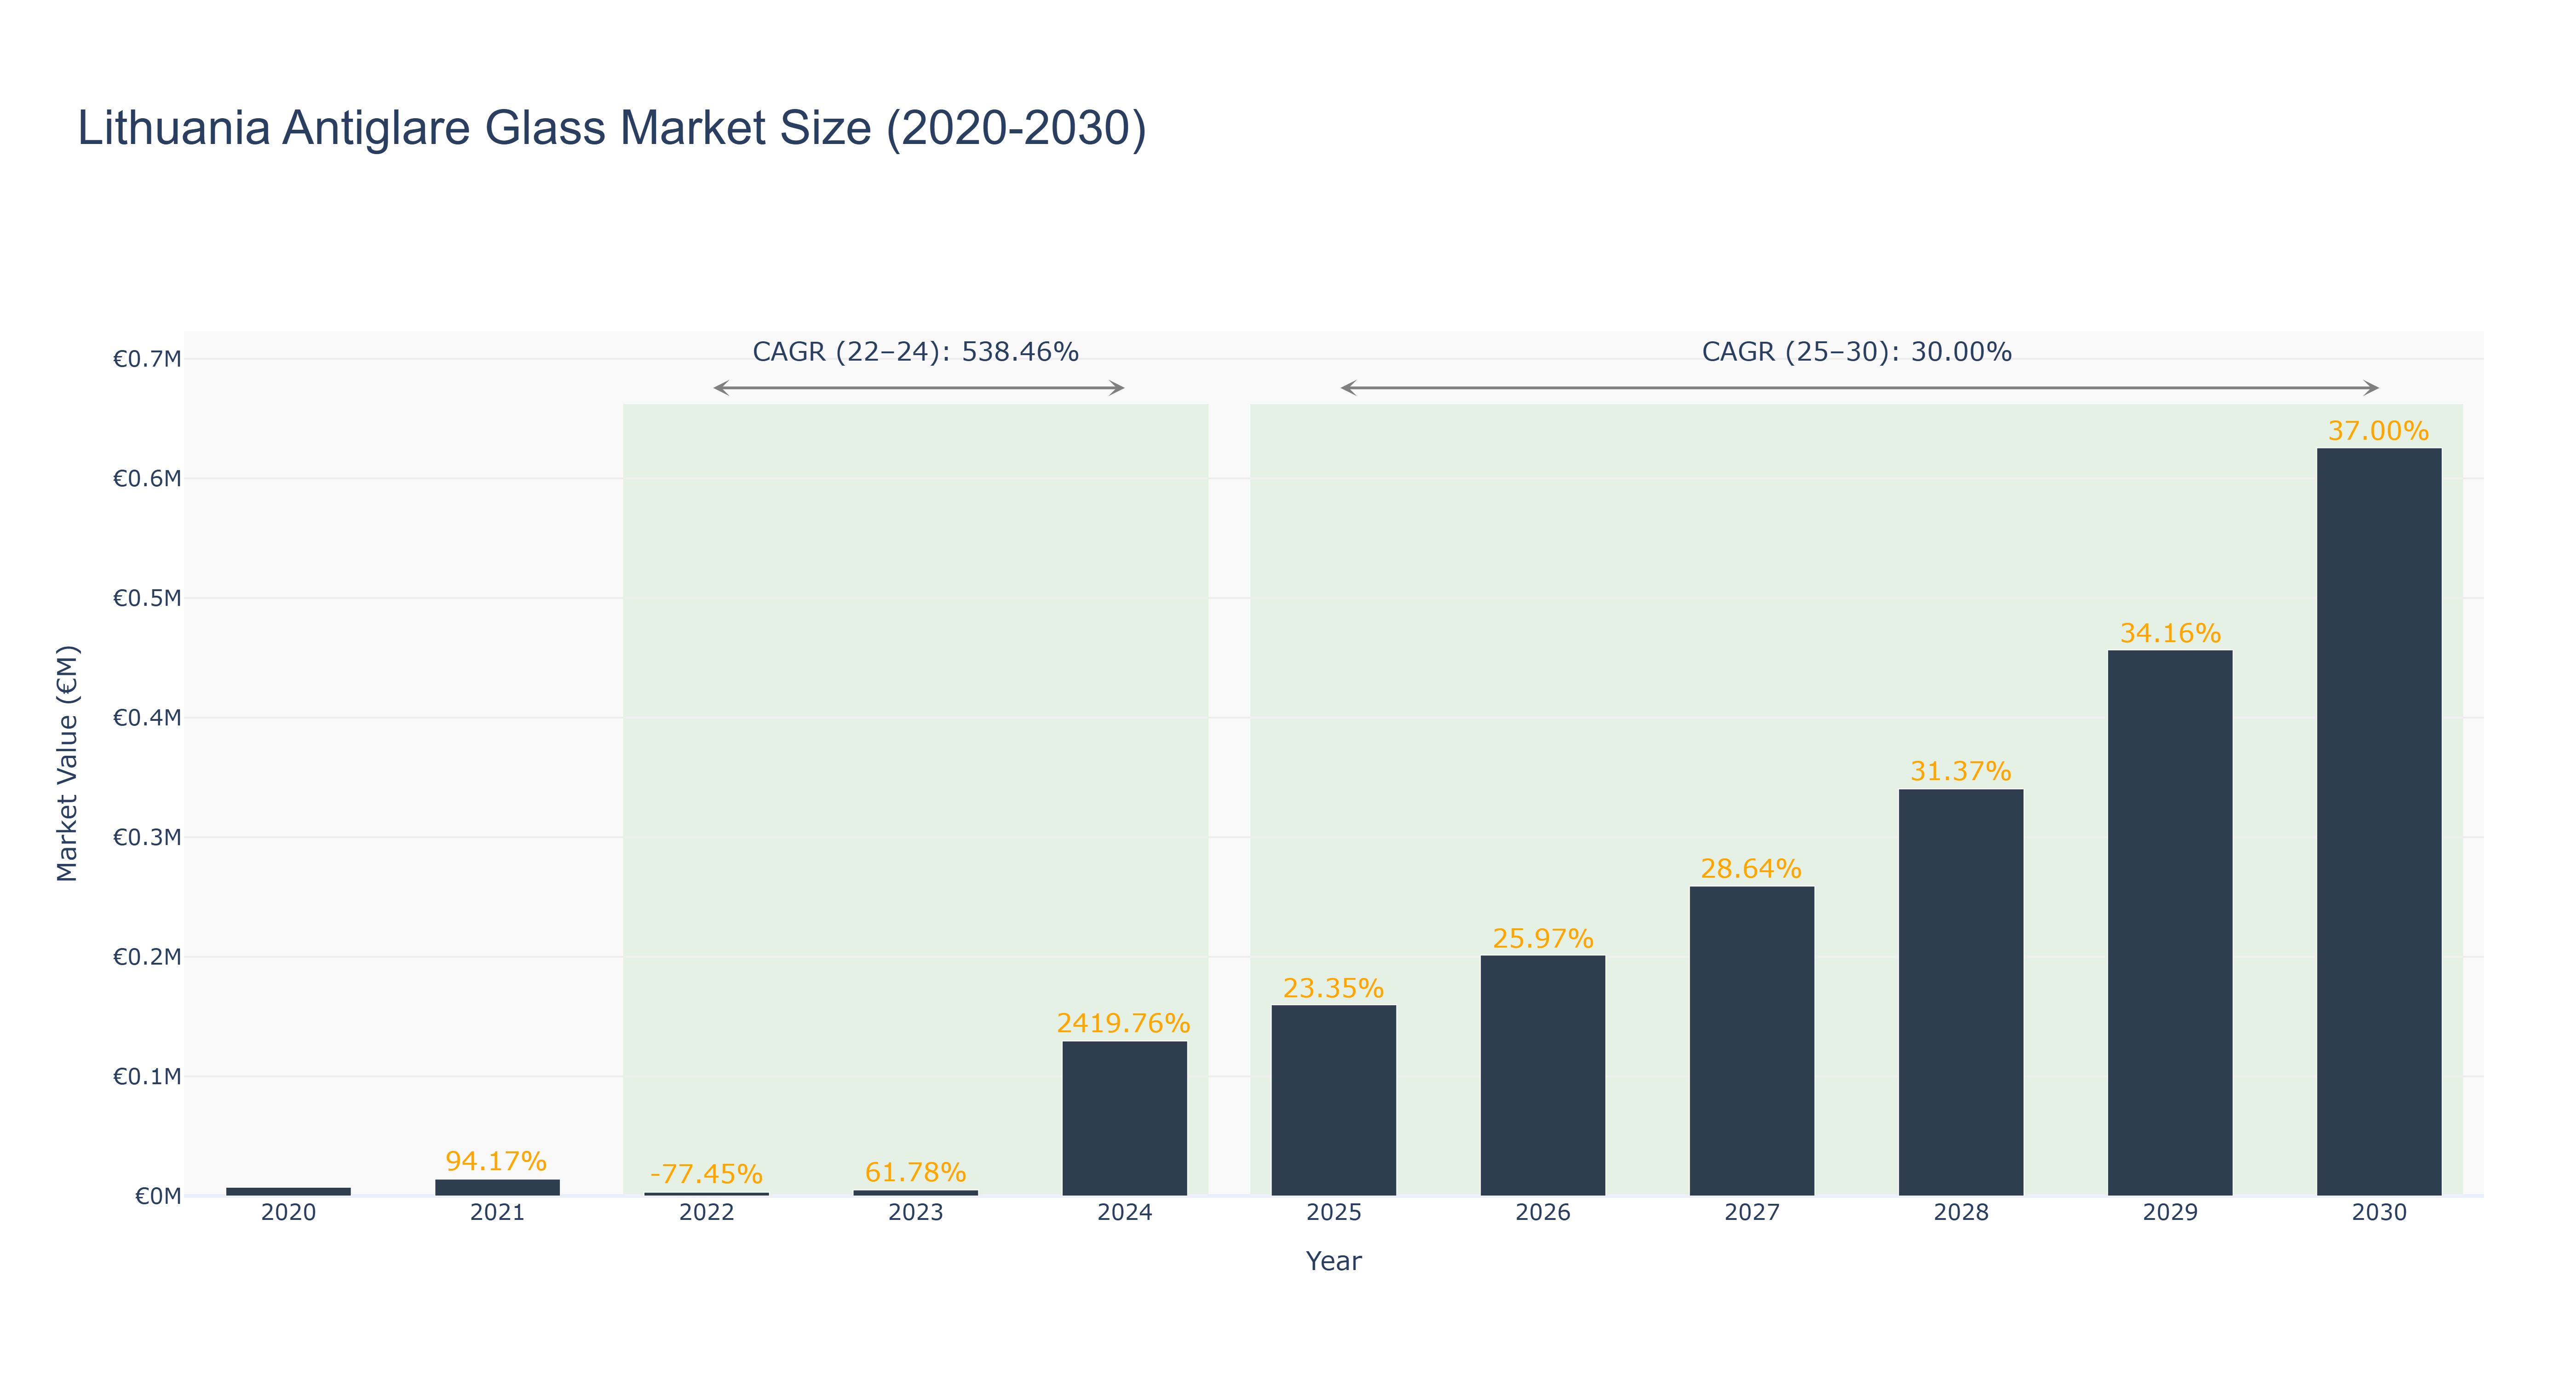
The Lithuania Antiglare Glass Market experienced a significant fluctuation in market size over the years. The market peaked in 2030 at €0.63 million, showing a steady growth trajectory. From 2020 to 2024, the market size remained relatively low, but a remarkable surge was observed in 2024, reaching €0.13 million due to a sudden spike in demand for antiglare glass products. The forecasted market size from 2025 to 2030 is projected to continue growing steadily, with a CAGR of 30.0%. This growth can be attributed to the increasing awareness and adoption of antiglare glass solutions in various industries. Looking ahead, Lithuania is planning to introduce new regulations promoting energy-efficient building materials, which is expected to further drive the demand for antiglare glass products in the market.
Lithuania Antiglare Glass Market: Production & Trade Performance (2019-2025)
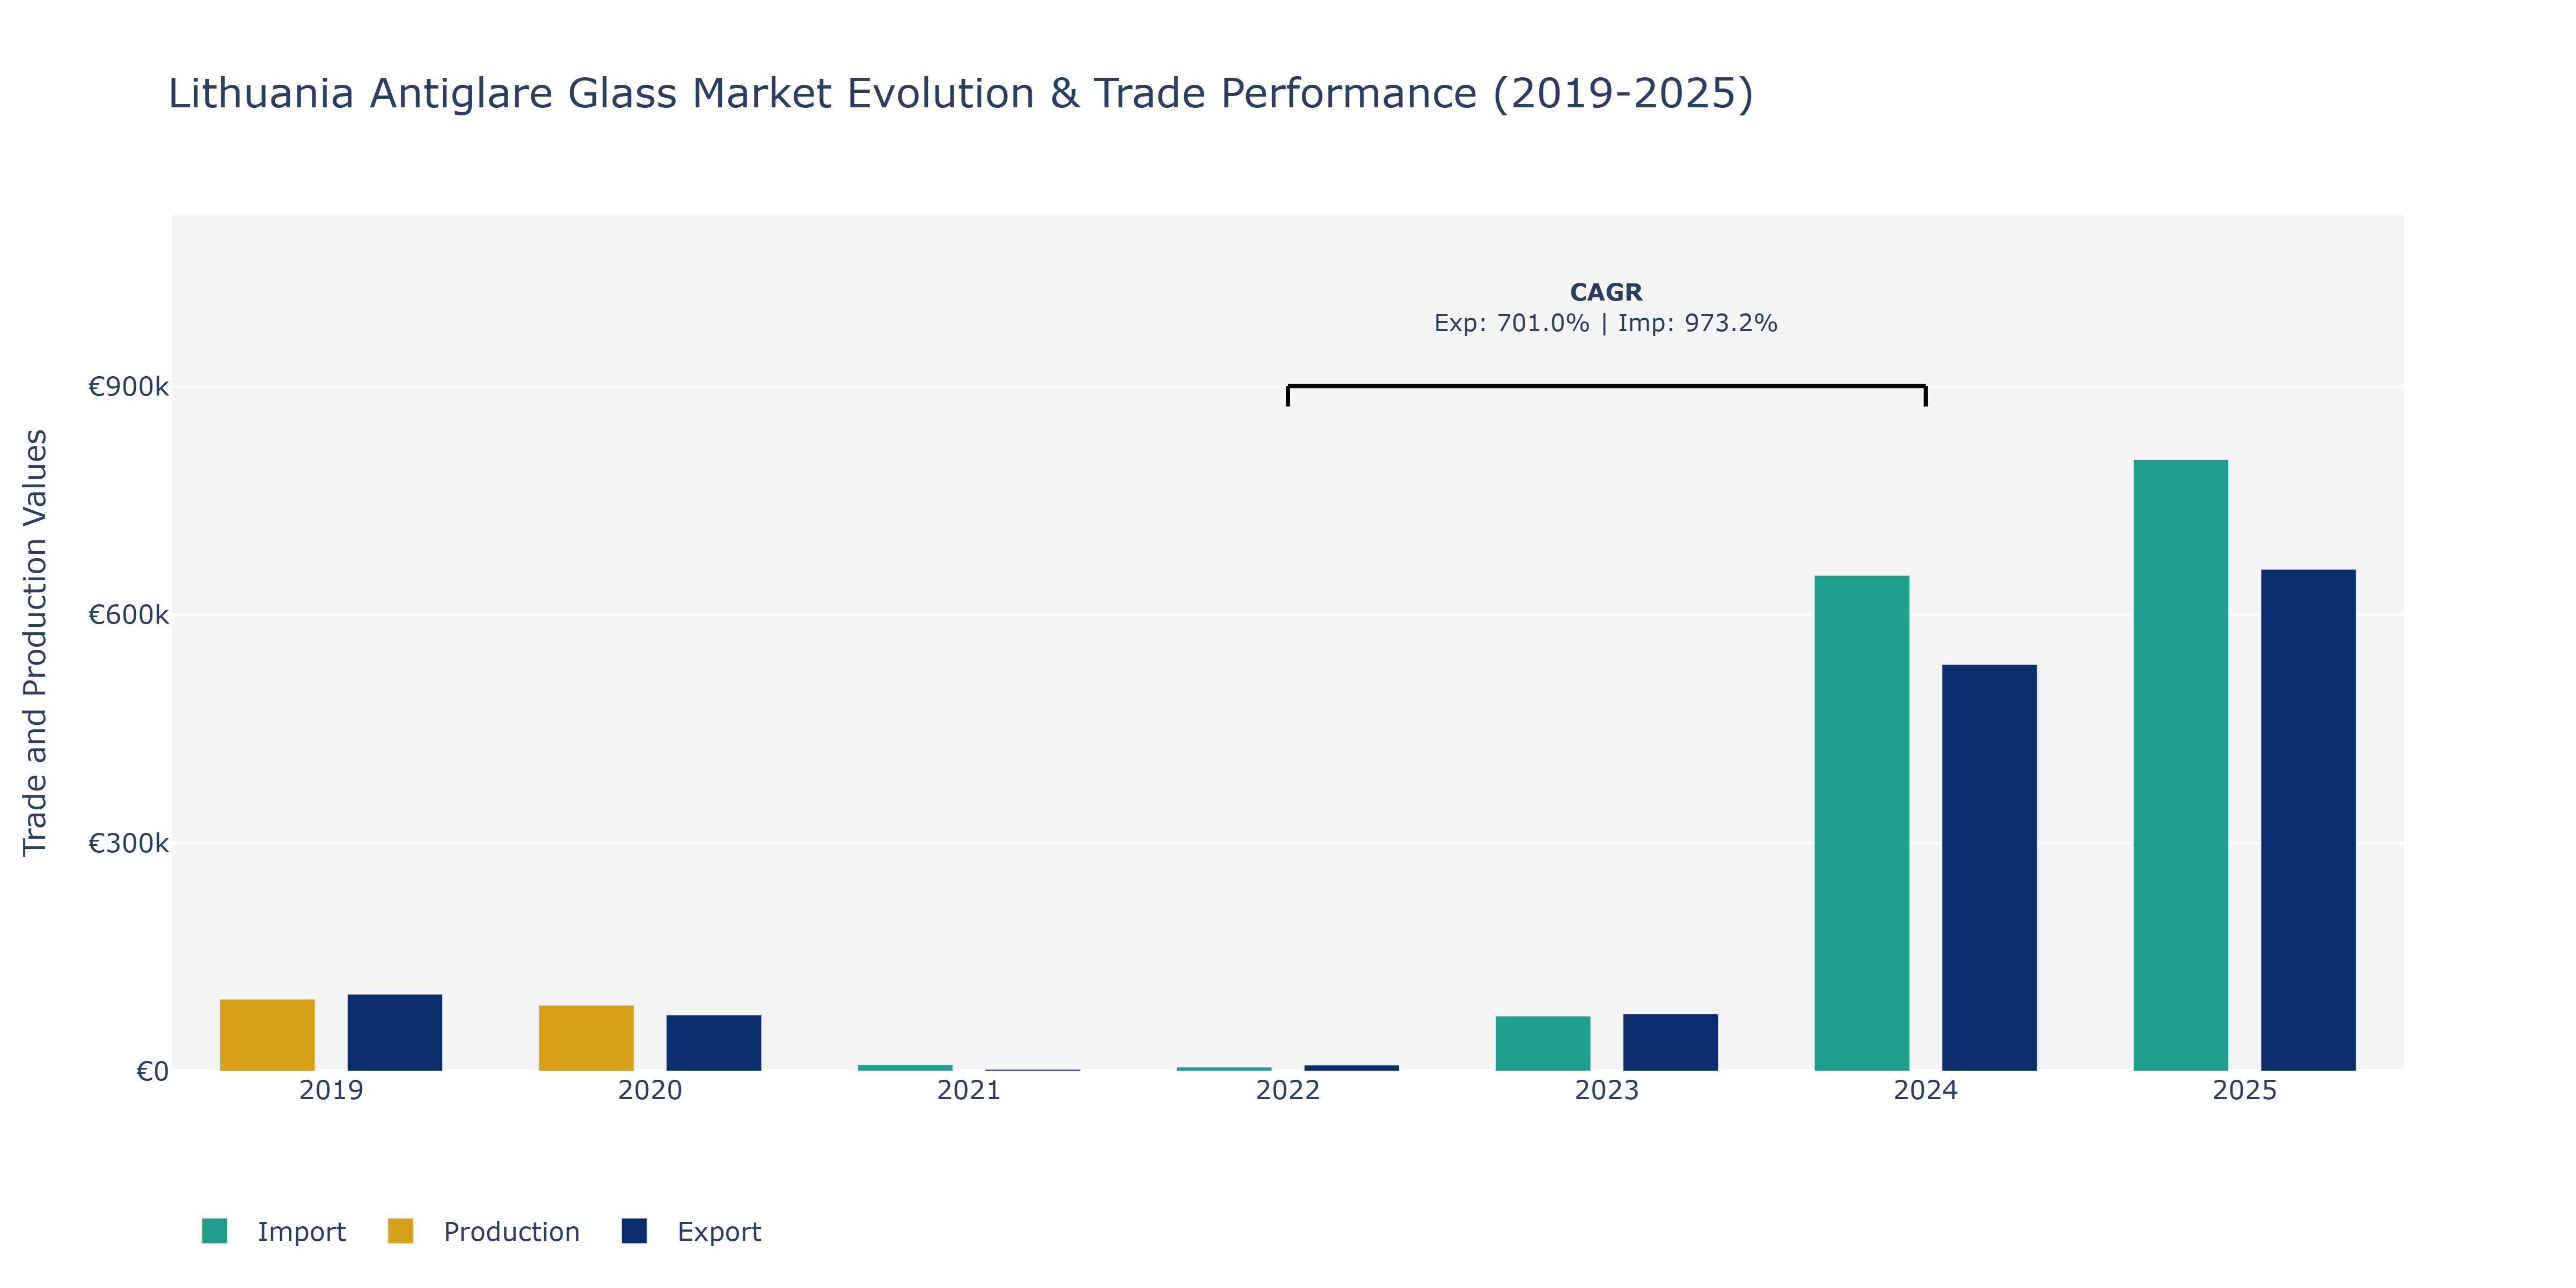
Between 2019 and 2025, the Lithuania Antiglare Glass Market saw dynamic shifts in Exports, Imports, and Production levels. Exports demonstrated a notable surge from €101.32 thousand in 2019 to a peak of €659.88 thousand in 2025, showcasing a substantial upward trend driven by increased global demand for antiglare glass products. Conversely, Imports fluctuated, starting at €600 thousand in 2019, reaching a high of €804.2 thousand in 2025, reflecting fluctuations in international trade dynamics and potentially varying domestic consumption patterns. Production value followed a declining trajectory from €94.83 thousand in 2019 to €86.97 thousand in 2020, before stabilizing over the subsequent years. These movements indicate a blend of domestic production capacity adjustments and international market positioning strategies within the antiglare glass sector. The spike in Exports aligns with the increasing adoption of antiglare glass in industries such as automotive, electronics, and construction, corroborated by industry reports highlighting the growing demand for antiglare solutions for safety and aesthetic purposes.
Key Highlights of the Report:
- Lithuania Antiglare Glass Market Outlook
- Market Size of Lithuania Antiglare Glass Market, 2025
- Forecast of Lithuania Antiglare Glass Market, 2032
- Historical Data and Forecast of Lithuania Antiglare Glass Revenues & Volume for the Period 2022 - 2032F
- Lithuania Antiglare Glass Market Trend Evolution
- Lithuania Antiglare Glass Market Drivers and Challenges
- Lithuania Antiglare Glass Price Trends
- Lithuania Antiglare Glass Porter's Five Forces
- Lithuania Antiglare Glass Industry Life Cycle
- Historical Data and Forecast of Lithuania Antiglare Glass Market Revenues & Volume By Type for the Period 2022 - 2032F
- Historical Data and Forecast of Lithuania Antiglare Glass Market Revenues & Volume By Etched for the Period 2022 - 2032F
- Historical Data and Forecast of Lithuania Antiglare Glass Market Revenues & Volume By Coated for the Period 2022 - 2032F
- Historical Data and Forecast of Lithuania Antiglare Glass Market Revenues & Volume By Application for the Period 2022 - 2032F
- Historical Data and Forecast of Lithuania Antiglare Glass Market Revenues & Volume By Automotive for the Period 2022 - 2032F
- Historical Data and Forecast of Lithuania Antiglare Glass Market Revenues & Volume By Electronics for the Period 2022 - 2032F
- Historical Data and Forecast of Lithuania Antiglare Glass Market Revenues & Volume By Architectural for the Period 2022 - 2032F
- Historical Data and Forecast of Lithuania Antiglare Glass Market Revenues & Volume By End User for the Period 2022 - 2032F
- Historical Data and Forecast of Lithuania Antiglare Glass Market Revenues & Volume By Construction for the Period 2022 - 2032F
- Historical Data and Forecast of Lithuania Antiglare Glass Market Revenues & Volume By Consumer Electronics for the Period 2022 - 2032F
- Lithuania Antiglare Glass Import Export Trade Statistics
- Market Opportunity Assessment By Type
- Market Opportunity Assessment By Application
- Market Opportunity Assessment By End User
- Lithuania Antiglare Glass Top Companies Market Share
- Lithuania Antiglare Glass Competitive Benchmarking By Technical and Operational Parameters
- Lithuania Antiglare Glass Company Profiles
- Lithuania Antiglare Glass Key Strategic Recommendations
Frequently Asked Questions About the Market Study (FAQs):
6Wresearch actively monitors the Lithuania Antiglare Glass Market and publishes its comprehensive annual report, highlighting emerging trends, growth drivers, revenue analysis, and forecast outlook. Our insights help businesses to make data-backed strategic decisions with ongoing market dynamics. Our analysts track relevent industries related to the Lithuania Antiglare Glass Market, allowing our clients with actionable intelligence and reliable forecasts tailored to emerging regional needs.
Yes, we provide customisation as per your requirements. To learn more, feel free to contact us on sales@6wresearch.com
1 Executive Summary |
2 Introduction |
2.1 Key Highlights of the Report |
2.2 Report Description |
2.3 Market Scope & Segmentation |
2.4 Research Methodology |
2.5 Assumptions |
3 Lithuania Antiglare Glass Market Overview |
3.1 Lithuania Country Macro Economic Indicators |
3.2 Lithuania Antiglare Glass Market Revenues & Volume, 2022 & 2032F |
3.3 Lithuania Antiglare Glass Market - Industry Life Cycle |
3.4 Lithuania Antiglare Glass Market - Porter's Five Forces |
3.5 Lithuania Antiglare Glass Market Revenues & Volume Share, By Type, 2022 & 2032F |
3.6 Lithuania Antiglare Glass Market Revenues & Volume Share, By Application, 2022 & 2032F |
3.7 Lithuania Antiglare Glass Market Revenues & Volume Share, By End User, 2022 & 2032F |
4 Lithuania Antiglare Glass Market Dynamics |
4.1 Impact Analysis |
4.2 Market Drivers |
4.2.1 Increasing demand for antiglare glass in construction and automotive industries |
4.2.2 Growing awareness about the benefits of antiglare glass in reducing glare and enhancing visibility |
4.2.3 Technological advancements leading to improved quality and performance of antiglare glass |
4.3 Market Restraints |
4.3.1 High manufacturing costs associated with antiglare glass production |
4.3.2 Fluctuating raw material prices impacting the overall production costs |
4.3.3 Intense competition from alternative anti-glare solutions such as coatings or films |
5 Lithuania Antiglare Glass Market Trends |
6 Lithuania Antiglare Glass Market, By Types |
6.1 Lithuania Antiglare Glass Market, By Type |
6.1.1 Overview and Analysis |
6.1.2 Lithuania Antiglare Glass Market Revenues & Volume, By Type, 2022 - 2032F |
6.1.3 Lithuania Antiglare Glass Market Revenues & Volume, By Etched, 2022 - 2032F |
6.1.4 Lithuania Antiglare Glass Market Revenues & Volume, By Coated, 2022 - 2032F |
6.2 Lithuania Antiglare Glass Market, By Application |
6.2.1 Overview and Analysis |
6.2.2 Lithuania Antiglare Glass Market Revenues & Volume, By Automotive, 2022 - 2032F |
6.2.3 Lithuania Antiglare Glass Market Revenues & Volume, By Electronics, 2022 - 2032F |
6.2.4 Lithuania Antiglare Glass Market Revenues & Volume, By Architectural, 2022 - 2032F |
6.3 Lithuania Antiglare Glass Market, By End User |
6.3.1 Overview and Analysis |
6.3.2 Lithuania Antiglare Glass Market Revenues & Volume, By Construction, 2022 - 2032F |
6.3.3 Lithuania Antiglare Glass Market Revenues & Volume, By Consumer Electronics, 2022 - 2032F |
7 Lithuania Antiglare Glass Market Import-Export Trade Statistics |
7.1 Lithuania Antiglare Glass Market Export to Major Countries |
7.2 Lithuania Antiglare Glass Market Imports from Major Countries |
8 Lithuania Antiglare Glass Market Key Performance Indicators |
8.1 Average selling price of antiglare glass products |
8.2 Rate of adoption of antiglare glass in new construction projects or vehicle designs |
8.3 Customer satisfaction levels with antiglare glass performance |
8.4 Number of patents or innovations in antiglare glass technology |
8.5 Environmental impact of antiglare glass production and recycling efforts |
9 Lithuania Antiglare Glass Market - Opportunity Assessment |
9.1 Lithuania Antiglare Glass Market Opportunity Assessment, By Type, 2022 & 2032F |
9.2 Lithuania Antiglare Glass Market Opportunity Assessment, By Application, 2022 & 2032F |
9.3 Lithuania Antiglare Glass Market Opportunity Assessment, By End User, 2022 & 2032F |
10 Lithuania Antiglare Glass Market - Competitive Landscape |
10.1 Lithuania Antiglare Glass Market Revenue Share, By Companies, 2025 |
10.2 Lithuania Antiglare Glass Market Competitive Benchmarking, By Operating and Technical Parameters |
11 Company Profiles |
12 Recommendations |
13 Disclaimer |
Export potential assessment - trade Analytics for 2030
Export potential enables firms to identify high-growth global markets with greater confidence by combining advanced trade intelligence with a structured quantitative methodology. The framework analyzes emerging demand trends and country-level import patterns while integrating macroeconomic and trade datasets such as GDP and population forecasts, bilateral import–export flows, tariff structures, elasticity differentials between developed and developing economies, geographic distance, and import demand projections. Using weighted trade values from 2020–2024 as the base period to project country-to-country export potential for 2030, these inputs are operationalized through calculated drivers such as gravity model parameters, tariff impact factors, and projected GDP per-capita growth. Through an analysis of hidden potentials, demand hotspots, and market conditions that are most favorable to success, this method enables firms to focus on target countries, maximize returns, and global expansion with data, backed by accuracy.
By factoring in the projected importer demand gap that is currently unmet and could be potential opportunity, it identifies the potential for the Exporter (Country) among 190 countries, against the general trade analysis, which identifies the biggest importer or exporter.
To discover high-growth global markets and optimize your business strategy:
Click Here
Pricing
- Single User License$ 1,995
- Department License$ 2,400
- Site License$ 3,120
- Global License$ 3,795

Search
Thought Leadership and Analyst Meet


Our Clients
Latest Reports
- India Ultrasonic Smart Water Meter Market (2026-2032) | Outlook, Competition, Drivers, Trends, Demand, Competitive, Strategic Insights, Companies, Challenges, Strategy, Consumer Insights, Analysis, Opportunities, Growth, Size, Share, Industry, Revenue, Segments, Value, Segmentation, Supply, Forecast, Restraints,
- India Electromagnetic Bulk Flow Meter Market (2026-2032) | Analysis, Challenges, Strategic Insights, Supply, Forecast, Growth, Share, Consumer Insights, Competitive, Value, Outlook, Size & Demand,
- India Battery Powered Bulk Flow Meter Market (2026-2032) | Outlook, Analysis, Competitive Landscape, Growth, Size, Trends, Value, Revenue, Companies, Segmentation, Share & Forecast
- Bosnia and Herzegovina Fuel-Efficient Winglets Market (2026-2032) | Growth, Competition, Strategy, Restraints, Trends, Challenges, segmentation, Value, Outlook, Investment Opportunities, Analysis, Revenue, Companies, Insights, Pricing, Size, Drivers, Demand, Share, Forecast
- Canada Cloud CFD Market (2026-2032) | Size & Revenue, Industry, Growth, Competitive Landscape, Forecast, Segmentation, Value, Outlook, Trends, Share, Analysis, Companies
- Taiwan Food Delivery Platform Market (2026-2032) | Companies, Outlook, Analysis, Trends, Value, Revenue, Segmentation, Share, Forecast, Competitive Landscape, Growth, Size & Forecast
- United Kingdom (UK) Long-term Care Insurance Market (2026-2032) | Growth, Share, Consumer Insights, Drivers, Opportunities, Competition, Pricing Analysis, Segments, Restraints, Companies, Competitive, Value, Outlook, Size, Demand, Analysis, Challenges, Strategic Insights, Investment Trends, Revenue, Trends, Supply, Forecast
- United Kingdom (UK) Long Term Care Market (2026-2032) | Companies, Outlook, Analysis, Trends, Value, Revenue, Segmentation, Share, Forecast, Competitive Landscape, Growth, Size & Forecast
- Iraq Insulation and Waterproofing Market (2026-2032) | Outlook, Drivers, Growth, Size, Share, Industry, Revenue, Trends, Demand, Competitive, Strategic Insights, Opportunities, Segments, Companies, Challenges, Strategy, Consumer Insights, Analysis, Investment Trends, Value, Segmentation, Forecast, Restraints
- India Switchgear Market Outlook (2026-2032) | Size, Share, Trends, Growth, Revenue, Forecast, Analysis, Value, Outlook
Industry Events and Analyst Meet

HIMTEX 2026

India Refining Summit 2026

India EV Show 2026

EV tech India Expo 2026

Auto Tech Asia 2026
Whitepaper
- Middle East & Africa Commercial Security Market Click here to view more.
- Middle East & Africa Fire Safety Systems & Equipment Market Click here to view more.
- GCC Drone Market Click here to view more.
- Middle East Lighting Fixture Market Click here to view more.
- GCC Physical & Perimeter Security Market Click here to view more.
6WResearch In News
- Doha a strategic location for EV manufacturing hub: IPA Qatar
- Demand for luxury TVs surging in the GCC, says Samsung
- Empowering Growth: The Thriving Journey of Bangladesh’s Cable Industry
- Demand for luxury TVs surging in the GCC, says Samsung
- Video call with a traditional healer? Once unthinkable, it’s now common in South Africa
- Intelligent Buildings To Smooth GCC’s Path To Net Zero