Lithuania Artificial Limbs Market (2026-2032) | Segmentation, Analysis, Trends, Outlook, Value, Competitive Landscape, Forecast, Companies, Industry, Size & Revenue, Growth, Share
Market Forecast By Type (Lower Extremity, Upper Extremity, Compression Therapy), By Technology (Body Powered or Cable Operated, Cosmetic Prosthetics, Myoelectric or Electrically powered, Others), By Material (Titanium, Plastics, Others), By End User (Hospitals, Orthopaedic Clinics, Ambulatory Surgical Centres, Rehabilitation Centres, Prosthetic Clinics) And Competitive Landscape
| Product Code: ETC8034535 | Publication Date: Sep 2024 | Updated Date: Apr 2026 | Product Type: Market Research Report | |
| Publisher: 6Wresearch | Author: Vasudha | No. of Pages: 75 | No. of Figures: 35 | No. of Tables: 20 |
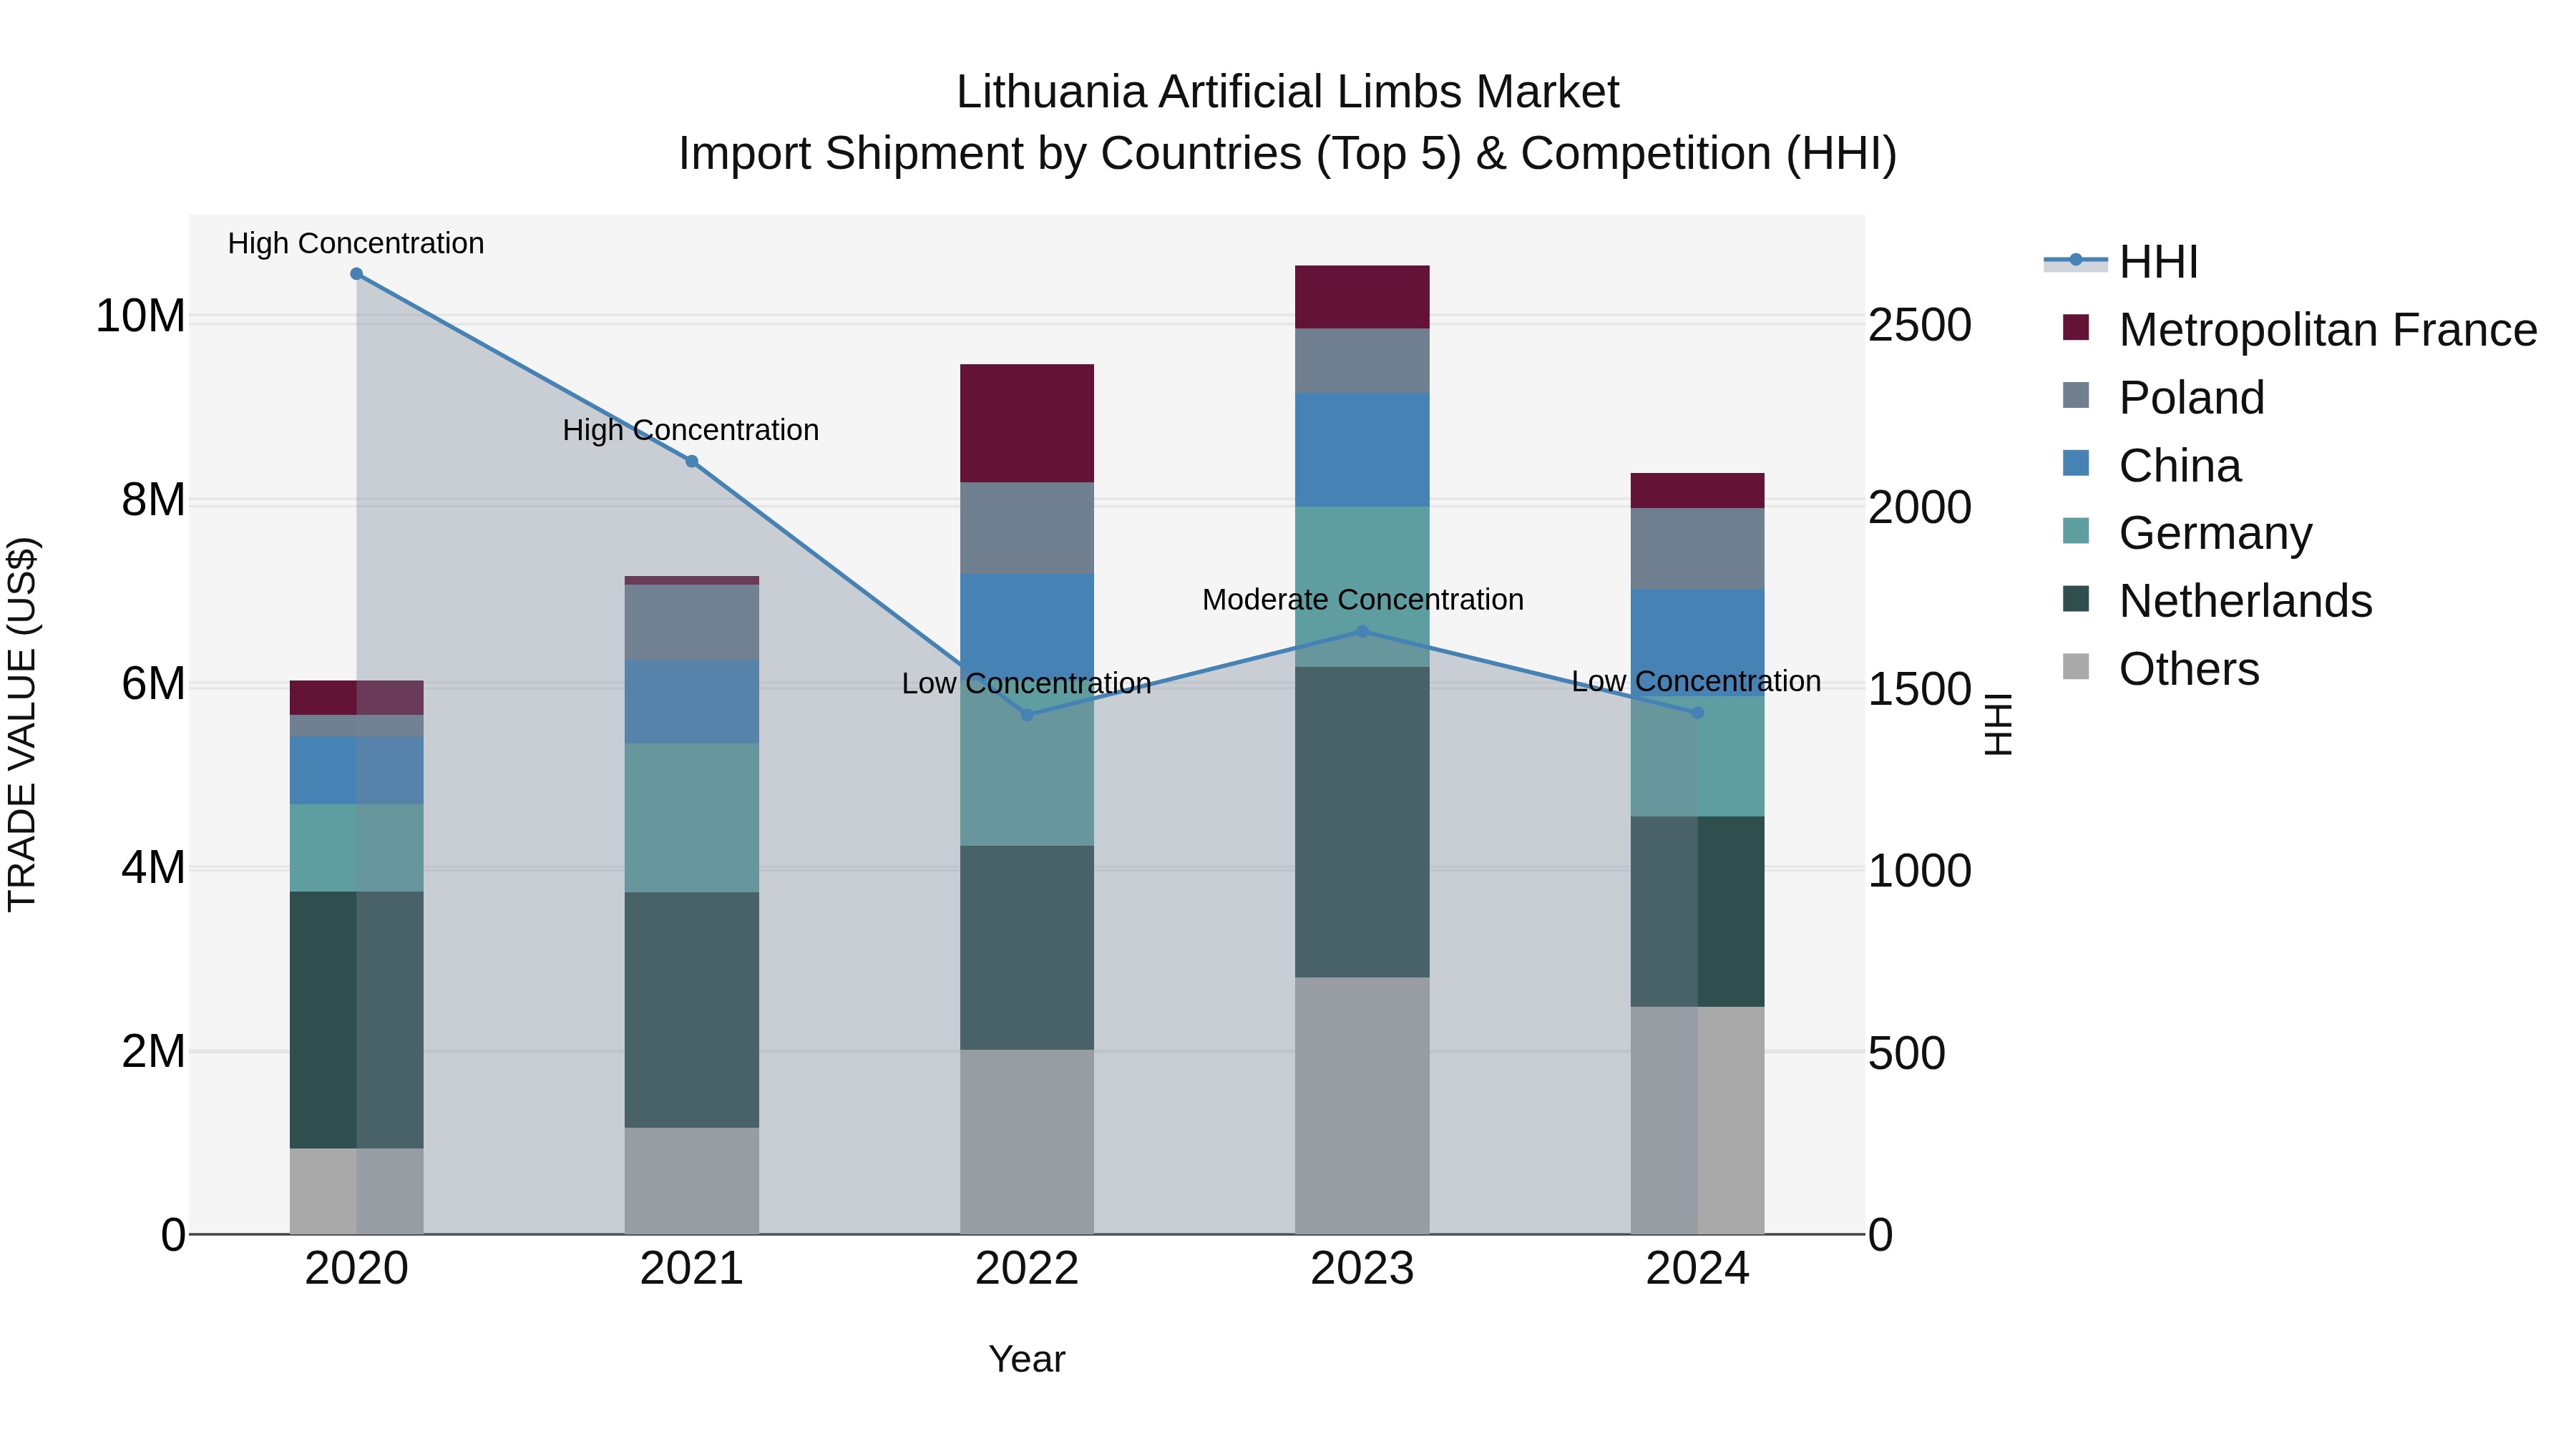
Lithuania Artificial Limbs Market Top 5 Importing Countries and Market Competition (HHI) Analysis
The Lithuania artificial limbs import market saw a shift in concentration levels from moderate to low in 2024, indicating increased diversification among top exporting countries. The top exporters to Lithuania in 2024 were the Netherlands, Germany, China, Ireland, and Poland. Despite a slight decline in growth rate from 2023 to 2024, the compound annual growth rate (CAGR) from 2020 to 2024 remained strong at 8.27%. This suggests a steady demand for artificial limbs in Lithuania, with potential for continued growth and market expansion in the coming years.
Key Highlights of the Report:
- Lithuania Artificial Limbs Market Outlook
- Market Size of Lithuania Artificial Limbs Market, 2025
- Forecast of Lithuania Artificial Limbs Market, 2032
- Historical Data and Forecast of Lithuania Artificial Limbs Revenues & Volume for the Period 2022 - 2032
- Lithuania Artificial Limbs Market Trend Evolution
- Lithuania Artificial Limbs Market Drivers and Challenges
- Lithuania Artificial Limbs Price Trends
- Lithuania Artificial Limbs Porter's Five Forces
- Lithuania Artificial Limbs Industry Life Cycle
- Historical Data and Forecast of Lithuania Artificial Limbs Market Revenues & Volume By Type for the Period 2022 - 2032
- Historical Data and Forecast of Lithuania Artificial Limbs Market Revenues & Volume By Lower Extremity for the Period 2022 - 2032
- Historical Data and Forecast of Lithuania Artificial Limbs Market Revenues & Volume By Upper Extremity for the Period 2022 - 2032
- Historical Data and Forecast of Lithuania Artificial Limbs Market Revenues & Volume By Compression Therapy for the Period 2022 - 2032
- Historical Data and Forecast of Lithuania Artificial Limbs Market Revenues & Volume By Technology for the Period 2022 - 2032
- Historical Data and Forecast of Lithuania Artificial Limbs Market Revenues & Volume By Body Powered or Cable Operated for the Period 2022 - 2032
- Historical Data and Forecast of Lithuania Artificial Limbs Market Revenues & Volume By Cosmetic Prosthetics for the Period 2022 - 2032
- Historical Data and Forecast of Lithuania Artificial Limbs Market Revenues & Volume By Myoelectric or Electrically powered for the Period 2022 - 2032
- Historical Data and Forecast of Lithuania Artificial Limbs Market Revenues & Volume By Others for the Period 2022 - 2032
- Historical Data and Forecast of Lithuania Artificial Limbs Market Revenues & Volume By Material for the Period 2022 - 2032
- Historical Data and Forecast of Lithuania Artificial Limbs Market Revenues & Volume By Titanium for the Period 2022 - 2032
- Historical Data and Forecast of Lithuania Artificial Limbs Market Revenues & Volume By Plastics for the Period 2022 - 2032
- Historical Data and Forecast of Lithuania Artificial Limbs Market Revenues & Volume By Others for the Period 2022 - 2032
- Historical Data and Forecast of Lithuania Artificial Limbs Market Revenues & Volume By End User for the Period 2022 - 2032
- Historical Data and Forecast of Lithuania Artificial Limbs Market Revenues & Volume By Hospitals for the Period 2022 - 2032
- Historical Data and Forecast of Lithuania Artificial Limbs Market Revenues & Volume By Orthopaedic Clinics for the Period 2022 - 2032
- Historical Data and Forecast of Lithuania Artificial Limbs Market Revenues & Volume By Ambulatory Surgical Centres for the Period 2022 - 2032
- Historical Data and Forecast of Lithuania Artificial Limbs Market Revenues & Volume By Rehabilitation Centres for the Period 2022 - 2032
- Historical Data and Forecast of Lithuania Artificial Limbs Market Revenues & Volume By Prosthetic Clinics for the Period 2022 - 2032
- Lithuania Artificial Limbs Import Export Trade Statistics
- Market Opportunity Assessment By Type
- Market Opportunity Assessment By Technology
- Market Opportunity Assessment By Material
- Market Opportunity Assessment By End User
- Lithuania Artificial Limbs Top Companies Market Share
- Lithuania Artificial Limbs Competitive Benchmarking By Technical and Operational Parameters
- Lithuania Artificial Limbs Company Profiles
- Lithuania Artificial Limbs Key Strategic Recommendations
Frequently Asked Questions About the Market Study (FAQs):
6Wresearch actively monitors the Lithuania Artificial Limbs Market and publishes its comprehensive annual report, highlighting emerging trends, growth drivers, revenue analysis, and forecast outlook. Our insights help businesses to make data-backed strategic decisions with ongoing market dynamics. Our analysts track relevent industries related to the Lithuania Artificial Limbs Market, allowing our clients with actionable intelligence and reliable forecasts tailored to emerging regional needs.
Yes, we provide customisation as per your requirements. To learn more, feel free to contact us on sales@6wresearch.com
1 Executive Summary |
2 Introduction |
2.1 Key Highlights of the Report |
2.2 Report Description |
2.3 Market Scope & Segmentation |
2.4 Research Methodology |
2.5 Assumptions |
3 Lithuania Artificial Limbs Market Overview |
3.1 Lithuania Country Macro Economic Indicators |
3.2 Lithuania Artificial Limbs Market Revenues & Volume, 2022 & 2032F |
3.3 Lithuania Artificial Limbs Market - Industry Life Cycle |
3.4 Lithuania Artificial Limbs Market - Porter's Five Forces |
3.5 Lithuania Artificial Limbs Market Revenues & Volume Share, By Type, 2022 & 2032F |
3.6 Lithuania Artificial Limbs Market Revenues & Volume Share, By Technology, 2022 & 2032F |
3.7 Lithuania Artificial Limbs Market Revenues & Volume Share, By Material, 2022 & 2032F |
3.8 Lithuania Artificial Limbs Market Revenues & Volume Share, By End User, 2022 & 2032F |
4 Lithuania Artificial Limbs Market Dynamics |
4.1 Impact Analysis |
4.2 Market Drivers |
4.2.1 Increasing prevalence of limb disabilities and amputations |
4.2.2 Technological advancements in prosthetics and orthotics |
4.2.3 Growing geriatric population in Lithuania |
4.2.4 Rising awareness about the benefits of artificial limbs |
4.2.5 Supportive government initiatives for healthcare and rehabilitation services |
4.3 Market Restraints |
4.3.1 High cost associated with advanced artificial limbs |
4.3.2 Limited reimbursement policies for prosthetic devices |
4.3.3 Lack of skilled professionals in the field of prosthetics and orthotics |
4.3.4 Social stigma and lack of acceptance towards artificial limbs in some communities |
4.3.5 Regulatory challenges and quality control issues in the manufacturing process |
5 Lithuania Artificial Limbs Market Trends |
6 Lithuania Artificial Limbs Market, By Types |
6.1 Lithuania Artificial Limbs Market, By Type |
6.1.1 Overview and Analysis |
6.1.2 Lithuania Artificial Limbs Market Revenues & Volume, By Type, 2022 - 2032F |
6.1.3 Lithuania Artificial Limbs Market Revenues & Volume, By Lower Extremity, 2022 - 2032F |
6.1.4 Lithuania Artificial Limbs Market Revenues & Volume, By Upper Extremity, 2022 - 2032F |
6.1.5 Lithuania Artificial Limbs Market Revenues & Volume, By Compression Therapy, 2022 - 2032F |
6.2 Lithuania Artificial Limbs Market, By Technology |
6.2.1 Overview and Analysis |
6.2.2 Lithuania Artificial Limbs Market Revenues & Volume, By Body Powered or Cable Operated, 2022 - 2032F |
6.2.3 Lithuania Artificial Limbs Market Revenues & Volume, By Cosmetic Prosthetics, 2022 - 2032F |
6.2.4 Lithuania Artificial Limbs Market Revenues & Volume, By Myoelectric or Electrically powered, 2022 - 2032F |
6.2.5 Lithuania Artificial Limbs Market Revenues & Volume, By Others, 2022 - 2032F |
6.3 Lithuania Artificial Limbs Market, By Material |
6.3.1 Overview and Analysis |
6.3.2 Lithuania Artificial Limbs Market Revenues & Volume, By Titanium, 2022 - 2032F |
6.3.3 Lithuania Artificial Limbs Market Revenues & Volume, By Plastics, 2022 - 2032F |
6.3.4 Lithuania Artificial Limbs Market Revenues & Volume, By Others, 2022 - 2032F |
6.4 Lithuania Artificial Limbs Market, By End User |
6.4.1 Overview and Analysis |
6.4.2 Lithuania Artificial Limbs Market Revenues & Volume, By Hospitals, 2022 - 2032F |
6.4.3 Lithuania Artificial Limbs Market Revenues & Volume, By Orthopaedic Clinics, 2022 - 2032F |
6.4.4 Lithuania Artificial Limbs Market Revenues & Volume, By Ambulatory Surgical Centres, 2022 - 2032F |
6.4.5 Lithuania Artificial Limbs Market Revenues & Volume, By Rehabilitation Centres, 2022 - 2032F |
6.4.6 Lithuania Artificial Limbs Market Revenues & Volume, By Prosthetic Clinics, 2022 - 2032F |
7 Lithuania Artificial Limbs Market Import-Export Trade Statistics |
7.1 Lithuania Artificial Limbs Market Export to Major Countries |
7.2 Lithuania Artificial Limbs Market Imports from Major Countries |
8 Lithuania Artificial Limbs Market Key Performance Indicators |
8.1 Average waiting time for receiving artificial limbs |
8.2 Patient satisfaction rate with the functionality of artificial limbs |
8.3 Number of research and development initiatives in the field of prosthetics and orthotics |
8.4 Percentage of population covered under health insurance for prosthetic devices |
8.5 Rate of adoption of innovative technologies in artificial limbs industry |
9 Lithuania Artificial Limbs Market - Opportunity Assessment |
9.1 Lithuania Artificial Limbs Market Opportunity Assessment, By Type, 2022 & 2032F |
9.2 Lithuania Artificial Limbs Market Opportunity Assessment, By Technology, 2022 & 2032F |
9.3 Lithuania Artificial Limbs Market Opportunity Assessment, By Material, 2022 & 2032F |
9.4 Lithuania Artificial Limbs Market Opportunity Assessment, By End User, 2022 & 2032F |
10 Lithuania Artificial Limbs Market - Competitive Landscape |
10.1 Lithuania Artificial Limbs Market Revenue Share, By Companies, 2025 |
10.2 Lithuania Artificial Limbs Market Competitive Benchmarking, By Operating and Technical Parameters |
11 Company Profiles |
12 Recommendations |
13 Disclaimer |
Global Go To Market Strategy - 2030
Export potential enables firms to identify high-growth global markets with greater confidence by combining advanced trade intelligence with a structured quantitative methodology. The framework analyzes emerging demand trends and country-level import patterns while integrating macroeconomic and trade datasets such as GDP and population forecasts, bilateral import–export flows, tariff structures, elasticity differentials between developed and developing economies, geographic distance, and import demand projections. Using weighted trade values from 2020–2024 as the base period to project country-to-country export potential for 2030, these inputs are operationalized through calculated drivers such as gravity model parameters, tariff impact factors, and projected GDP per-capita growth. Through an analysis of hidden potentials, demand hotspots, and market conditions that are most favorable to success, this method enables firms to focus on target countries, maximize returns, and global expansion with data, backed by accuracy.
By factoring in the projected importer demand gap that is currently unmet and could be potential opportunity, it identifies the potential for the Exporter (Country) among 190 countries, against the general trade analysis, which identifies the biggest importer or exporter.
To discover high-growth global markets and optimize your business strategy:
Click Here
Pricing
- Single User License$ 1,995
- Department License$ 2,400
- Site License$ 3,120
- Global License$ 3,795

Leadership Perspectives from Industry Events
Search
Thought Leadership and Analyst Meet


Our Clients
6WResearch In News
- Doha a strategic location for EV manufacturing hub: IPA Qatar
- Demand for luxury TVs surging in the GCC, says Samsung
- Empowering Growth: The Thriving Journey of Bangladesh’s Cable Industry
- Demand for luxury TVs surging in the GCC, says Samsung
- Video call with a traditional healer? Once unthinkable, it’s now common in South Africa
- Intelligent Buildings To Smooth GCC’s Path To Net Zero
Latest Reports
- New Zealand Aseptic Manufacturing Market (2026-2032)
- Netherlands Aseptic Manufacturing Market (2026-2032)
- Nauru Aseptic Manufacturing Market (2026-2032)
- Namibia Aseptic Manufacturing Market (2026-2032)
- Mozambique Aseptic Manufacturing Market (2026-2032)
- Montenegro Aseptic Manufacturing Market (2026-2032)
- Mongolia Aseptic Manufacturing Market (2026-2032)
- Monaco Aseptic Manufacturing Market (2026-2032)
- Micronesia Aseptic Manufacturing Market (2026-2032)
- Mauritius Aseptic Manufacturing Market (2026-2032)
Industry Events and Analyst Meet

HIMTEX 2026

India Refining Summit 2026

India EV Show 2026

EV tech India Expo 2026

Auto Tech Asia 2026
Whitepaper
- Middle East & Africa Commercial Security Market Click here to view more.
- Middle East & Africa Fire Safety Systems & Equipment Market Click here to view more.
- GCC Drone Market Click here to view more.
- Middle East Lighting Fixture Market Click here to view more.
- GCC Physical & Perimeter Security Market Click here to view more.