Lithuania Automotive Fabric Market (2026-2032) | Industry, Analysis, Share, Trends, Forecast, Value, Segmentation, Outlook, Growth, Revenue, Companies & Size
Market Forecast By Vehicle Type (Passenger Cars, Light Commercial Vehicles, Heavy Trucks, Buses & Coaches), By Application (Floor Covering, Upholstery, Pre-assembled Interior Components, Tires, Safety-Belts, Airbags) And Competitive Landscape
| Product Code: ETC5750029 | Publication Date: Nov 2023 | Updated Date: Apr 2026 | Product Type: Market Research Report | |
| Publisher: 6Wresearch | Author: Ravi Bhandari | No. of Pages: 60 | No. of Figures: 30 | No. of Tables: 5 |
Lithuania Automotive Fabric Market Size (2020-2030)
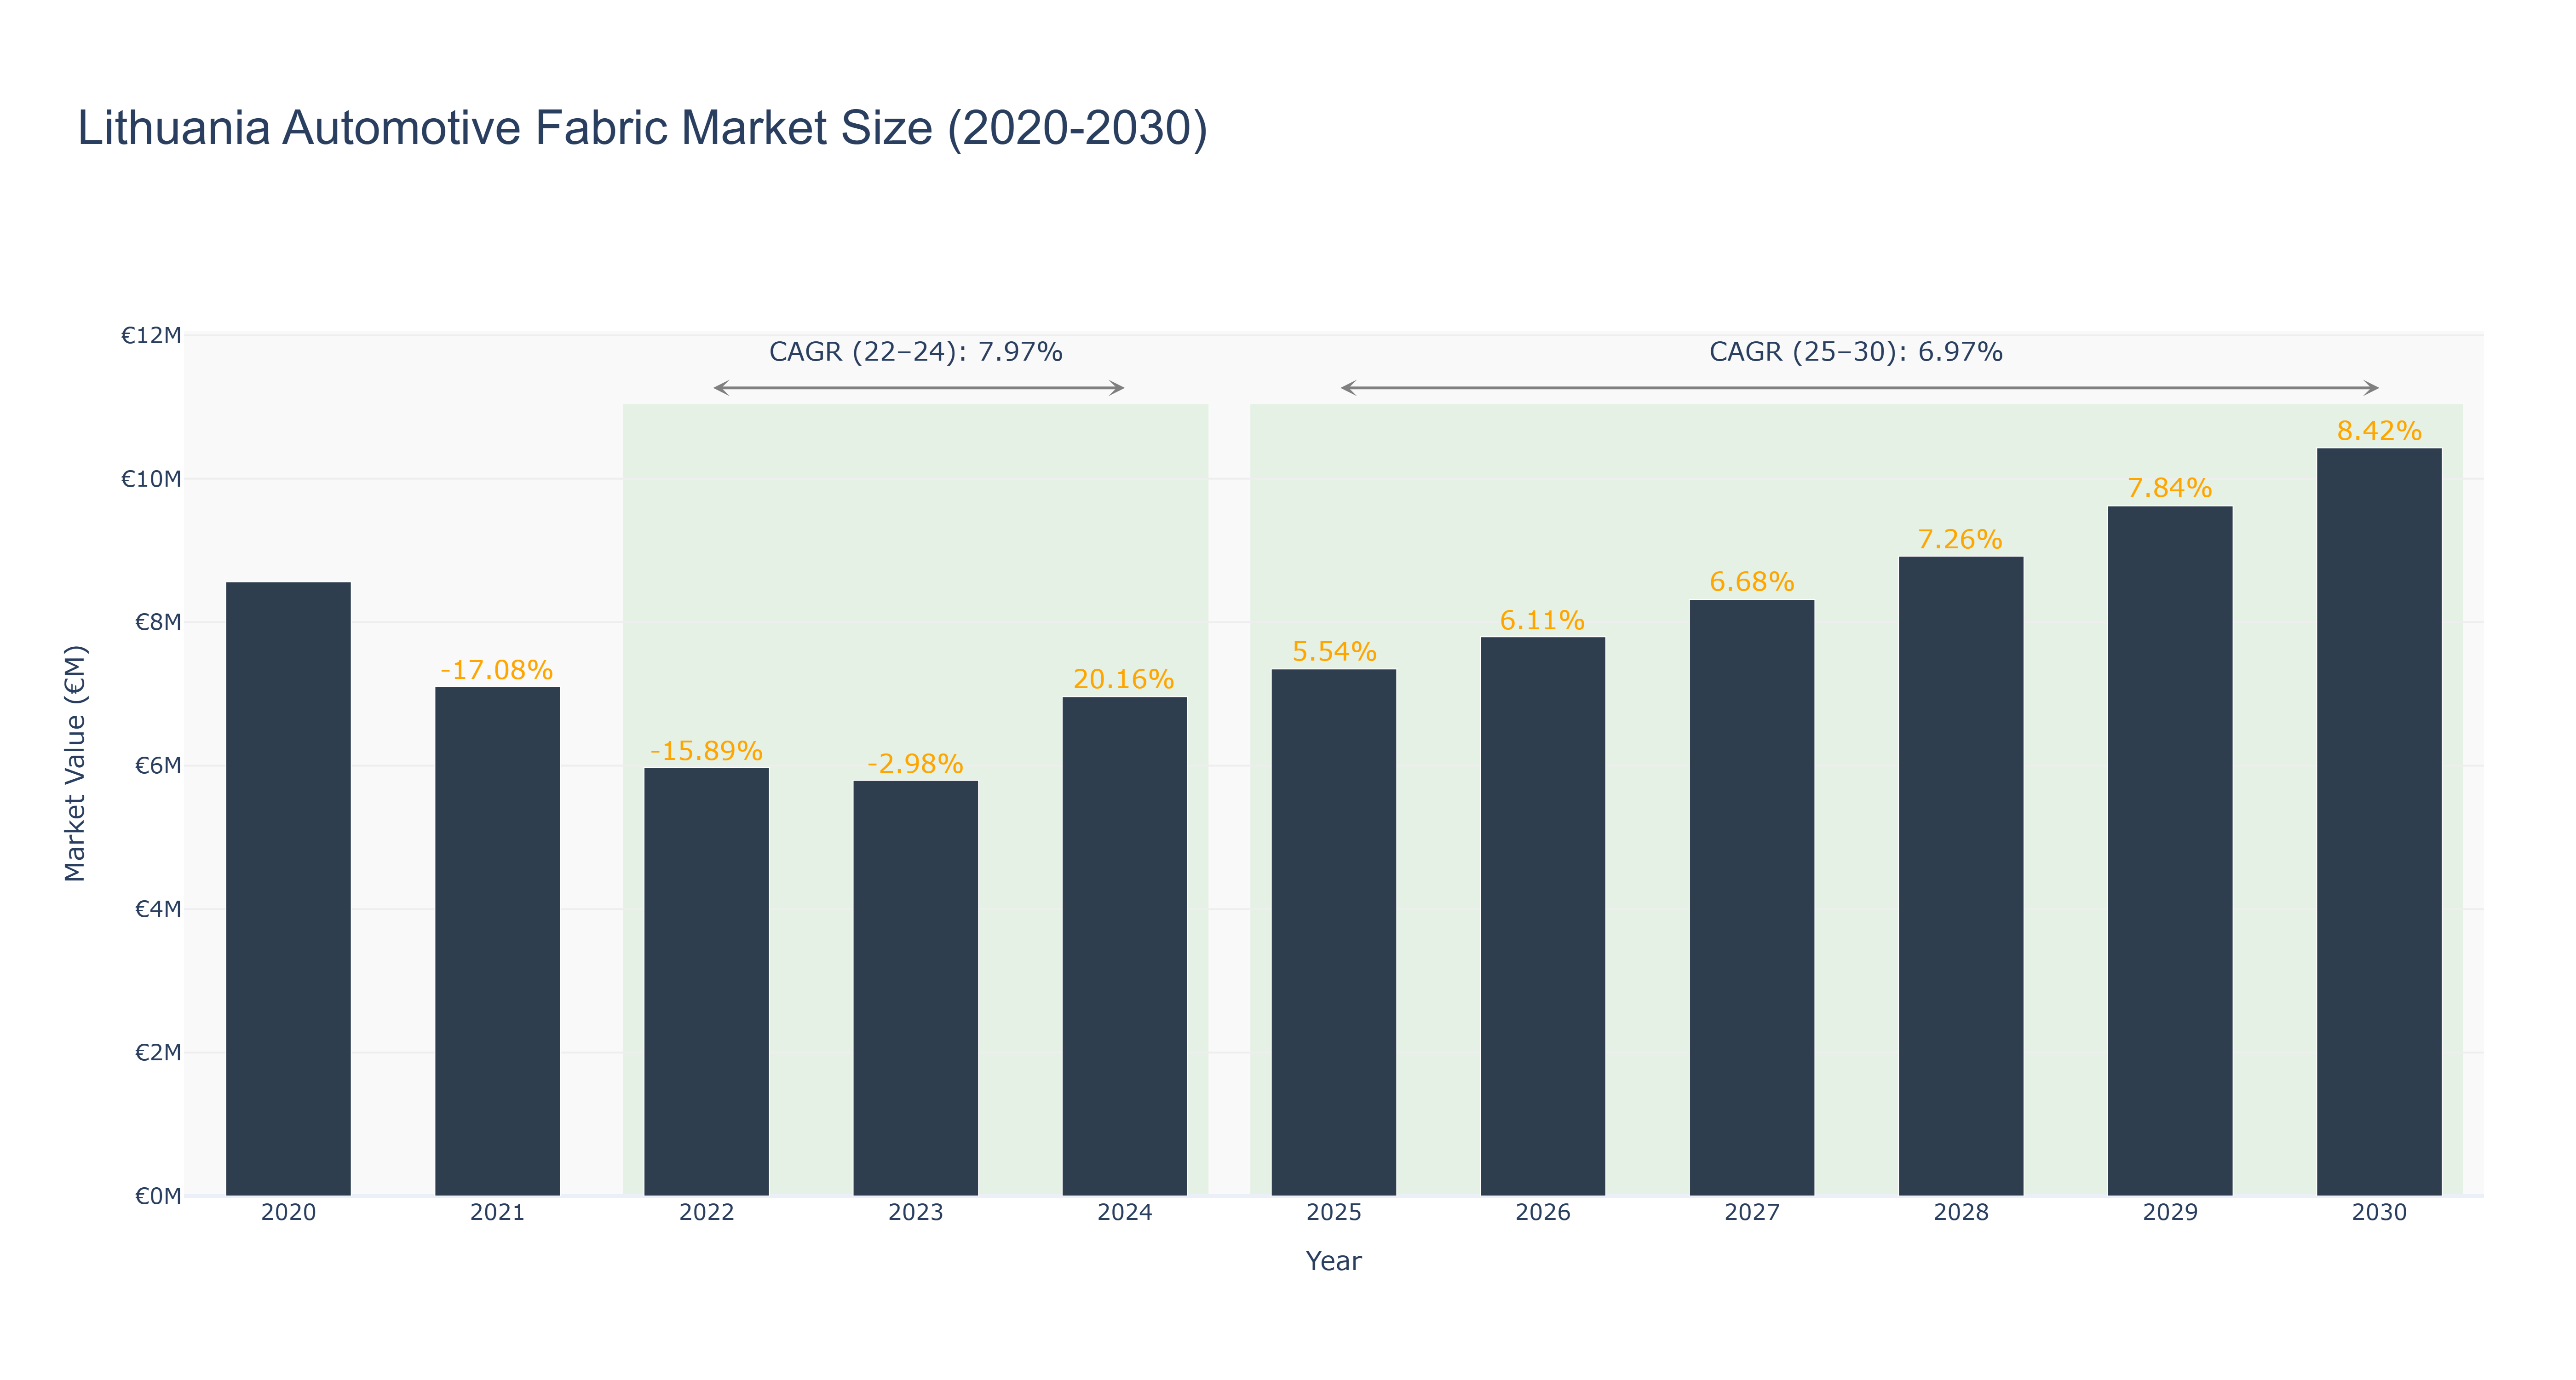
The Lithuania Automotive Fabric Market experienced a notable decline from its peak market size of €8.56 million in 2020, reducing to €5.79 million by 2023, which reflects a challenging period with a CAGR of -15.89% from 2021 to 2023. However, the actual market size is projected to rebound to €6.96 million in 2024, marking a significant growth of 20.16%. This recovery can be attributed to a resurgence in automotive manufacturing and increased investments in electric vehicle production. Looking ahead, the forecasted market size is expected to grow steadily, reaching €10.43 million by 2030, with a CAGR of 6.97% from 2025 to 2030. Key drivers for this projected growth include advancements in sustainable materials and a push toward innovation in automotive design. As Lithuania's automotive industry increasingly focuses on eco-friendly solutions, the automotive fabric market is poised for robust expansion.
Lithuania Automotive Fabric Market: Production & Trade Performance (2019-2025)
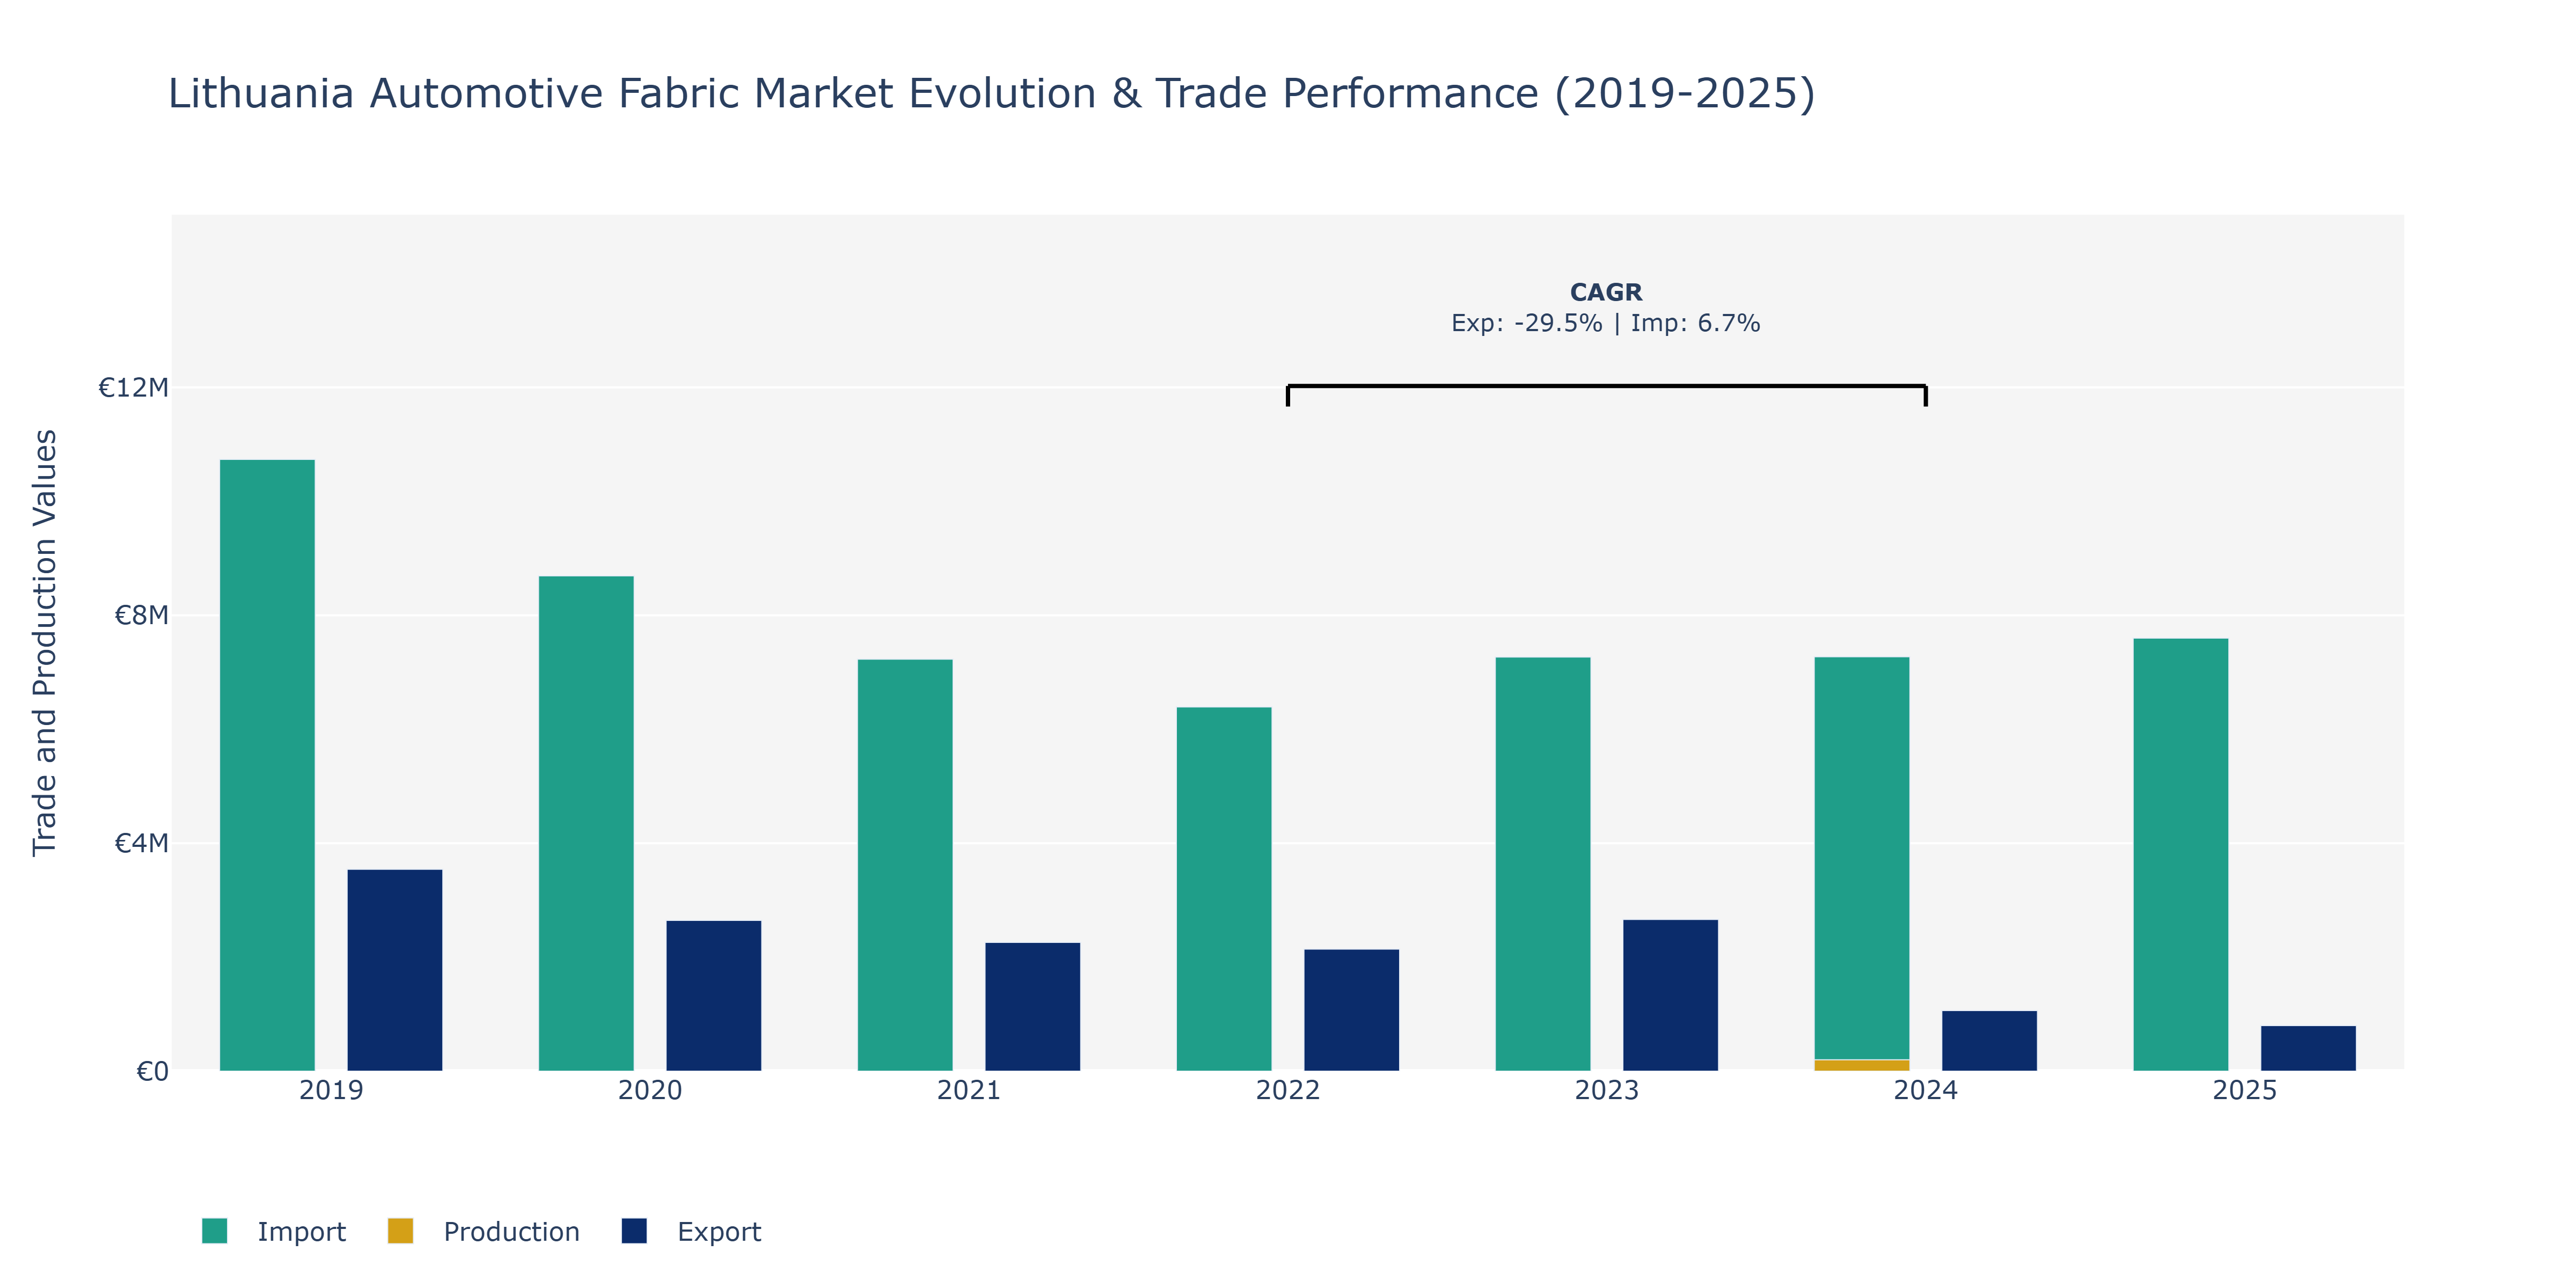
In the Lithuania Automotive Fabric Market, exports experienced a notable downward trend from 2019 to 2025, dropping from €3.54 million to €0.80 million. This decline can be attributed to various factors such as changes in global demand for automotive fabrics, fluctuations in raw material prices, and evolving trade policies impacting export volumes. Imports, on the other hand, displayed a relatively stable trajectory, with a slight increase in 2024 compared to 2019. Production value, available for 2019 and 2024, revealed a decrease from €0.22 million to €0.20 million during this period. The fluctuating nature of exports and the steady performance of imports suggest a shifting landscape in the automotive fabric market, possibly influenced by changing consumer preferences, technological advancements in the automotive industry, and competitive market dynamics.
Key Highlights of the Report:
- Lithuania Automotive Fabric Market Outlook
- Market Size of Lithuania Automotive Fabric Market, 2025
- Forecast of Lithuania Automotive Fabric Market, 2032
- Historical Data and Forecast of Lithuania Automotive Fabric Revenues & Volume for the Period 2022 - 2032F
- Lithuania Automotive Fabric Market Trend Evolution
- Lithuania Automotive Fabric Market Drivers and Challenges
- Lithuania Automotive Fabric Price Trends
- Lithuania Automotive Fabric Porter`s Five Forces
- Lithuania Automotive Fabric Industry Life Cycle
- Historical Data and Forecast of Lithuania Automotive Fabric Market Revenues & Volume By Vehicle Type for the Period 2022 - 2032F
- Historical Data and Forecast of Lithuania Automotive Fabric Market Revenues & Volume By Passenger Cars for the Period 2022 - 2032F
- Historical Data and Forecast of Lithuania Automotive Fabric Market Revenues & Volume By Light Commercial Vehicles for the Period 2022 - 2032F
- Historical Data and Forecast of Lithuania Automotive Fabric Market Revenues & Volume By Heavy Trucks for the Period 2022 - 2032F
- Historical Data and Forecast of Lithuania Automotive Fabric Market Revenues & Volume By Buses & Coaches for the Period 2022 - 2032F
- Historical Data and Forecast of Lithuania Automotive Fabric Market Revenues & Volume By Application for the Period 2022 - 2032F
- Historical Data and Forecast of Lithuania Automotive Fabric Market Revenues & Volume By Floor Covering for the Period 2022 - 2032F
- Historical Data and Forecast of Lithuania Automotive Fabric Market Revenues & Volume By Upholstery for the Period 2022 - 2032F
- Historical Data and Forecast of Lithuania Automotive Fabric Market Revenues & Volume By Pre-assembled Interior Components for the Period 2022 - 2032F
- Historical Data and Forecast of Lithuania Automotive Fabric Market Revenues & Volume By Tires for the Period 2022 - 2032F
- Historical Data and Forecast of Lithuania Automotive Fabric Market Revenues & Volume By Safety-Belts for the Period 2022 - 2032F
- Historical Data and Forecast of Lithuania Automotive Fabric Market Revenues & Volume By Airbags for the Period 2022 - 2032F
- Lithuania Automotive Fabric Import Export Trade Statistics
- Market Opportunity Assessment By Vehicle Type
- Market Opportunity Assessment By Application
- Lithuania Automotive Fabric Top Companies Market Share
- Lithuania Automotive Fabric Competitive Benchmarking By Technical and Operational Parameters
- Lithuania Automotive Fabric Company Profiles
- Lithuania Automotive Fabric Key Strategic Recommendations
Frequently Asked Questions About the Market Study (FAQs):
6Wresearch actively monitors the Lithuania Automotive Fabric Market and publishes its comprehensive annual report, highlighting emerging trends, growth drivers, revenue analysis, and forecast outlook. Our insights help businesses to make data-backed strategic decisions with ongoing market dynamics. Our analysts track relevent industries related to the Lithuania Automotive Fabric Market, allowing our clients with actionable intelligence and reliable forecasts tailored to emerging regional needs.
Yes, we provide customisation as per your requirements. To learn more, feel free to contact us on sales@6wresearch.com
1 Executive Summary |
2 Introduction |
2.1 Key Highlights of the Report |
2.2 Report Description |
2.3 Market Scope & Segmentation |
2.4 Research Methodology |
2.5 Assumptions |
3 Lithuania Automotive Fabric Market Overview |
3.1 Lithuania Country Macro Economic Indicators |
3.2 Lithuania Automotive Fabric Market Revenues & Volume, 2022 & 2032F |
3.3 Lithuania Automotive Fabric Market - Industry Life Cycle |
3.4 Lithuania Automotive Fabric Market - Porter's Five Forces |
3.5 Lithuania Automotive Fabric Market Revenues & Volume Share, By Vehicle Type, 2022 & 2032F |
3.6 Lithuania Automotive Fabric Market Revenues & Volume Share, By Application, 2022 & 2032F |
4 Lithuania Automotive Fabric Market Dynamics |
4.1 Impact Analysis |
4.2 Market Drivers |
4.2.1 Increasing demand for vehicles in Lithuania |
4.2.2 Growing focus on vehicle interior aesthetics and comfort |
4.2.3 Technological advancements in automotive fabric materials |
4.3 Market Restraints |
4.3.1 Volatility in raw material prices |
4.3.2 Stringent regulations related to automotive fabric manufacturing and usage |
5 Lithuania Automotive Fabric Market Trends |
6 Lithuania Automotive Fabric Market Segmentations |
6.1 Lithuania Automotive Fabric Market, By Vehicle Type |
6.1.1 Overview and Analysis |
6.1.2 Lithuania Automotive Fabric Market Revenues & Volume, By Passenger Cars, 2022 - 2032F |
6.1.3 Lithuania Automotive Fabric Market Revenues & Volume, By Light Commercial Vehicles, 2022 - 2032F |
6.1.4 Lithuania Automotive Fabric Market Revenues & Volume, By Heavy Trucks, 2022 - 2032F |
6.1.5 Lithuania Automotive Fabric Market Revenues & Volume, By Buses & Coaches, 2022 - 2032F |
6.2 Lithuania Automotive Fabric Market, By Application |
6.2.1 Overview and Analysis |
6.2.2 Lithuania Automotive Fabric Market Revenues & Volume, By Floor Covering, 2022 - 2032F |
6.2.3 Lithuania Automotive Fabric Market Revenues & Volume, By Upholstery, 2022 - 2032F |
6.2.4 Lithuania Automotive Fabric Market Revenues & Volume, By Pre-assembled Interior Components, 2022 - 2032F |
6.2.5 Lithuania Automotive Fabric Market Revenues & Volume, By Tires, 2022 - 2032F |
6.2.6 Lithuania Automotive Fabric Market Revenues & Volume, By Safety-Belts, 2022 - 2032F |
6.2.7 Lithuania Automotive Fabric Market Revenues & Volume, By Airbags, 2022 - 2032F |
7 Lithuania Automotive Fabric Market Import-Export Trade Statistics |
7.1 Lithuania Automotive Fabric Market Export to Major Countries |
7.2 Lithuania Automotive Fabric Market Imports from Major Countries |
8 Lithuania Automotive Fabric Market Key Performance Indicators |
8.1 Average selling price of automotive fabrics in Lithuania |
8.2 Adoption rate of eco-friendly automotive fabrics in the market |
8.3 Number of partnerships between automotive fabric manufacturers and automotive OEMs |
8.4 Percentage of vehicles in Lithuania equipped with custom-designed fabric interiors |
8.5 Rate of innovation in automotive fabric design and functionality |
9 Lithuania Automotive Fabric Market - Opportunity Assessment |
9.1 Lithuania Automotive Fabric Market Opportunity Assessment, By Vehicle Type, 2022 & 2032F |
9.2 Lithuania Automotive Fabric Market Opportunity Assessment, By Application, 2022 & 2032F |
10 Lithuania Automotive Fabric Market - Competitive Landscape |
10.1 Lithuania Automotive Fabric Market Revenue Share, By Companies, 2025 |
10.2 Lithuania Automotive Fabric Market Competitive Benchmarking, By Operating and Technical Parameters |
11 Company Profiles |
12 Recommendations | 13 Disclaimer |
Global Go To Market Strategy - 2030
Export potential enables firms to identify high-growth global markets with greater confidence by combining advanced trade intelligence with a structured quantitative methodology. The framework analyzes emerging demand trends and country-level import patterns while integrating macroeconomic and trade datasets such as GDP and population forecasts, bilateral import–export flows, tariff structures, elasticity differentials between developed and developing economies, geographic distance, and import demand projections. Using weighted trade values from 2020–2024 as the base period to project country-to-country export potential for 2030, these inputs are operationalized through calculated drivers such as gravity model parameters, tariff impact factors, and projected GDP per-capita growth. Through an analysis of hidden potentials, demand hotspots, and market conditions that are most favorable to success, this method enables firms to focus on target countries, maximize returns, and global expansion with data, backed by accuracy.
By factoring in the projected importer demand gap that is currently unmet and could be potential opportunity, it identifies the potential for the Exporter (Country) among 190 countries, against the general trade analysis, which identifies the biggest importer or exporter.
To discover high-growth global markets and optimize your business strategy:
Click Here
Pricing
- Single User License$ 1,995
- Department License$ 2,400
- Site License$ 3,120
- Global License$ 3,795

Leadership Perspectives from Industry Events
Search
Thought Leadership and Analyst Meet


Our Clients
6WResearch In News
- India Export Attractiveness Tracker 2026
- India Air Conditioner Market Set for Strong Rebound in 2026 After Weather-Led Correction and GST-Driven Recovery: 6Wresearch
- ADAS in India: How Automatic Emergency Braking, Blind Spot Detection & Driver Monitoring are Transforming Road Safety
- Doha a strategic location for EV manufacturing hub: IPA Qatar
- Demand for luxury TVs surging in the GCC, says Samsung
- Empowering Growth: The Thriving Journey of Bangladesh’s Cable Industry
Latest Reports
- Nicaragua RPG Gaming Market (2026-2032)
- New Zealand RPG Gaming Market (2026-2032)
- Netherlands RPG Gaming Market (2026-2032)
- Nauru RPG Gaming Market (2026-2032)
- Namibia RPG Gaming Market (2026-2032)
- Mozambique RPG Gaming Market (2026-2032)
- Montenegro RPG Gaming Market (2026-2032)
- Mongolia RPG Gaming Market (2026-2032)
- Monaco RPG Gaming Market (2026-2032)
- Micronesia RPG Gaming Market (2026-2032)
Industry Events and Analyst Meet

EV India Expo 2026

HIMTEX 2026

India Refining Summit 2026

India EV Show 2026

EV tech India Expo 2026
Whitepaper
- Middle East & Africa Commercial Security Market Click here to view more.
- Middle East & Africa Fire Safety Systems & Equipment Market Click here to view more.
- GCC Drone Market Click here to view more.
- Middle East Lighting Fixture Market Click here to view more.
- GCC Physical & Perimeter Security Market Click here to view more.