Lithuania Composite Rollers Market (2026-2032) | Forecast, Value, Segmentation, Companies, Industry, Size, Analysis, Growth, Trends, Revenue, Outlook & Share
Market Forecast By Fiber Type (Carbon, Glass, Others), By End Use Industry (Mining, Pulp & Paper, Textile, Film & Foil Processing), By Resin Type (Thermoset, Thermoplastic) And Competitive Landscape
| Product Code: ETC5711326 | Publication Date: Nov 2023 | Updated Date: Apr 2026 | Product Type: Market Research Report | |
| Publisher: 6Wresearch | Author: Ravi Bhandari | No. of Pages: 60 | No. of Figures: 30 | No. of Tables: 5 |
Lithuania Composite Rollers Market Size (2020-2030)
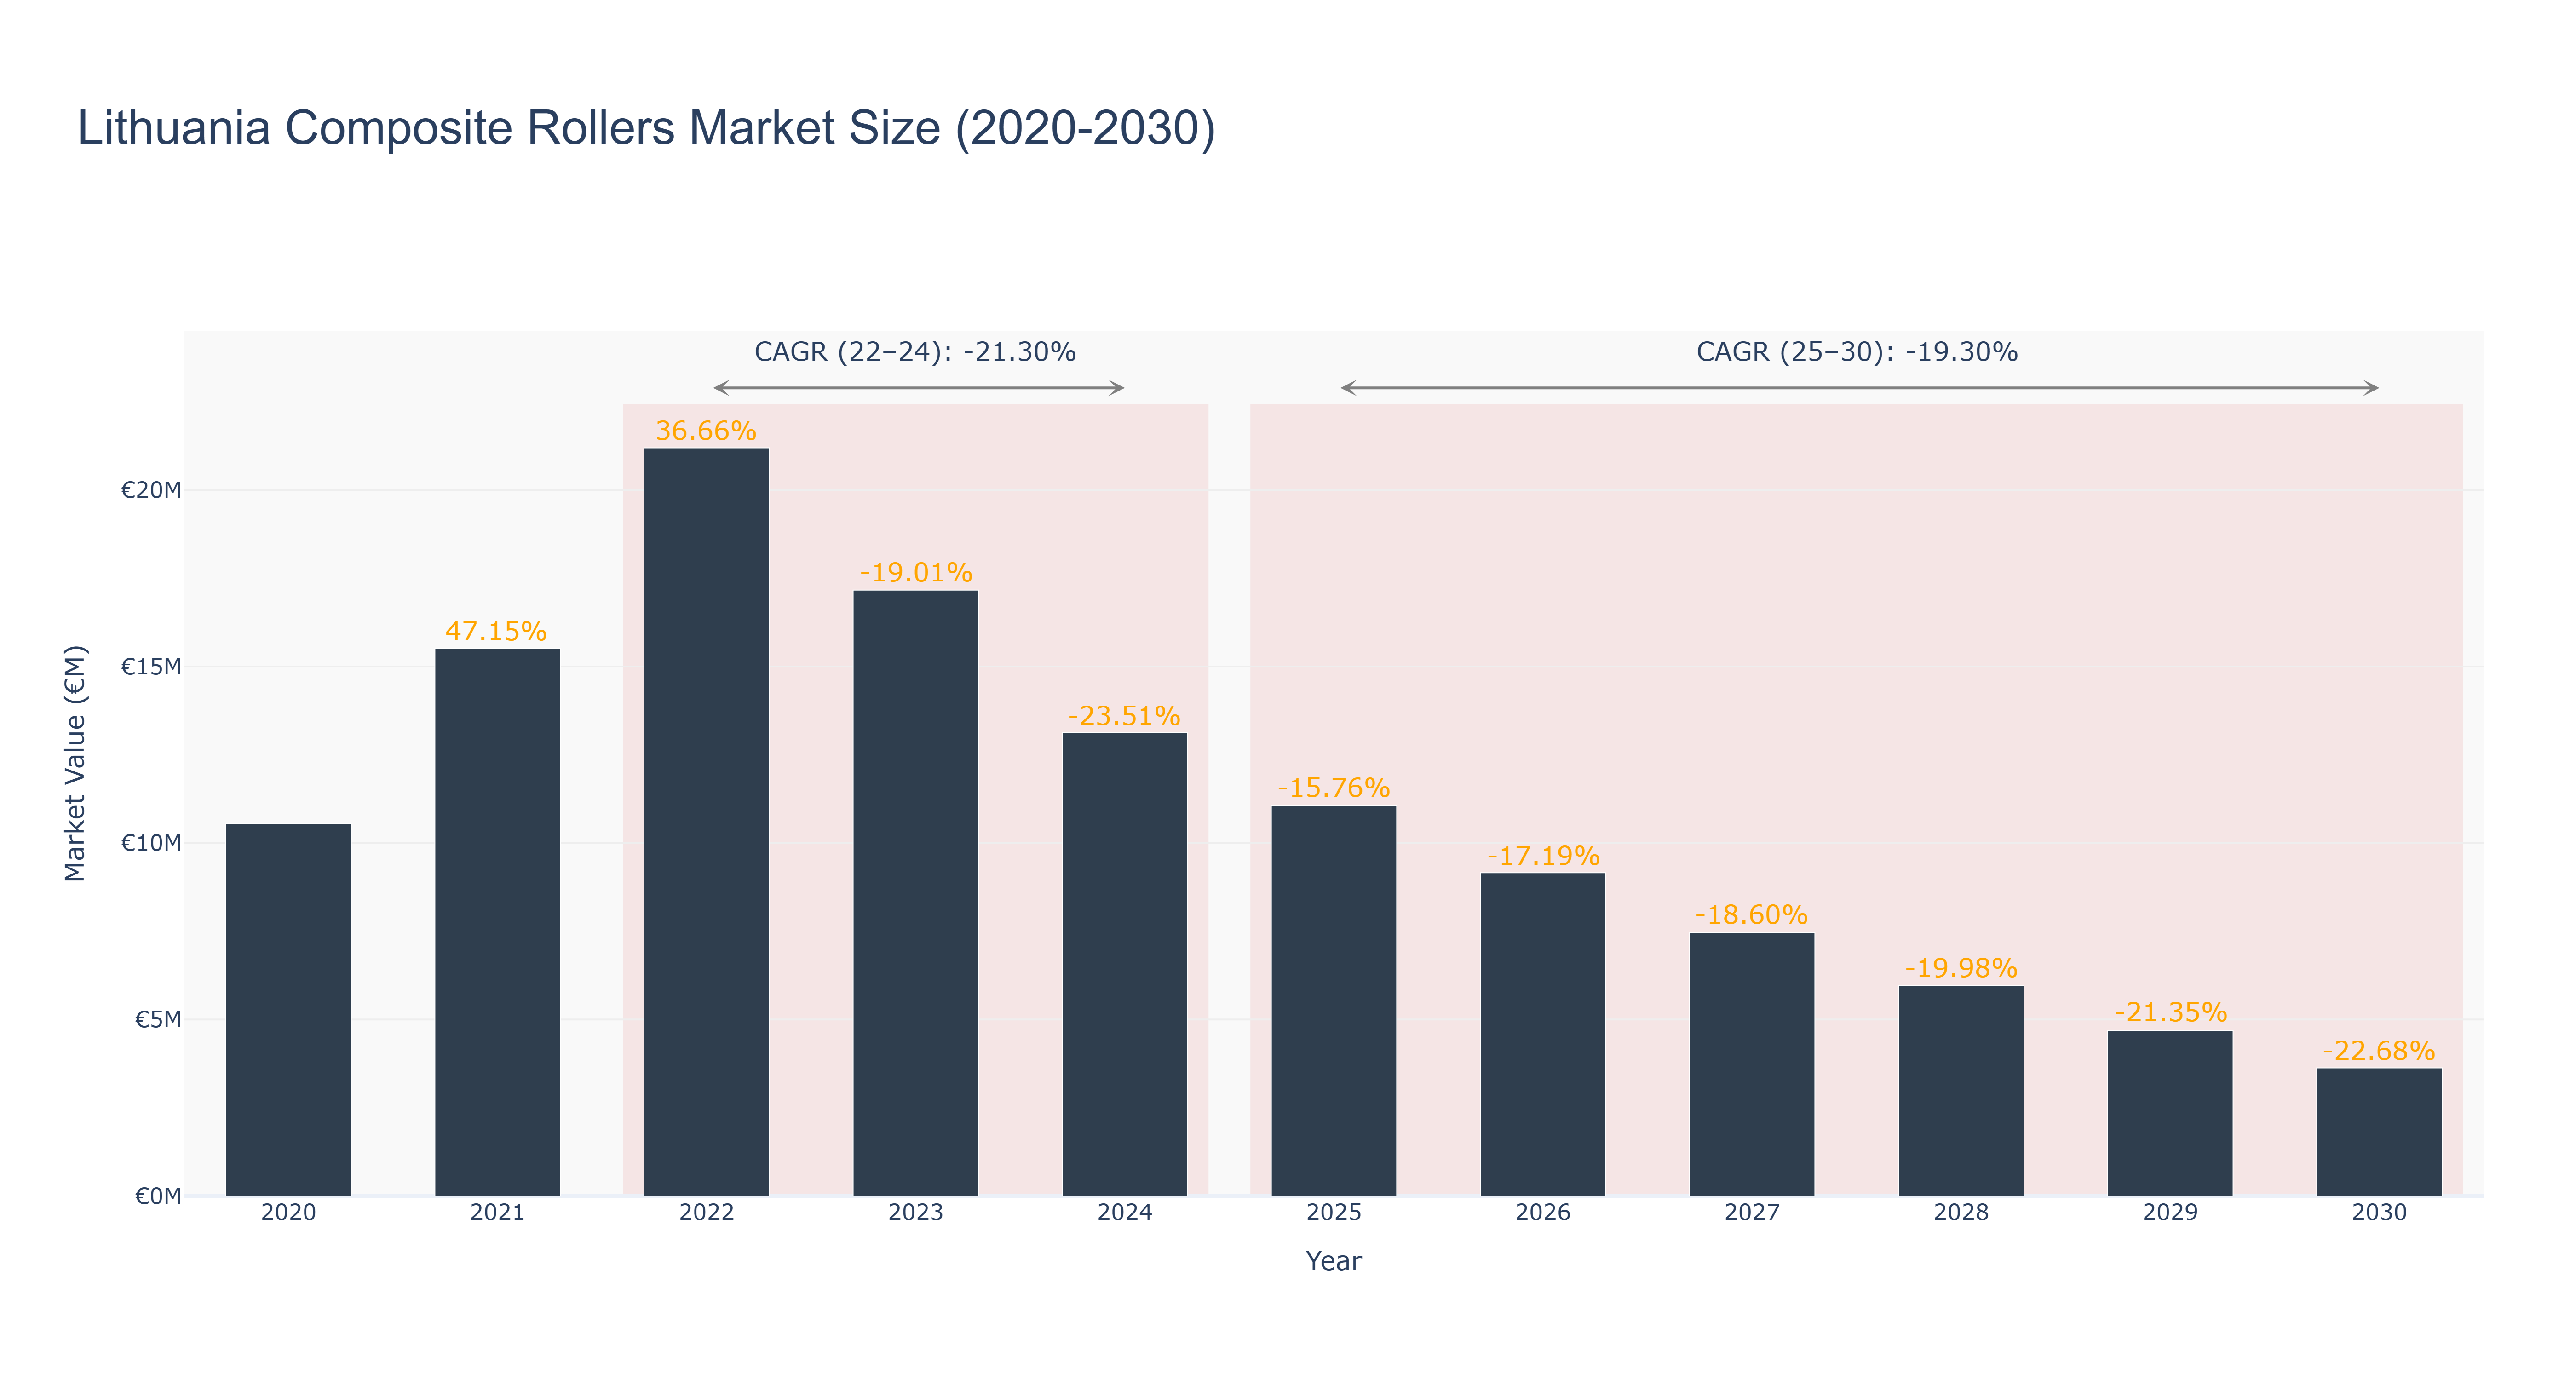
The Lithuania Composite Rollers Market experienced significant growth from €10.54 million in 2020 to a peak of €21.20 million in 2022, reflecting an impressive 36.66% growth year-on-year. However, the market faced a downturn in 2023 and 2024, with sizes declining to €17.17 million and €13.13 million, respectively, resulting in a compounded annual growth rate (CAGR) of -21.30% for the actual period from 2022 to 2024. The forecast for 2025-2030 indicates a continued decline, with projected market sizes decreasing from €11.06 million in 2025 to €3.63 million by 2030, reflecting a CAGR of -19.30%. This downturn can be attributed to reduced demand stemming from economic uncertainties and shifts in production technologies. Despite the challenges, potential macro drivers, such as advancements in composite materials and increased automation in manufacturing processes, may shape future opportunities. However, without significant market intervention or innovation, the outlook remains bleak.
Lithuania Composite Rollers Market: Production & Trade Performance (2019-2025)
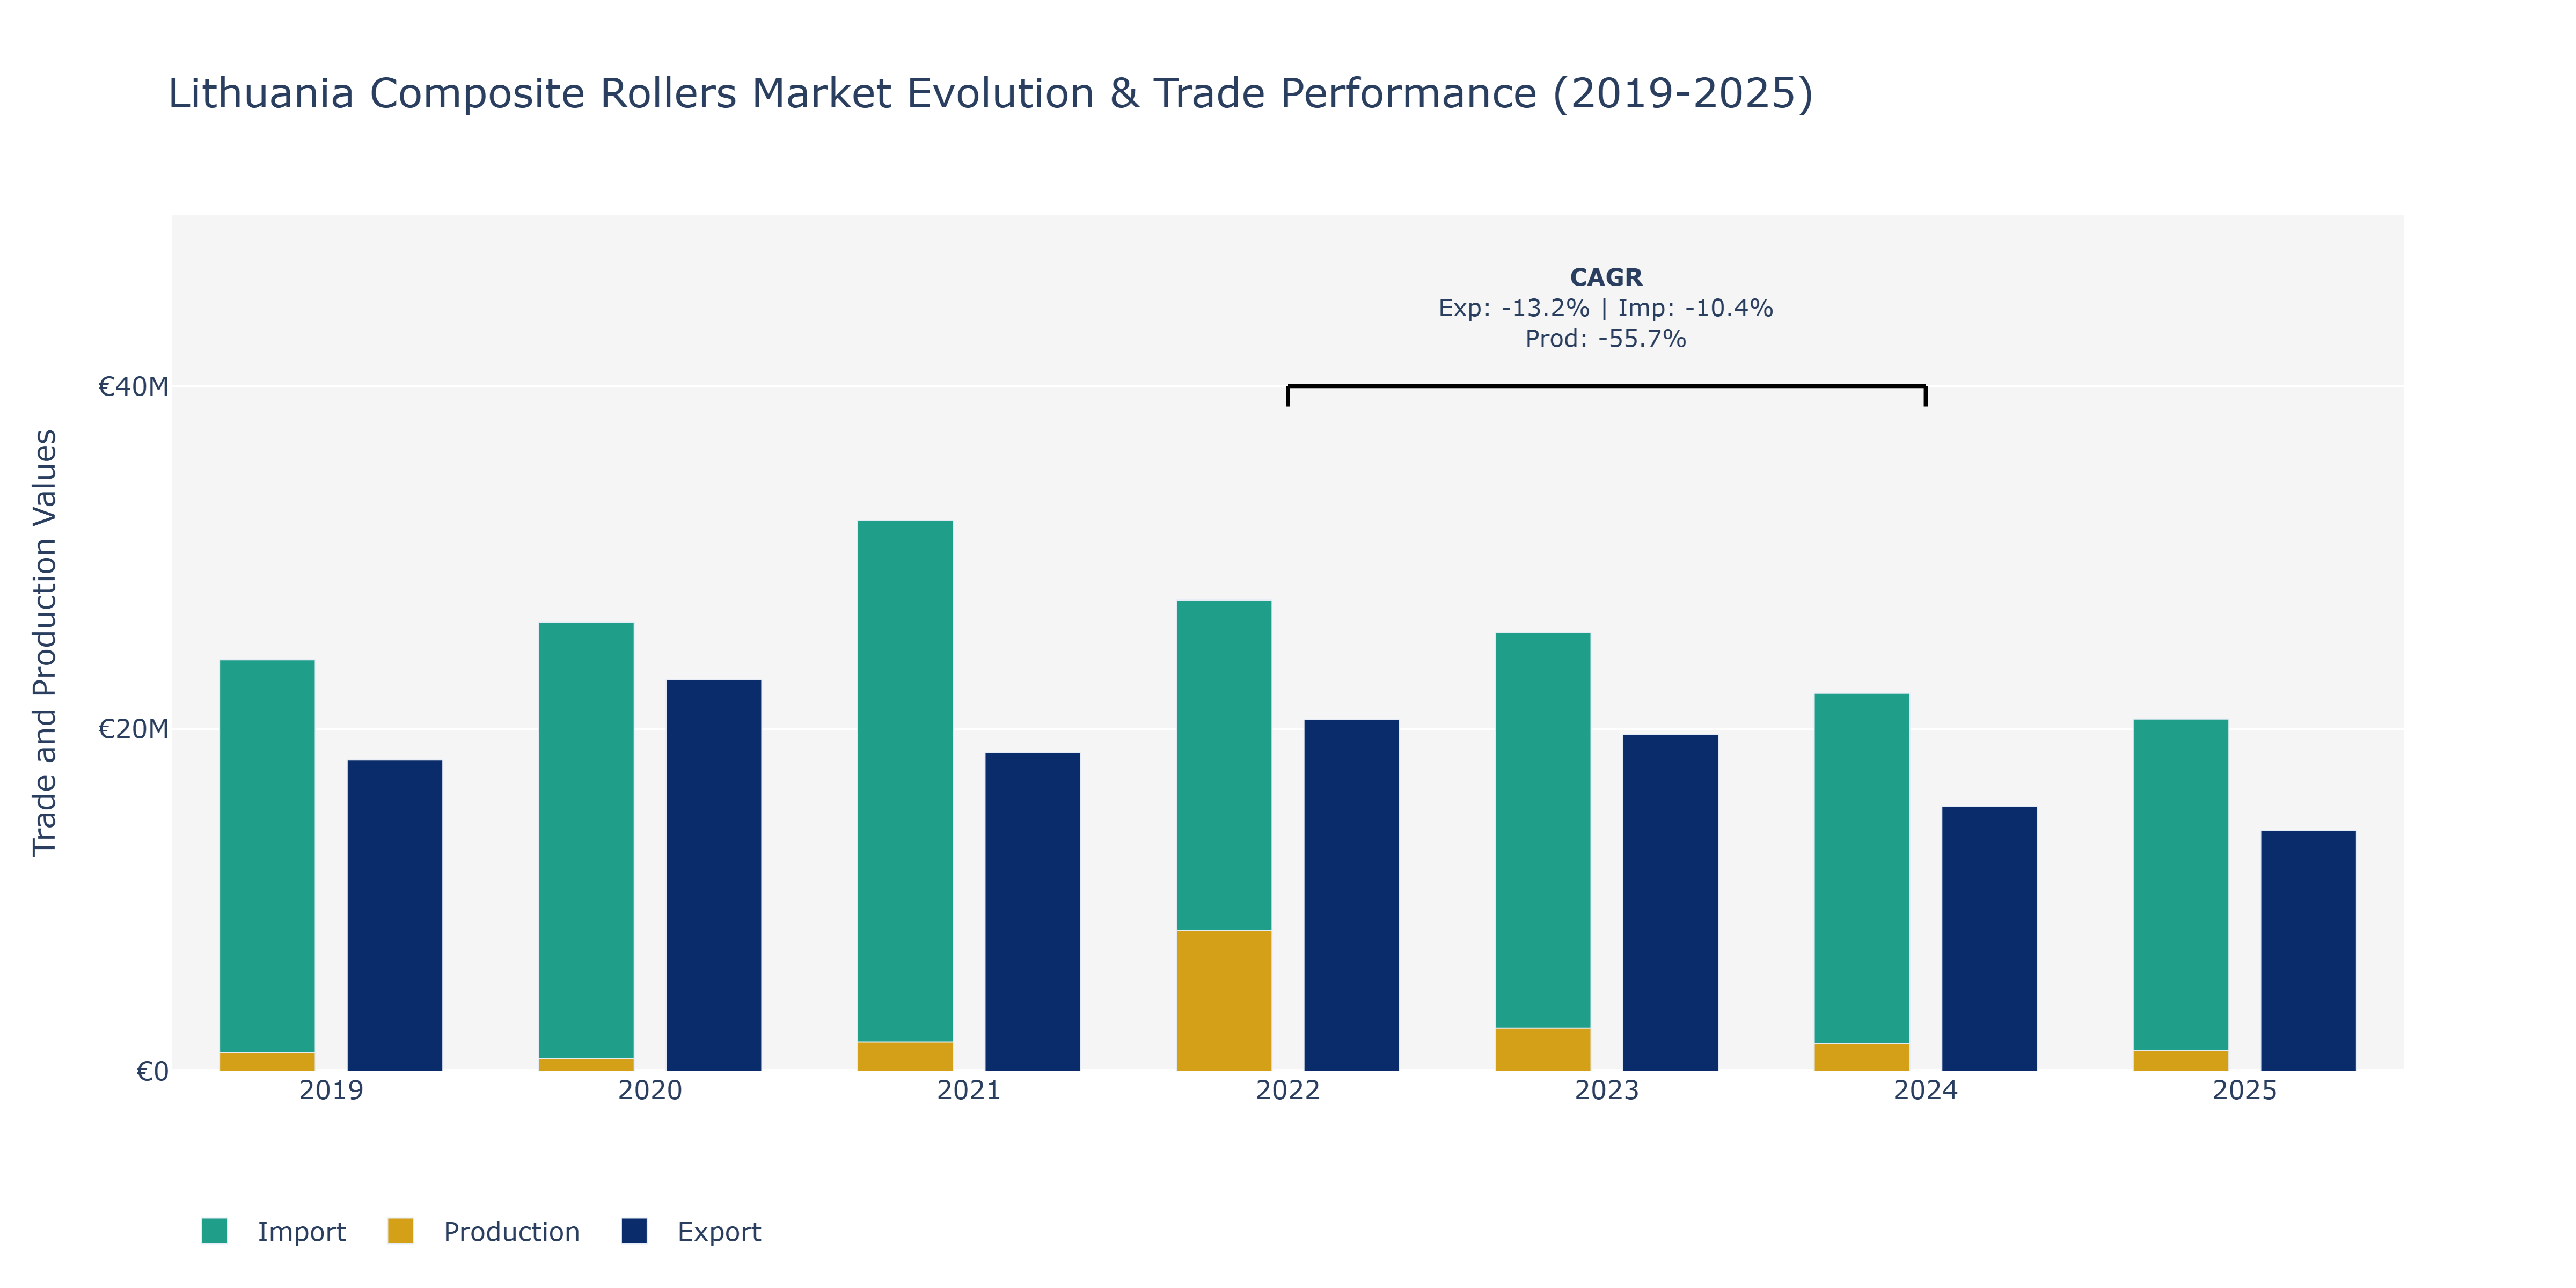
In the Lithuania Composite Rollers Market, from 2019 to 2025, exports demonstrated a fluctuating trend with a peak in 2020 at €22.86 million and a decline to €14.07 million in 2025. Imports consistently increased annually, reaching €32.16 million in 2021, driven by the growing demand for raw materials and components. Production experienced a notable peak in 2022 at €8.22 million, followed by a substantial decline in 2023 to €2.52 million. The sharp decrease in production could be attributed to supply chain disruptions or technological shifts impacting manufacturing processes. The fluctuations in exports could be linked to global economic conditions affecting demand for composite rollers in various industries. Import increases may reflect the need for advanced technology and materials to meet market demands in the composite rollers sector, aligning with the industry's focus on innovation and quality enhancement strategies.
Key Highlights of the Report:
- Lithuania Composite Rollers Market Outlook
- Market Size of Lithuania Composite Rollers Market, 2025
- Forecast of Lithuania Composite Rollers Market, 2032
- Historical Data and Forecast of Lithuania Composite Rollers Revenues & Volume for the Period 2022 - 2032F
- Lithuania Composite Rollers Market Trend Evolution
- Lithuania Composite Rollers Market Drivers and Challenges
- Lithuania Composite Rollers Price Trends
- Lithuania Composite Rollers Porter`s Five Forces
- Lithuania Composite Rollers Industry Life Cycle
- Historical Data and Forecast of Lithuania Composite Rollers Market Revenues & Volume By Fiber Type for the Period 2022 - 2032F
- Historical Data and Forecast of Lithuania Composite Rollers Market Revenues & Volume By Carbon for the Period 2022 - 2032F
- Historical Data and Forecast of Lithuania Composite Rollers Market Revenues & Volume By Glass for the Period 2022 - 2032F
- Historical Data and Forecast of Lithuania Composite Rollers Market Revenues & Volume By Others for the Period 2022 - 2032F
- Historical Data and Forecast of Lithuania Composite Rollers Market Revenues & Volume By End Use Industry for the Period 2022 - 2032F
- Historical Data and Forecast of Lithuania Composite Rollers Market Revenues & Volume By Mining for the Period 2022 - 2032F
- Historical Data and Forecast of Lithuania Composite Rollers Market Revenues & Volume By Pulp & Paper for the Period 2022 - 2032F
- Historical Data and Forecast of Lithuania Composite Rollers Market Revenues & Volume By Textile for the Period 2022 - 2032F
- Historical Data and Forecast of Lithuania Composite Rollers Market Revenues & Volume By Film & Foil Processing for the Period 2022 - 2032F
- Historical Data and Forecast of Lithuania Composite Rollers Market Revenues & Volume By Resin Type for the Period 2022 - 2032F
- Historical Data and Forecast of Lithuania Composite Rollers Market Revenues & Volume By Thermoset for the Period 2022 - 2032F
- Historical Data and Forecast of Lithuania Composite Rollers Market Revenues & Volume By Thermoplastic for the Period 2022 - 2032F
- Lithuania Composite Rollers Import Export Trade Statistics
- Market Opportunity Assessment By Fiber Type
- Market Opportunity Assessment By End Use Industry
- Market Opportunity Assessment By Resin Type
- Lithuania Composite Rollers Top Companies Market Share
- Lithuania Composite Rollers Competitive Benchmarking By Technical and Operational Parameters
- Lithuania Composite Rollers Company Profiles
- Lithuania Composite Rollers Key Strategic Recommendations
Frequently Asked Questions About the Market Study (FAQs):
6Wresearch actively monitors the Lithuania Composite Rollers Market and publishes its comprehensive annual report, highlighting emerging trends, growth drivers, revenue analysis, and forecast outlook. Our insights help businesses to make data-backed strategic decisions with ongoing market dynamics. Our analysts track relevent industries related to the Lithuania Composite Rollers Market, allowing our clients with actionable intelligence and reliable forecasts tailored to emerging regional needs.
Yes, we provide customisation as per your requirements. To learn more, feel free to contact us on sales@6wresearch.com
1 Executive Summary |
2 Introduction |
2.1 Key Highlights of the Report |
2.2 Report Description |
2.3 Market Scope & Segmentation |
2.4 Research Methodology |
2.5 Assumptions |
3 Lithuania Composite Rollers Market Overview |
3.1 Lithuania Country Macro Economic Indicators |
3.2 Lithuania Composite Rollers Market Revenues & Volume, 2022 & 2032F |
3.3 Lithuania Composite Rollers Market - Industry Life Cycle |
3.4 Lithuania Composite Rollers Market - Porter's Five Forces |
3.5 Lithuania Composite Rollers Market Revenues & Volume Share, By Fiber Type, 2022 & 2032F |
3.6 Lithuania Composite Rollers Market Revenues & Volume Share, By End Use Industry, 2022 & 2032F |
3.7 Lithuania Composite Rollers Market Revenues & Volume Share, By Resin Type, 2022 & 2032F |
4 Lithuania Composite Rollers Market Dynamics |
4.1 Impact Analysis |
4.2 Market Drivers |
4.2.1 Increasing demand for lightweight and durable material handling equipment |
4.2.2 Growing focus on energy efficiency and sustainability in industrial operations |
4.2.3 Technological advancements in composite materials leading to improved performance and cost-effectiveness |
4.3 Market Restraints |
4.3.1 High initial investment cost associated with composite rollers |
4.3.2 Limited awareness and adoption of composite rollers in traditional industries |
4.3.3 Challenges in manufacturing processes and quality control of composite materials |
5 Lithuania Composite Rollers Market Trends |
6 Lithuania Composite Rollers Market Segmentations |
6.1 Lithuania Composite Rollers Market, By Fiber Type |
6.1.1 Overview and Analysis |
6.1.2 Lithuania Composite Rollers Market Revenues & Volume, By Carbon, 2022 - 2032F |
6.1.3 Lithuania Composite Rollers Market Revenues & Volume, By Glass, 2022 - 2032F |
6.1.4 Lithuania Composite Rollers Market Revenues & Volume, By Others, 2022 - 2032F |
6.2 Lithuania Composite Rollers Market, By End Use Industry |
6.2.1 Overview and Analysis |
6.2.2 Lithuania Composite Rollers Market Revenues & Volume, By Mining, 2022 - 2032F |
6.2.3 Lithuania Composite Rollers Market Revenues & Volume, By Pulp & Paper, 2022 - 2032F |
6.2.4 Lithuania Composite Rollers Market Revenues & Volume, By Textile, 2022 - 2032F |
6.2.5 Lithuania Composite Rollers Market Revenues & Volume, By Film & Foil Processing, 2022 - 2032F |
6.3 Lithuania Composite Rollers Market, By Resin Type |
6.3.1 Overview and Analysis |
6.3.2 Lithuania Composite Rollers Market Revenues & Volume, By Thermoset, 2022 - 2032F |
6.3.3 Lithuania Composite Rollers Market Revenues & Volume, By Thermoplastic, 2022 - 2032F |
7 Lithuania Composite Rollers Market Import-Export Trade Statistics |
7.1 Lithuania Composite Rollers Market Export to Major Countries |
7.2 Lithuania Composite Rollers Market Imports from Major Countries |
8 Lithuania Composite Rollers Market Key Performance Indicators |
8.1 Weight reduction achieved through the use of composite rollers |
8.2 Increase in lifespan and durability of composite rollers compared to traditional materials |
8.3 Improvement in energy efficiency and operational performance with the adoption of composite rollers. |
9 Lithuania Composite Rollers Market - Opportunity Assessment |
9.1 Lithuania Composite Rollers Market Opportunity Assessment, By Fiber Type, 2022 & 2032F |
9.2 Lithuania Composite Rollers Market Opportunity Assessment, By End Use Industry, 2022 & 2032F |
9.3 Lithuania Composite Rollers Market Opportunity Assessment, By Resin Type, 2022 & 2032F |
10 Lithuania Composite Rollers Market - Competitive Landscape |
10.1 Lithuania Composite Rollers Market Revenue Share, By Companies, 2025 |
10.2 Lithuania Composite Rollers Market Competitive Benchmarking, By Operating and Technical Parameters |
11 Company Profiles |
12 Recommendations | 13 Disclaimer |
Global Go To Market Strategy - 2030
Export potential enables firms to identify high-growth global markets with greater confidence by combining advanced trade intelligence with a structured quantitative methodology. The framework analyzes emerging demand trends and country-level import patterns while integrating macroeconomic and trade datasets such as GDP and population forecasts, bilateral import–export flows, tariff structures, elasticity differentials between developed and developing economies, geographic distance, and import demand projections. Using weighted trade values from 2020–2024 as the base period to project country-to-country export potential for 2030, these inputs are operationalized through calculated drivers such as gravity model parameters, tariff impact factors, and projected GDP per-capita growth. Through an analysis of hidden potentials, demand hotspots, and market conditions that are most favorable to success, this method enables firms to focus on target countries, maximize returns, and global expansion with data, backed by accuracy.
By factoring in the projected importer demand gap that is currently unmet and could be potential opportunity, it identifies the potential for the Exporter (Country) among 190 countries, against the general trade analysis, which identifies the biggest importer or exporter.
To discover high-growth global markets and optimize your business strategy:
Click Here
Pricing
- Single User License$ 1,995
- Department License$ 2,400
- Site License$ 3,120
- Global License$ 3,795

Leadership Perspectives from Industry Events
Search
Thought Leadership and Analyst Meet


Our Clients
6WResearch In News
- India Export Attractiveness Tracker 2026
- India Air Conditioner Market Set for Strong Rebound in 2026 After Weather-Led Correction and GST-Driven Recovery: 6Wresearch
- ADAS in India: How Automatic Emergency Braking, Blind Spot Detection & Driver Monitoring are Transforming Road Safety
- Doha a strategic location for EV manufacturing hub: IPA Qatar
- Demand for luxury TVs surging in the GCC, says Samsung
- Empowering Growth: The Thriving Journey of Bangladesh’s Cable Industry
Latest Reports
- Nicaragua RPG Gaming Market (2026-2032)
- New Zealand RPG Gaming Market (2026-2032)
- Netherlands RPG Gaming Market (2026-2032)
- Nauru RPG Gaming Market (2026-2032)
- Namibia RPG Gaming Market (2026-2032)
- Mozambique RPG Gaming Market (2026-2032)
- Montenegro RPG Gaming Market (2026-2032)
- Mongolia RPG Gaming Market (2026-2032)
- Monaco RPG Gaming Market (2026-2032)
- Micronesia RPG Gaming Market (2026-2032)
Industry Events and Analyst Meet

EV India Expo 2026

HIMTEX 2026

India Refining Summit 2026

India EV Show 2026

EV tech India Expo 2026
Whitepaper
- Middle East & Africa Commercial Security Market Click here to view more.
- Middle East & Africa Fire Safety Systems & Equipment Market Click here to view more.
- GCC Drone Market Click here to view more.
- Middle East Lighting Fixture Market Click here to view more.
- GCC Physical & Perimeter Security Market Click here to view more.