Lithuania Copra Meal Market (2026-2032) | Pricing Analysis, Competitive, Strategic Insights, Value, Demand, Revenue, Supply, Challenges, Restraints, Competition, Forecast, Companies, Strategy, Analysis, Growth, Investment Trends, Consumer Insights, Segments, Industry, Drivers, Trends, Size, Outlook, Share, Segmentation, Opportunities
Market Forecast By Form (Pellets, Powder, Granules, Others), By Application (Animal Feed, Organic Fertilizer, Industrial Use, Others), By End User (Livestock, Agriculture, Biofuel, Others), By Processing Method (Mechanical Pressing, Solvent Extraction, Cold Pressing, Others), By Distribution Channel (Wholesale, Direct Sales, Distributors, Others) And Competitive Landscape
| Product Code: ETC11762298 | Publication Date: Apr 2025 | Updated Date: Apr 2026 | Product Type: Market Research Report | |
| Publisher: 6Wresearch | No. of Pages: 65 | No. of Figures: 34 | No. of Tables: 19 | |
Lithuania Copra Meal Market - Import Trends (2019-2025)
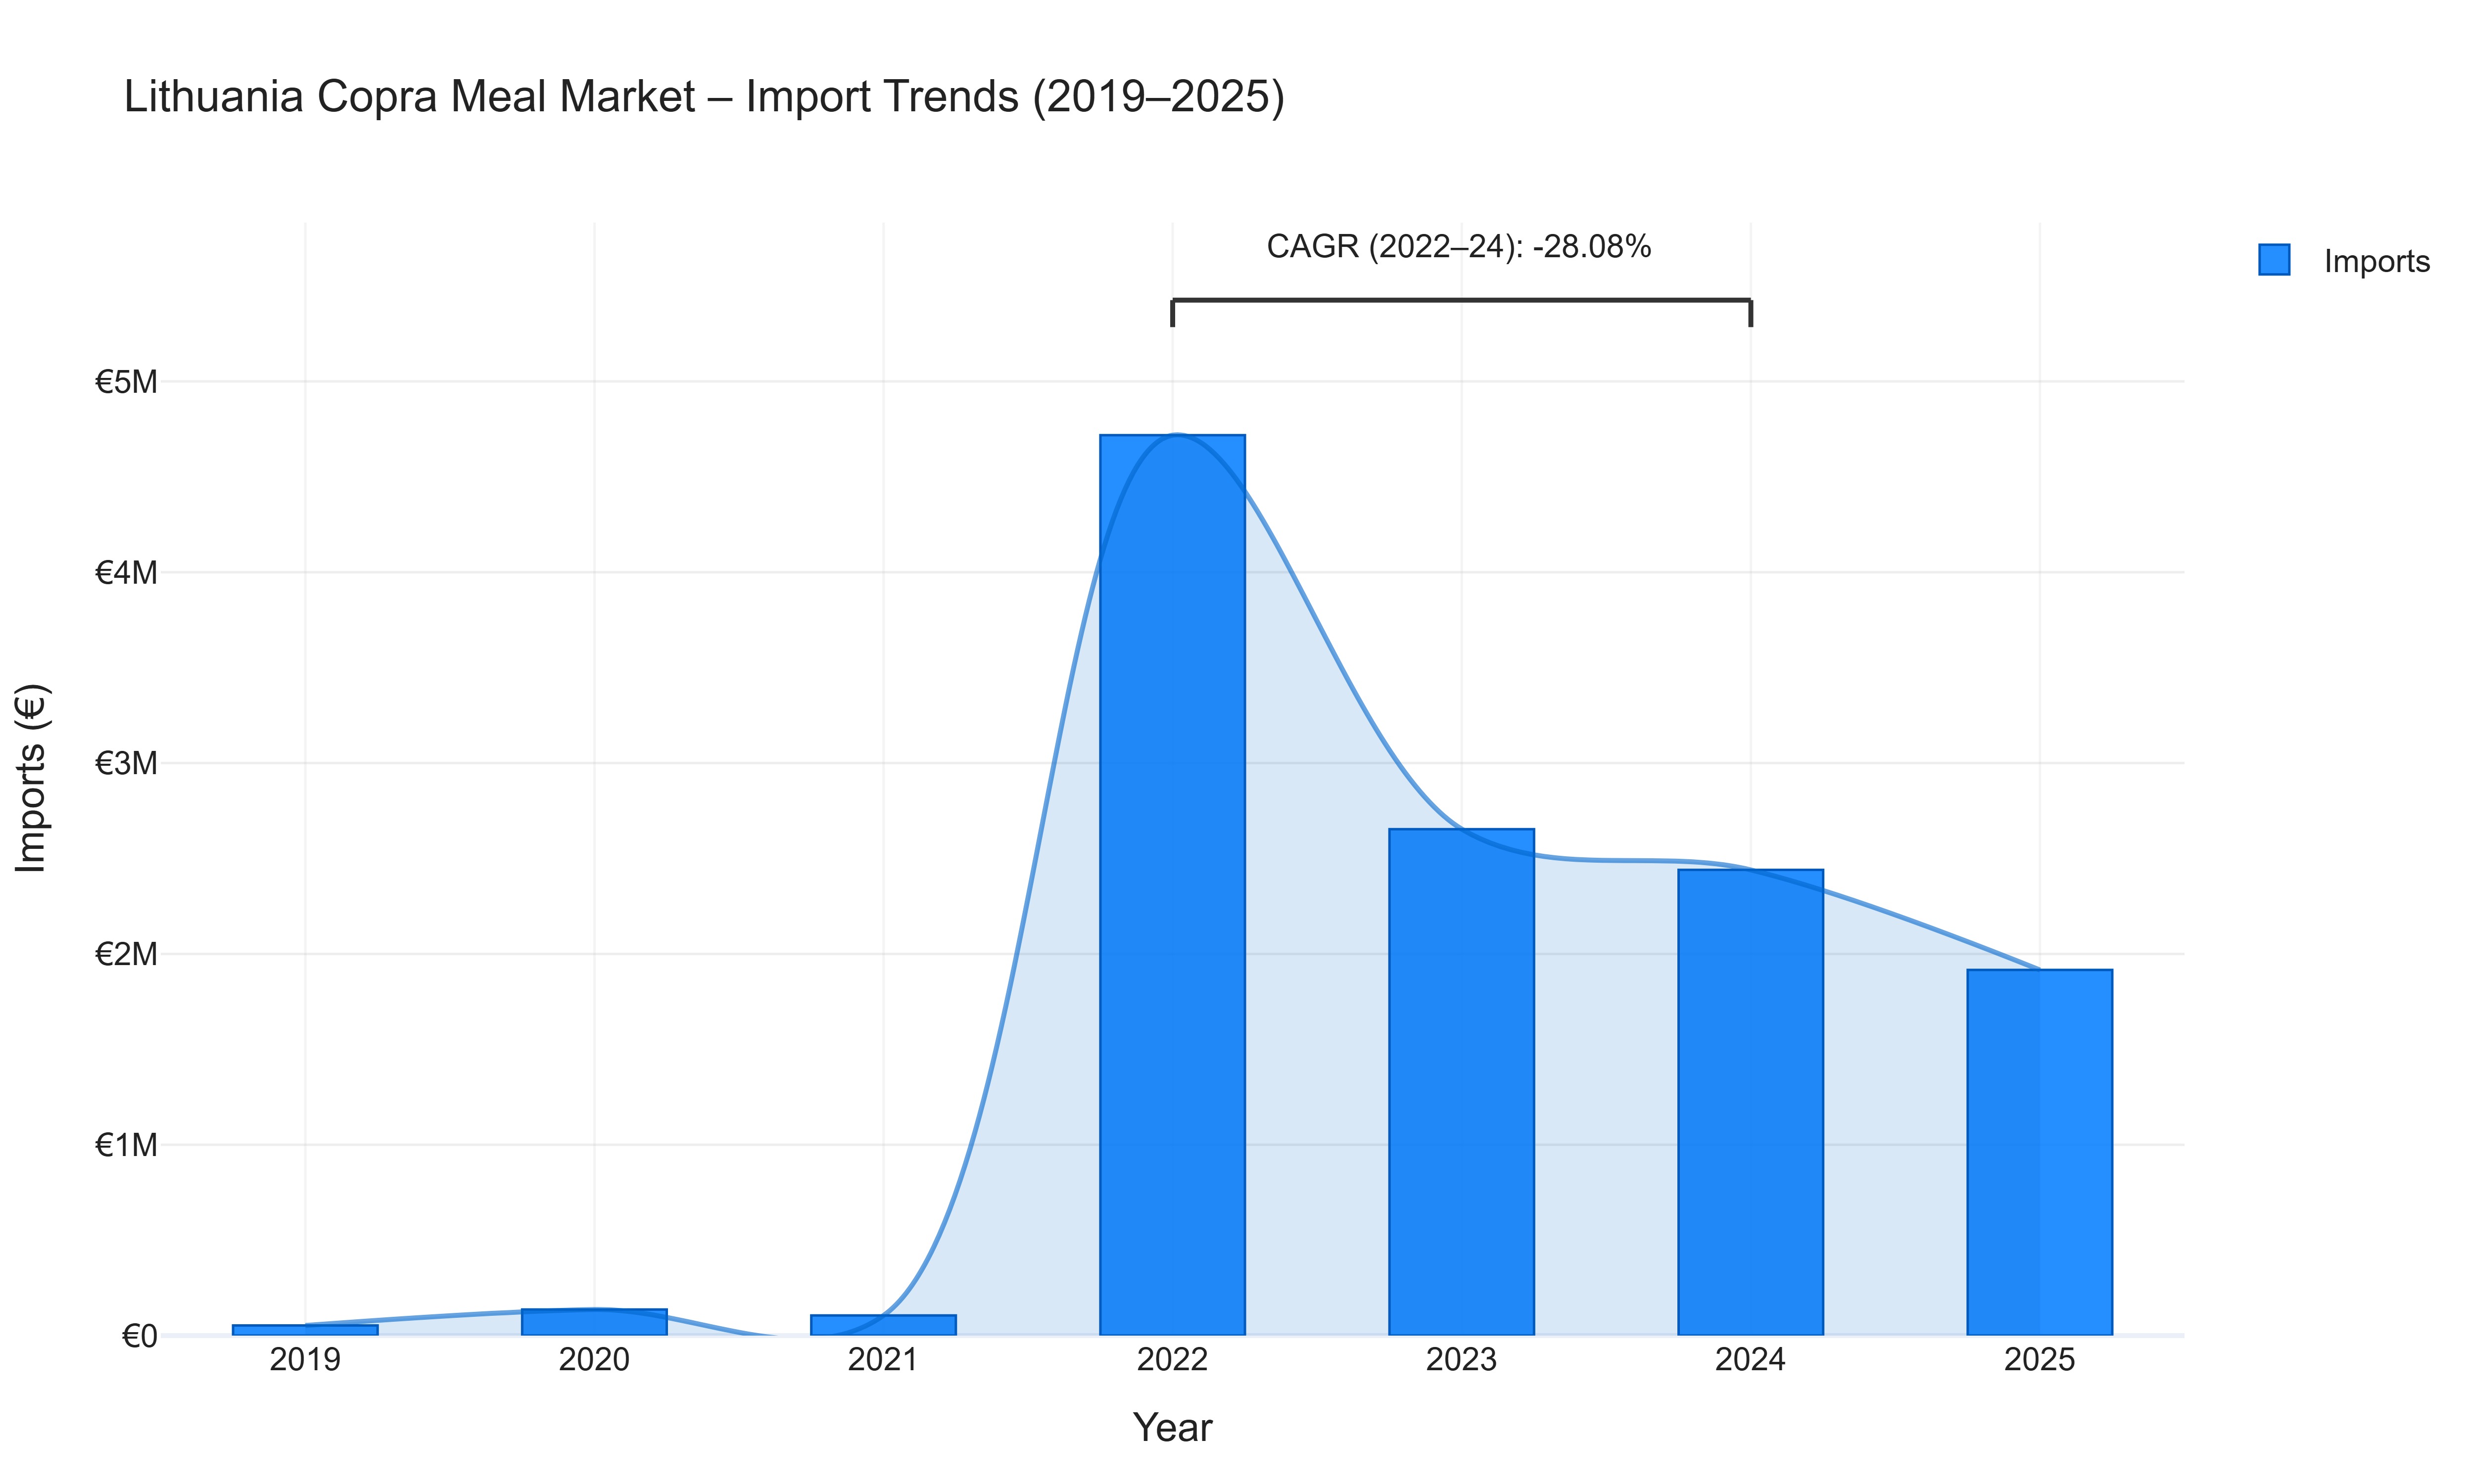
In the Lithuania Copra Meal Market, import values have shown significant fluctuations in recent years. The import value surged by 158.70% in 2020, reaching €136.72 thousand, indicating a sudden spike in demand. This growth trend continued into 2022, with a remarkable increase of 4367.16% to €4.72 million, possibly driven by evolving consumer preferences or supply chain enhancements. However, a sharp decline followed in 2023 and 2025, with import values plummeting by -43.75% and -21.48%, respectively. These contractions could be attributed to market saturation or changes in sourcing strategies. The calculated CAGR of -28.08% from 2022 to 2024 reflects the market's overall downward trend, indicating a challenging period for import activities during this time frame. As such, stakeholders may need to reassess their strategies to navigate the market landscape effectively.
Key Highlights of the Report:
- Lithuania Copra Meal Market Outlook
- Market Size of Lithuania Copra Meal Market, 2025
- Forecast of Lithuania Copra Meal Market, 2032
- Historical Data and Forecast of Lithuania Copra Meal Revenues & Volume for the Period 2022 - 2032F
- Lithuania Copra Meal Market Trend Evolution
- Lithuania Copra Meal Market Drivers and Challenges
- Lithuania Copra Meal Price Trends
- Lithuania Copra Meal Porter's Five Forces
- Lithuania Copra Meal Industry Life Cycle
- Historical Data and Forecast of Lithuania Copra Meal Market Revenues & Volume By Form for the Period 2022 - 2032F
- Historical Data and Forecast of Lithuania Copra Meal Market Revenues & Volume By Pellets for the Period 2022 - 2032F
- Historical Data and Forecast of Lithuania Copra Meal Market Revenues & Volume By Powder for the Period 2022 - 2032F
- Historical Data and Forecast of Lithuania Copra Meal Market Revenues & Volume By Granules for the Period 2022 - 2032F
- Historical Data and Forecast of Lithuania Copra Meal Market Revenues & Volume By Others for the Period 2022 - 2032F
- Historical Data and Forecast of Lithuania Copra Meal Market Revenues & Volume By Application for the Period 2022 - 2032F
- Historical Data and Forecast of Lithuania Copra Meal Market Revenues & Volume By Animal Feed for the Period 2022 - 2032F
- Historical Data and Forecast of Lithuania Copra Meal Market Revenues & Volume By Organic Fertilizer for the Period 2022 - 2032F
- Historical Data and Forecast of Lithuania Copra Meal Market Revenues & Volume By Industrial Use for the Period 2022 - 2032F
- Historical Data and Forecast of Lithuania Copra Meal Market Revenues & Volume By Others for the Period 2022 - 2032F
- Historical Data and Forecast of Lithuania Copra Meal Market Revenues & Volume By End User for the Period 2022 - 2032F
- Historical Data and Forecast of Lithuania Copra Meal Market Revenues & Volume By Livestock for the Period 2022 - 2032F
- Historical Data and Forecast of Lithuania Copra Meal Market Revenues & Volume By Agriculture for the Period 2022 - 2032F
- Historical Data and Forecast of Lithuania Copra Meal Market Revenues & Volume By Biofuel for the Period 2022 - 2032F
- Historical Data and Forecast of Lithuania Copra Meal Market Revenues & Volume By Others for the Period 2022 - 2032F
- Historical Data and Forecast of Lithuania Copra Meal Market Revenues & Volume By Processing Method for the Period 2022 - 2032F
- Historical Data and Forecast of Lithuania Copra Meal Market Revenues & Volume By Mechanical Pressing for the Period 2022 - 2032F
- Historical Data and Forecast of Lithuania Copra Meal Market Revenues & Volume By Solvent Extraction for the Period 2022 - 2032F
- Historical Data and Forecast of Lithuania Copra Meal Market Revenues & Volume By Cold Pressing for the Period 2022 - 2032F
- Historical Data and Forecast of Lithuania Copra Meal Market Revenues & Volume By Others for the Period 2022 - 2032F
- Historical Data and Forecast of Lithuania Copra Meal Market Revenues & Volume By Distribution Channel for the Period 2022 - 2032F
- Historical Data and Forecast of Lithuania Copra Meal Market Revenues & Volume By Wholesale for the Period 2022 - 2032F
- Historical Data and Forecast of Lithuania Copra Meal Market Revenues & Volume By Direct Sales for the Period 2022 - 2032F
- Historical Data and Forecast of Lithuania Copra Meal Market Revenues & Volume By Distributors for the Period 2022 - 2032F
- Historical Data and Forecast of Lithuania Copra Meal Market Revenues & Volume By Others for the Period 2022 - 2032F
- Lithuania Copra Meal Import Export Trade Statistics
- Market Opportunity Assessment By Form
- Market Opportunity Assessment By Application
- Market Opportunity Assessment By End User
- Market Opportunity Assessment By Processing Method
- Market Opportunity Assessment By Distribution Channel
- Lithuania Copra Meal Top Companies Market Share
- Lithuania Copra Meal Competitive Benchmarking By Technical and Operational Parameters
- Lithuania Copra Meal Company Profiles
- Lithuania Copra Meal Key Strategic Recommendations
Frequently Asked Questions About the Market Study (FAQs):
6Wresearch actively monitors the Lithuania Copra Meal Market and publishes its comprehensive annual report, highlighting emerging trends, growth drivers, revenue analysis, and forecast outlook. Our insights help businesses to make data-backed strategic decisions with ongoing market dynamics. Our analysts track relevent industries related to the Lithuania Copra Meal Market, allowing our clients with actionable intelligence and reliable forecasts tailored to emerging regional needs.
Yes, we provide customisation as per your requirements. To learn more, feel free to contact us on sales@6wresearch.com
1 Executive Summary |
2 Introduction |
2.1 Key Highlights of the Report |
2.2 Report Description |
2.3 Market Scope & Segmentation |
2.4 Research Methodology |
2.5 Assumptions |
3 Lithuania Copra Meal Market Overview |
3.1 Lithuania Country Macro Economic Indicators |
3.2 Lithuania Copra Meal Market Revenues & Volume, 2022 & 2032F |
3.3 Lithuania Copra Meal Market - Industry Life Cycle |
3.4 Lithuania Copra Meal Market - Porter's Five Forces |
3.5 Lithuania Copra Meal Market Revenues & Volume Share, By Form, 2022 & 2032F |
3.6 Lithuania Copra Meal Market Revenues & Volume Share, By Application, 2022 & 2032F |
3.7 Lithuania Copra Meal Market Revenues & Volume Share, By End User, 2022 & 2032F |
3.8 Lithuania Copra Meal Market Revenues & Volume Share, By Processing Method, 2022 & 2032F |
3.9 Lithuania Copra Meal Market Revenues & Volume Share, By Distribution Channel, 2022 & 2032F |
4 Lithuania Copra Meal Market Dynamics |
4.1 Impact Analysis |
4.2 Market Drivers |
4.2.1 Growing demand for organic and sustainable animal feed ingredients |
4.2.2 Increasing awareness about the benefits of copra meal in livestock nutrition |
4.2.3 Rising focus on reducing carbon footprint in agriculture sector |
4.3 Market Restraints |
4.3.1 Fluctuations in copra production and prices |
4.3.2 Competition from alternative animal feed ingredients like soybean meal |
4.3.3 Regulatory challenges in terms of import/export restrictions or quality standards |
5 Lithuania Copra Meal Market Trends |
6 Lithuania Copra Meal Market, By Types |
6.1 Lithuania Copra Meal Market, By Form |
6.1.1 Overview and Analysis |
6.1.2 Lithuania Copra Meal Market Revenues & Volume, By Form, 2022 - 2032F |
6.1.3 Lithuania Copra Meal Market Revenues & Volume, By Pellets, 2022 - 2032F |
6.1.4 Lithuania Copra Meal Market Revenues & Volume, By Powder, 2022 - 2032F |
6.1.5 Lithuania Copra Meal Market Revenues & Volume, By Granules, 2022 - 2032F |
6.1.6 Lithuania Copra Meal Market Revenues & Volume, By Others, 2022 - 2032F |
6.2 Lithuania Copra Meal Market, By Application |
6.2.1 Overview and Analysis |
6.2.2 Lithuania Copra Meal Market Revenues & Volume, By Animal Feed, 2022 - 2032F |
6.2.3 Lithuania Copra Meal Market Revenues & Volume, By Organic Fertilizer, 2022 - 2032F |
6.2.4 Lithuania Copra Meal Market Revenues & Volume, By Industrial Use, 2022 - 2032F |
6.2.5 Lithuania Copra Meal Market Revenues & Volume, By Others, 2022 - 2032F |
6.3 Lithuania Copra Meal Market, By End User |
6.3.1 Overview and Analysis |
6.3.2 Lithuania Copra Meal Market Revenues & Volume, By Livestock, 2022 - 2032F |
6.3.3 Lithuania Copra Meal Market Revenues & Volume, By Agriculture, 2022 - 2032F |
6.3.4 Lithuania Copra Meal Market Revenues & Volume, By Biofuel, 2022 - 2032F |
6.3.5 Lithuania Copra Meal Market Revenues & Volume, By Others, 2022 - 2032F |
6.4 Lithuania Copra Meal Market, By Processing Method |
6.4.1 Overview and Analysis |
6.4.2 Lithuania Copra Meal Market Revenues & Volume, By Mechanical Pressing, 2022 - 2032F |
6.4.3 Lithuania Copra Meal Market Revenues & Volume, By Solvent Extraction, 2022 - 2032F |
6.4.4 Lithuania Copra Meal Market Revenues & Volume, By Cold Pressing, 2022 - 2032F |
6.4.5 Lithuania Copra Meal Market Revenues & Volume, By Others, 2022 - 2032F |
6.5 Lithuania Copra Meal Market, By Distribution Channel |
6.5.1 Overview and Analysis |
6.5.2 Lithuania Copra Meal Market Revenues & Volume, By Wholesale, 2022 - 2032F |
6.5.3 Lithuania Copra Meal Market Revenues & Volume, By Direct Sales, 2022 - 2032F |
6.5.4 Lithuania Copra Meal Market Revenues & Volume, By Distributors, 2022 - 2032F |
6.5.5 Lithuania Copra Meal Market Revenues & Volume, By Others, 2022 - 2032F |
7 Lithuania Copra Meal Market Import-Export Trade Statistics |
7.1 Lithuania Copra Meal Market Export to Major Countries |
7.2 Lithuania Copra Meal Market Imports from Major Countries |
8 Lithuania Copra Meal Market Key Performance Indicators |
8.1 Average copra meal price trends |
8.2 Adoption rate of copra meal in animal feed formulations |
8.3 Number of research studies or publications validating the benefits of copra meal as a feed ingredient |
9 Lithuania Copra Meal Market - Opportunity Assessment |
9.1 Lithuania Copra Meal Market Opportunity Assessment, By Form, 2022 & 2032F |
9.2 Lithuania Copra Meal Market Opportunity Assessment, By Application, 2022 & 2032F |
9.3 Lithuania Copra Meal Market Opportunity Assessment, By End User, 2022 & 2032F |
9.4 Lithuania Copra Meal Market Opportunity Assessment, By Processing Method, 2022 & 2032F |
9.5 Lithuania Copra Meal Market Opportunity Assessment, By Distribution Channel, 2022 & 2032F |
10 Lithuania Copra Meal Market - Competitive Landscape |
10.1 Lithuania Copra Meal Market Revenue Share, By Companies, 2025 |
10.2 Lithuania Copra Meal Market Competitive Benchmarking, By Operating and Technical Parameters |
11 Company Profiles |
12 Recommendations |
13 Disclaimer |
Global Go To Market Strategy - 2030
Export potential enables firms to identify high-growth global markets with greater confidence by combining advanced trade intelligence with a structured quantitative methodology. The framework analyzes emerging demand trends and country-level import patterns while integrating macroeconomic and trade datasets such as GDP and population forecasts, bilateral import–export flows, tariff structures, elasticity differentials between developed and developing economies, geographic distance, and import demand projections. Using weighted trade values from 2020–2024 as the base period to project country-to-country export potential for 2030, these inputs are operationalized through calculated drivers such as gravity model parameters, tariff impact factors, and projected GDP per-capita growth. Through an analysis of hidden potentials, demand hotspots, and market conditions that are most favorable to success, this method enables firms to focus on target countries, maximize returns, and global expansion with data, backed by accuracy.
By factoring in the projected importer demand gap that is currently unmet and could be potential opportunity, it identifies the potential for the Exporter (Country) among 190 countries, against the general trade analysis, which identifies the biggest importer or exporter.
To discover high-growth global markets and optimize your business strategy:
Click Here
Pricing
- Single User License$ 1,995
- Department License$ 2,400
- Site License$ 3,120
- Global License$ 3,795

Leadership Perspectives from Industry Events
Search
Thought Leadership and Analyst Meet


Our Clients
6WResearch In News
- India Export Attractiveness Tracker 2026
- India Air Conditioner Market Set for Strong Rebound in 2026 After Weather-Led Correction and GST-Driven Recovery: 6Wresearch
- ADAS in India: How Automatic Emergency Braking, Blind Spot Detection & Driver Monitoring are Transforming Road Safety
- Doha a strategic location for EV manufacturing hub: IPA Qatar
- Demand for luxury TVs surging in the GCC, says Samsung
- Empowering Growth: The Thriving Journey of Bangladesh’s Cable Industry
Latest Reports
- Nicaragua RPG Gaming Market (2026-2032)
- New Zealand RPG Gaming Market (2026-2032)
- Netherlands RPG Gaming Market (2026-2032)
- Nauru RPG Gaming Market (2026-2032)
- Namibia RPG Gaming Market (2026-2032)
- Mozambique RPG Gaming Market (2026-2032)
- Montenegro RPG Gaming Market (2026-2032)
- Mongolia RPG Gaming Market (2026-2032)
- Monaco RPG Gaming Market (2026-2032)
- Micronesia RPG Gaming Market (2026-2032)
Industry Events and Analyst Meet

EV India Expo 2026

HIMTEX 2026

India Refining Summit 2026

India EV Show 2026

EV tech India Expo 2026
Whitepaper
- Middle East & Africa Commercial Security Market Click here to view more.
- Middle East & Africa Fire Safety Systems & Equipment Market Click here to view more.
- GCC Drone Market Click here to view more.
- Middle East Lighting Fixture Market Click here to view more.
- GCC Physical & Perimeter Security Market Click here to view more.