Lithuania Corn Bran Market (2026-2032) | Share, Industry, Trends, Segmentation, Competitive Landscape, Size & Revenue, Analysis, Outlook, Companies, Value, Forecast, Growth
Market Forecast By Type (Yellow Corn, White Corn), By Certification Type (Non-GMO, GMO), By Nature (Organic, Conventional), By Application (Industrial, Retail, Food Services, Others) And Competitive Landscape
| Product Code: ETC8038372 | Publication Date: Sep 2024 | Updated Date: Apr 2026 | Product Type: Market Research Report | |
| Publisher: 6Wresearch | Author: Vasudha | No. of Pages: 75 | No. of Figures: 35 | No. of Tables: 20 |
Lithuania Corn Bran Market Size (2020-2030)
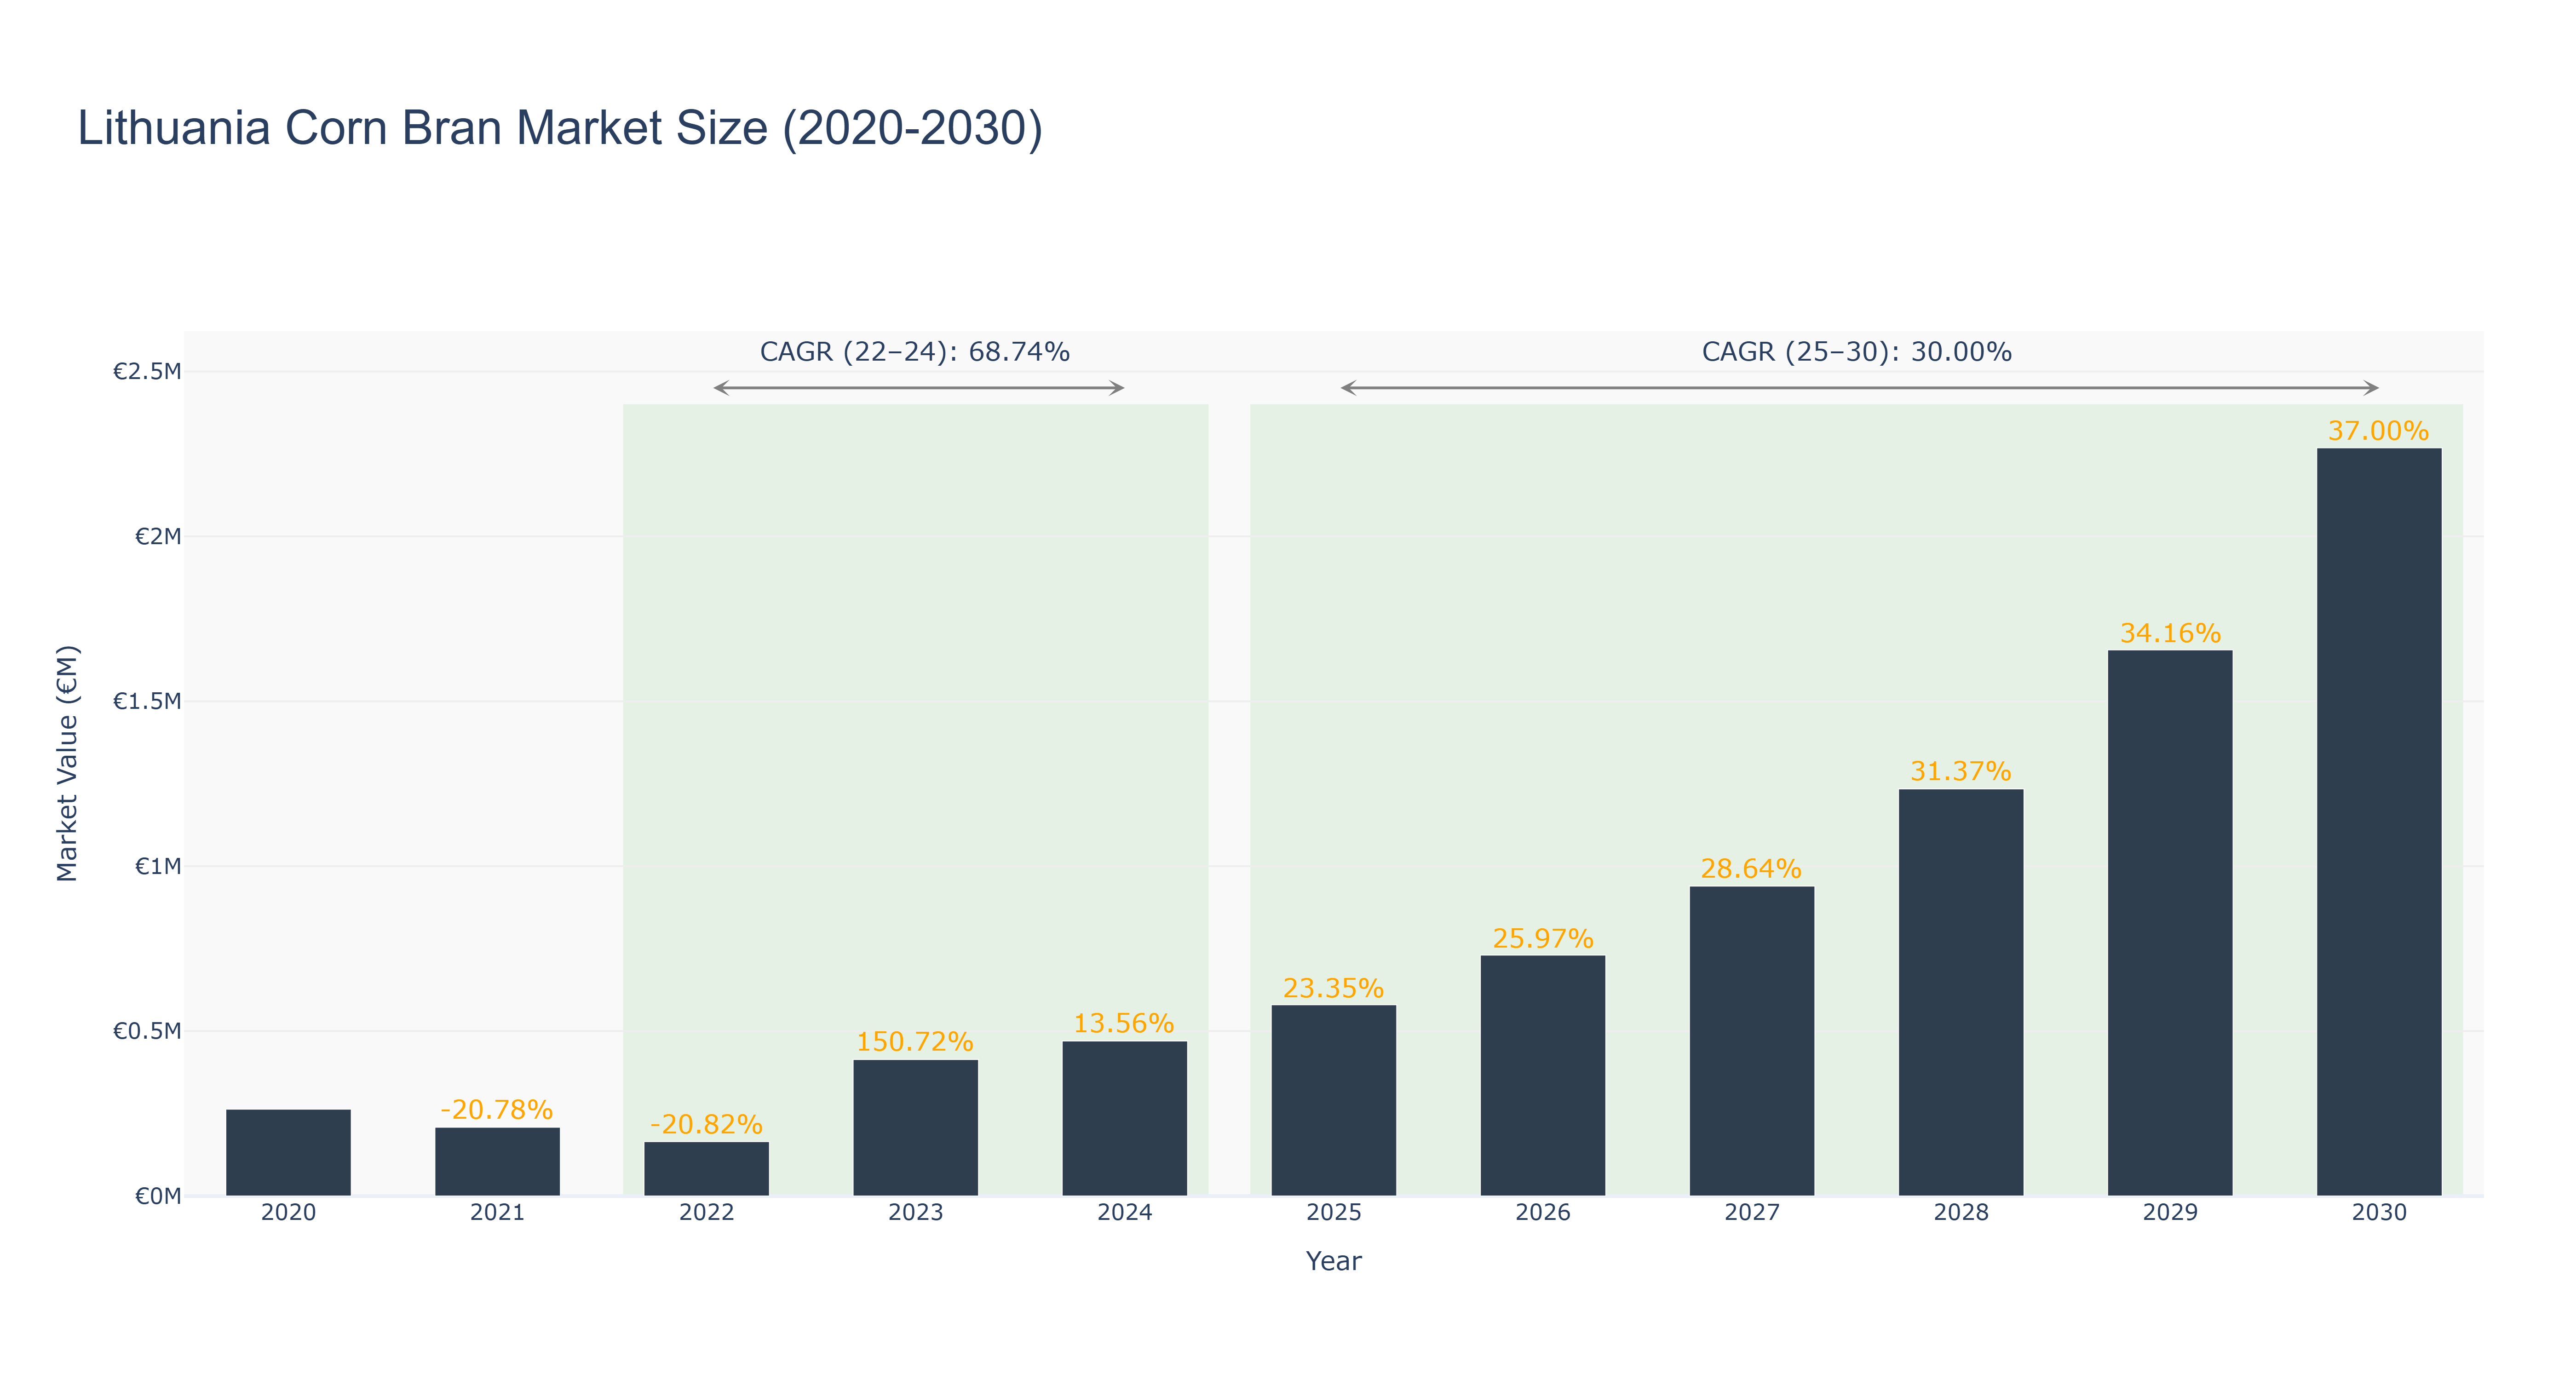
The Lithuania Corn Bran Market experienced a significant decline in market size from €0.26 million in 2020 to €0.17 million in 2022, attributed to economic factors and changing consumer preferences. However, from 2023 onwards, the market witnessed a remarkable recovery and growth, reaching €2.27 million in 2030. The CAGR for the period 2022-24 was 68.74%, reflecting a rapid expansion phase, while the CAGR for 2025-30 is projected at 30.0%, indicating sustained growth momentum. Industry drivers such as increasing health consciousness and demand for natural food products have been key factors in driving this market trend. Looking ahead, Lithuania is set to implement new agricultural policies aimed at promoting sustainable farming practices, which is expected to further boost the Corn Bran Market in the coming years.
Lithuania Corn Bran Market: Production & Trade Performance (2019-2025)
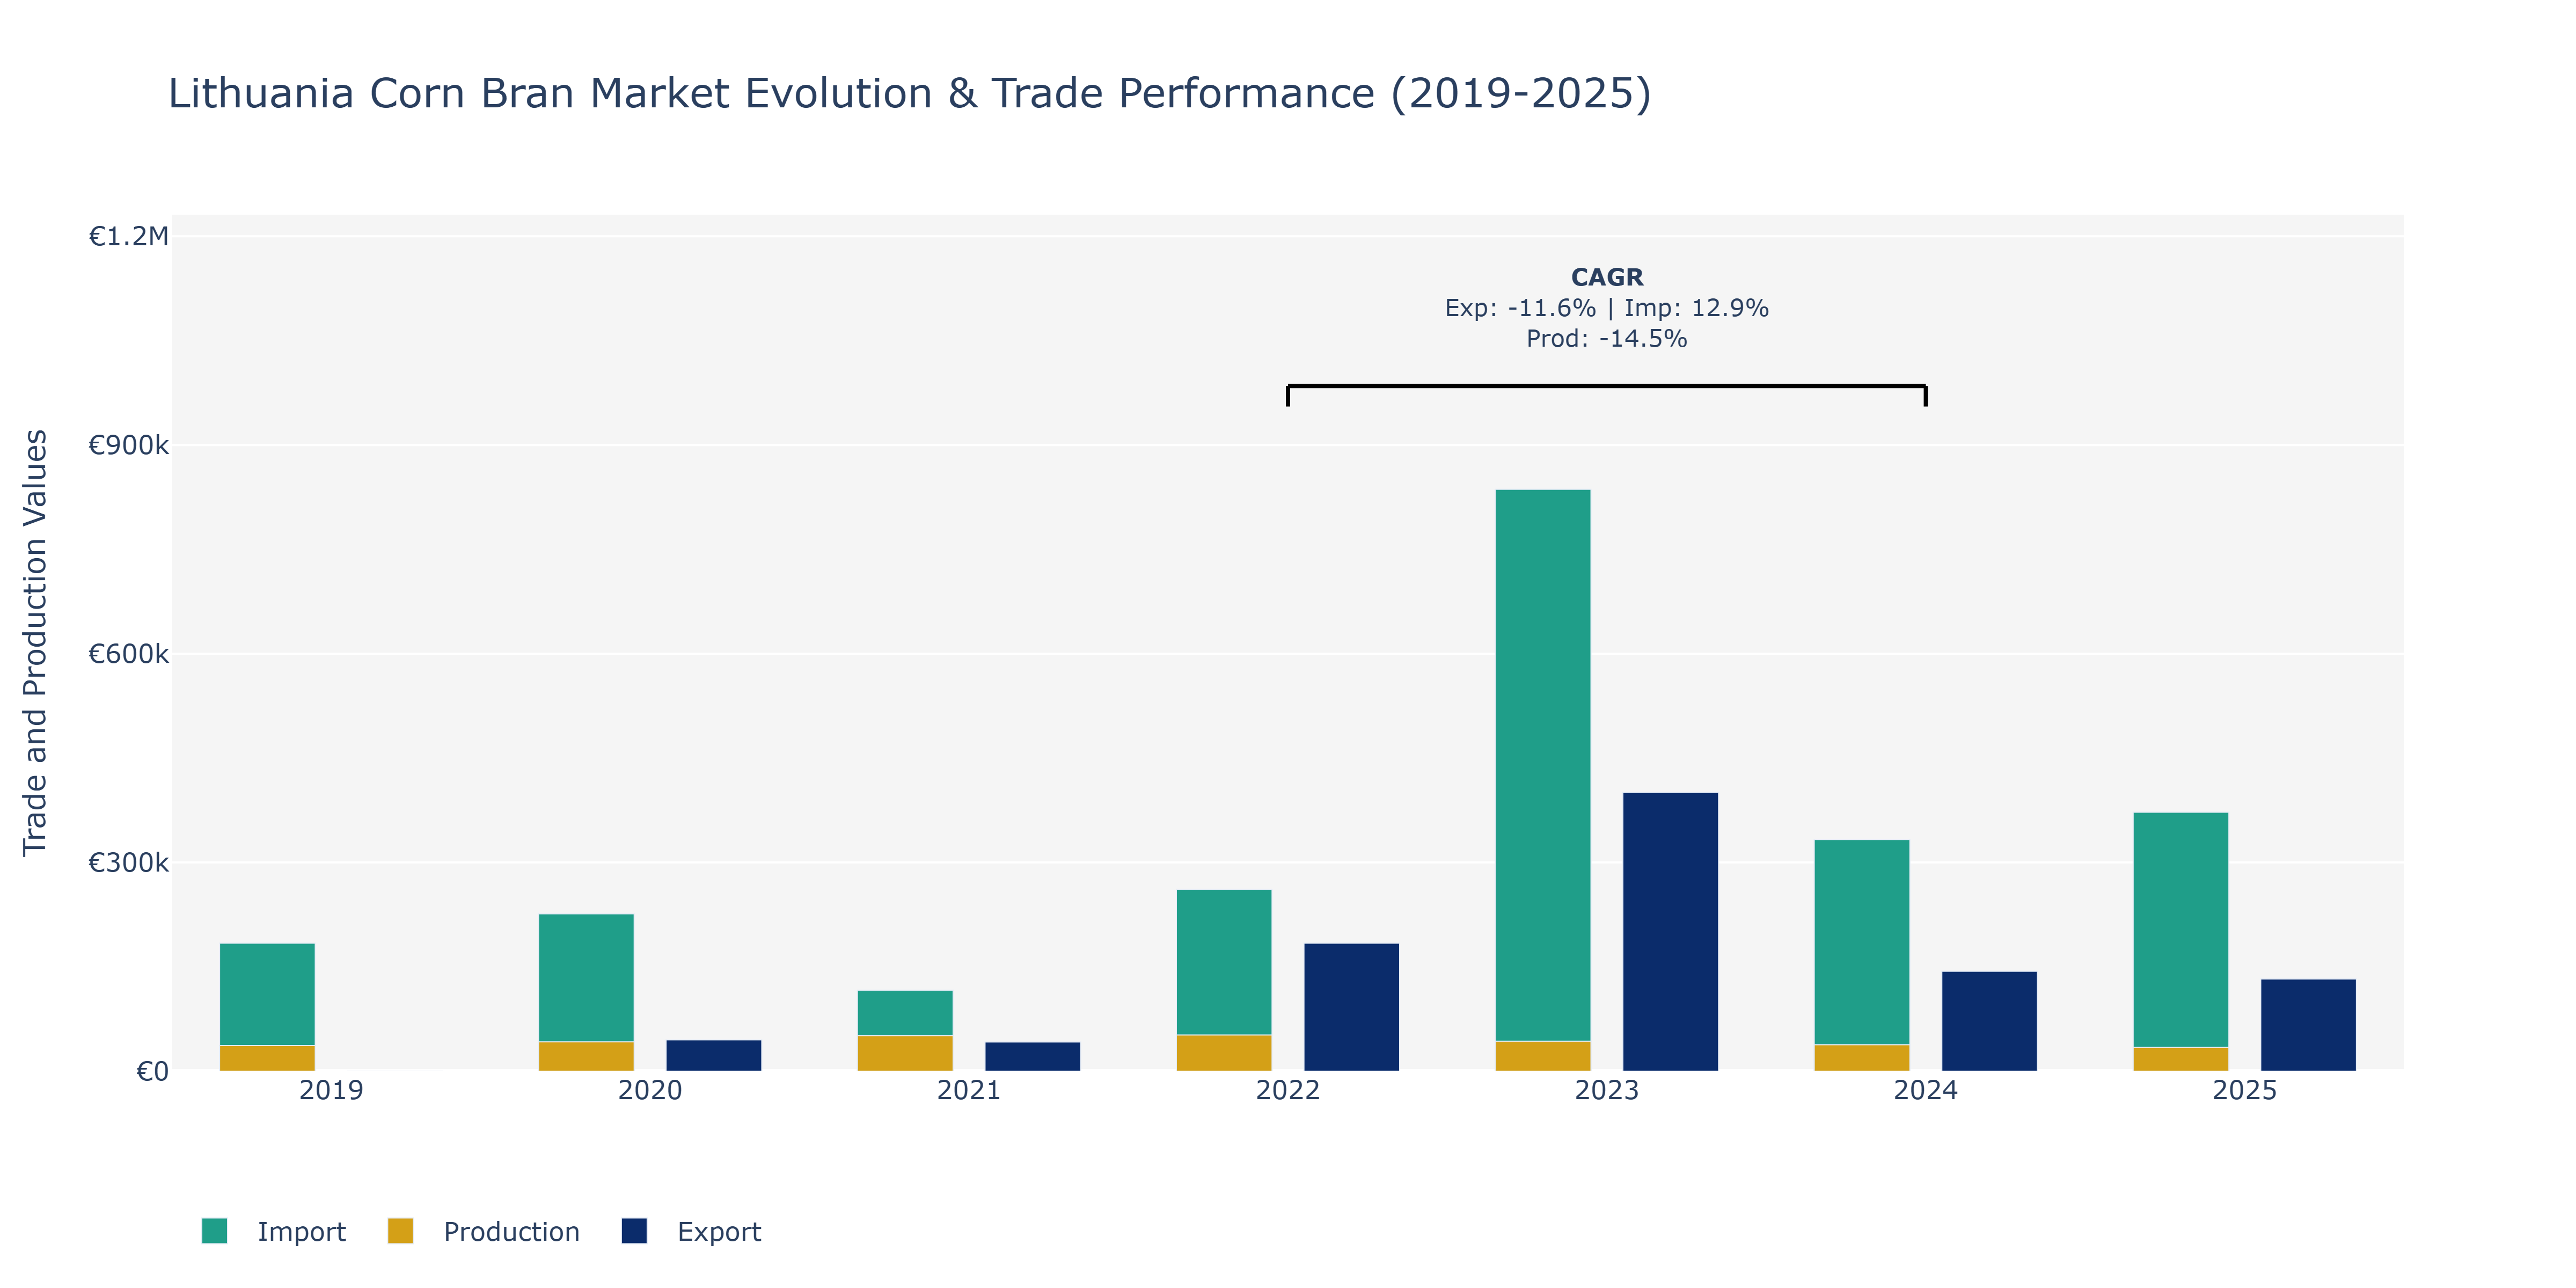
In the Lithuania Corn Bran Market, exports experienced fluctuations over the years, with a peak in 2023 at €400.60 thousand. This surge may be attributed to increased demand from international markets due to the product's nutritional benefits and growing consumer awareness of health-conscious food choices. On the other hand, imports consistently rose annually, reaching €836.34 thousand in 2023, indicating a reliance on external sources for corn bran supply, potentially influenced by domestic production capacity constraints or cost-efficiency considerations. Production levels fluctuated, with a notable decline to €34.15 thousand in 2025, possibly due to unfavorable weather conditions impacting crop yields or shifts in resource allocation towards other agricultural products. These trends highlight the market's exposure to both domestic and global factors, emphasizing the need for strategic supply chain management and investment in local production capabilities to enhance market stability and competitiveness.
Key Highlights of the Report:
- Lithuania Corn Bran Market Outlook
- Market Size of Lithuania Corn Bran Market, 2025
- Forecast of Lithuania Corn Bran Market, 2032
- Historical Data and Forecast of Lithuania Corn Bran Revenues & Volume for the Period 2022 - 2032
- Lithuania Corn Bran Market Trend Evolution
- Lithuania Corn Bran Market Drivers and Challenges
- Lithuania Corn Bran Price Trends
- Lithuania Corn Bran Porter's Five Forces
- Lithuania Corn Bran Industry Life Cycle
- Historical Data and Forecast of Lithuania Corn Bran Market Revenues & Volume By Type for the Period 2022 - 2032
- Historical Data and Forecast of Lithuania Corn Bran Market Revenues & Volume By Yellow Corn for the Period 2022 - 2032
- Historical Data and Forecast of Lithuania Corn Bran Market Revenues & Volume By White Corn for the Period 2022 - 2032
- Historical Data and Forecast of Lithuania Corn Bran Market Revenues & Volume By Certification Type for the Period 2022 - 2032
- Historical Data and Forecast of Lithuania Corn Bran Market Revenues & Volume By Non-GMO for the Period 2022 - 2032
- Historical Data and Forecast of Lithuania Corn Bran Market Revenues & Volume By GMO for the Period 2022 - 2032
- Historical Data and Forecast of Lithuania Corn Bran Market Revenues & Volume By Nature for the Period 2022 - 2032
- Historical Data and Forecast of Lithuania Corn Bran Market Revenues & Volume By Organic for the Period 2022 - 2032
- Historical Data and Forecast of Lithuania Corn Bran Market Revenues & Volume By Conventional for the Period 2022 - 2032
- Historical Data and Forecast of Lithuania Corn Bran Market Revenues & Volume By Application for the Period 2022 - 2032
- Historical Data and Forecast of Lithuania Corn Bran Market Revenues & Volume By Industrial for the Period 2022 - 2032
- Historical Data and Forecast of Lithuania Corn Bran Market Revenues & Volume By Retail for the Period 2022 - 2032
- Historical Data and Forecast of Lithuania Corn Bran Market Revenues & Volume By Food Services for the Period 2022 - 2032
- Historical Data and Forecast of Lithuania Corn Bran Market Revenues & Volume By Others for the Period 2022 - 2032
- Lithuania Corn Bran Import Export Trade Statistics
- Market Opportunity Assessment By Type
- Market Opportunity Assessment By Certification Type
- Market Opportunity Assessment By Nature
- Market Opportunity Assessment By Application
- Lithuania Corn Bran Top Companies Market Share
- Lithuania Corn Bran Competitive Benchmarking By Technical and Operational Parameters
- Lithuania Corn Bran Company Profiles
- Lithuania Corn Bran Key Strategic Recommendations
Frequently Asked Questions About the Market Study (FAQs):
6Wresearch actively monitors the Lithuania Corn Bran Market and publishes its comprehensive annual report, highlighting emerging trends, growth drivers, revenue analysis, and forecast outlook. Our insights help businesses to make data-backed strategic decisions with ongoing market dynamics. Our analysts track relevent industries related to the Lithuania Corn Bran Market, allowing our clients with actionable intelligence and reliable forecasts tailored to emerging regional needs.
Yes, we provide customisation as per your requirements. To learn more, feel free to contact us on sales@6wresearch.com
1 Executive Summary |
2 Introduction |
2.1 Key Highlights of the Report |
2.2 Report Description |
2.3 Market Scope & Segmentation |
2.4 Research Methodology |
2.5 Assumptions |
3 Lithuania Corn Bran Market Overview |
3.1 Lithuania Country Macro Economic Indicators |
3.2 Lithuania Corn Bran Market Revenues & Volume, 2022 & 2032F |
3.3 Lithuania Corn Bran Market - Industry Life Cycle |
3.4 Lithuania Corn Bran Market - Porter's Five Forces |
3.5 Lithuania Corn Bran Market Revenues & Volume Share, By Type, 2022 & 2032F |
3.6 Lithuania Corn Bran Market Revenues & Volume Share, By Certification Type, 2022 & 2032F |
3.7 Lithuania Corn Bran Market Revenues & Volume Share, By Nature, 2022 & 2032F |
3.8 Lithuania Corn Bran Market Revenues & Volume Share, By Application, 2022 & 2032F |
4 Lithuania Corn Bran Market Dynamics |
4.1 Impact Analysis |
4.2 Market Drivers |
4.3 Market Restraints |
5 Lithuania Corn Bran Market Trends |
6 Lithuania Corn Bran Market, By Types |
6.1 Lithuania Corn Bran Market, By Type |
6.1.1 Overview and Analysis |
6.1.2 Lithuania Corn Bran Market Revenues & Volume, By Type, 2022 - 2032F |
6.1.3 Lithuania Corn Bran Market Revenues & Volume, By Yellow Corn, 2022 - 2032F |
6.1.4 Lithuania Corn Bran Market Revenues & Volume, By White Corn, 2022 - 2032F |
6.2 Lithuania Corn Bran Market, By Certification Type |
6.2.1 Overview and Analysis |
6.2.2 Lithuania Corn Bran Market Revenues & Volume, By Non-GMO, 2022 - 2032F |
6.2.3 Lithuania Corn Bran Market Revenues & Volume, By GMO, 2022 - 2032F |
6.3 Lithuania Corn Bran Market, By Nature |
6.3.1 Overview and Analysis |
6.3.2 Lithuania Corn Bran Market Revenues & Volume, By Organic, 2022 - 2032F |
6.3.3 Lithuania Corn Bran Market Revenues & Volume, By Conventional, 2022 - 2032F |
6.4 Lithuania Corn Bran Market, By Application |
6.4.1 Overview and Analysis |
6.4.2 Lithuania Corn Bran Market Revenues & Volume, By Industrial, 2022 - 2032F |
6.4.3 Lithuania Corn Bran Market Revenues & Volume, By Retail, 2022 - 2032F |
6.4.4 Lithuania Corn Bran Market Revenues & Volume, By Food Services, 2022 - 2032F |
6.4.5 Lithuania Corn Bran Market Revenues & Volume, By Others, 2022 - 2032F |
7 Lithuania Corn Bran Market Import-Export Trade Statistics |
7.1 Lithuania Corn Bran Market Export to Major Countries |
7.2 Lithuania Corn Bran Market Imports from Major Countries |
8 Lithuania Corn Bran Market Key Performance Indicators |
9 Lithuania Corn Bran Market - Opportunity Assessment |
9.1 Lithuania Corn Bran Market Opportunity Assessment, By Type, 2022 & 2032F |
9.2 Lithuania Corn Bran Market Opportunity Assessment, By Certification Type, 2022 & 2032F |
9.3 Lithuania Corn Bran Market Opportunity Assessment, By Nature, 2022 & 2032F |
9.4 Lithuania Corn Bran Market Opportunity Assessment, By Application, 2022 & 2032F |
10 Lithuania Corn Bran Market - Competitive Landscape |
10.1 Lithuania Corn Bran Market Revenue Share, By Companies, 2025 |
10.2 Lithuania Corn Bran Market Competitive Benchmarking, By Operating and Technical Parameters |
11 Company Profiles |
12 Recommendations |
13 Disclaimer |
Global Go To Market Strategy - 2030
Export potential enables firms to identify high-growth global markets with greater confidence by combining advanced trade intelligence with a structured quantitative methodology. The framework analyzes emerging demand trends and country-level import patterns while integrating macroeconomic and trade datasets such as GDP and population forecasts, bilateral import–export flows, tariff structures, elasticity differentials between developed and developing economies, geographic distance, and import demand projections. Using weighted trade values from 2020–2024 as the base period to project country-to-country export potential for 2030, these inputs are operationalized through calculated drivers such as gravity model parameters, tariff impact factors, and projected GDP per-capita growth. Through an analysis of hidden potentials, demand hotspots, and market conditions that are most favorable to success, this method enables firms to focus on target countries, maximize returns, and global expansion with data, backed by accuracy.
By factoring in the projected importer demand gap that is currently unmet and could be potential opportunity, it identifies the potential for the Exporter (Country) among 190 countries, against the general trade analysis, which identifies the biggest importer or exporter.
To discover high-growth global markets and optimize your business strategy:
Click Here
Pricing
- Single User License$ 1,995
- Department License$ 2,400
- Site License$ 3,120
- Global License$ 3,795

Leadership Perspectives from Industry Events
Search
Thought Leadership and Analyst Meet


Our Clients
6WResearch In News
- Doha a strategic location for EV manufacturing hub: IPA Qatar
- Demand for luxury TVs surging in the GCC, says Samsung
- Empowering Growth: The Thriving Journey of Bangladesh’s Cable Industry
- Demand for luxury TVs surging in the GCC, says Samsung
- Video call with a traditional healer? Once unthinkable, it’s now common in South Africa
- Intelligent Buildings To Smooth GCC’s Path To Net Zero
Latest Reports
- New Zealand Aseptic Manufacturing Market (2026-2032)
- Netherlands Aseptic Manufacturing Market (2026-2032)
- Nauru Aseptic Manufacturing Market (2026-2032)
- Namibia Aseptic Manufacturing Market (2026-2032)
- Mozambique Aseptic Manufacturing Market (2026-2032)
- Montenegro Aseptic Manufacturing Market (2026-2032)
- Mongolia Aseptic Manufacturing Market (2026-2032)
- Monaco Aseptic Manufacturing Market (2026-2032)
- Micronesia Aseptic Manufacturing Market (2026-2032)
- Mauritius Aseptic Manufacturing Market (2026-2032)
Industry Events and Analyst Meet

HIMTEX 2026

India Refining Summit 2026

India EV Show 2026

EV tech India Expo 2026

Auto Tech Asia 2026
Whitepaper
- Middle East & Africa Commercial Security Market Click here to view more.
- Middle East & Africa Fire Safety Systems & Equipment Market Click here to view more.
- GCC Drone Market Click here to view more.
- Middle East Lighting Fixture Market Click here to view more.
- GCC Physical & Perimeter Security Market Click here to view more.