Lithuania Electric Radiators Market (2026-2032) | Share, Trends, Growth, Companies, Value, Outlook, Forecast, Revenue, Industry, Segmentation, Size & Analysis
Market Forecast By Type (Fan Heaters, Convention Radiators, Infrared Radiators, Oil-based Radiators), By Application (Residential, Commercial, Industrial) And Competitive Landscape
| Product Code: ETC5116968 | Publication Date: Nov 2023 | Updated Date: Apr 2026 | Product Type: Market Research Report | |
| Publisher: 6Wresearch | Author: Shubham Padhi | No. of Pages: 60 | No. of Figures: 30 | No. of Tables: 5 |
Lithuania Electric Radiators Market Size (2020-2030)
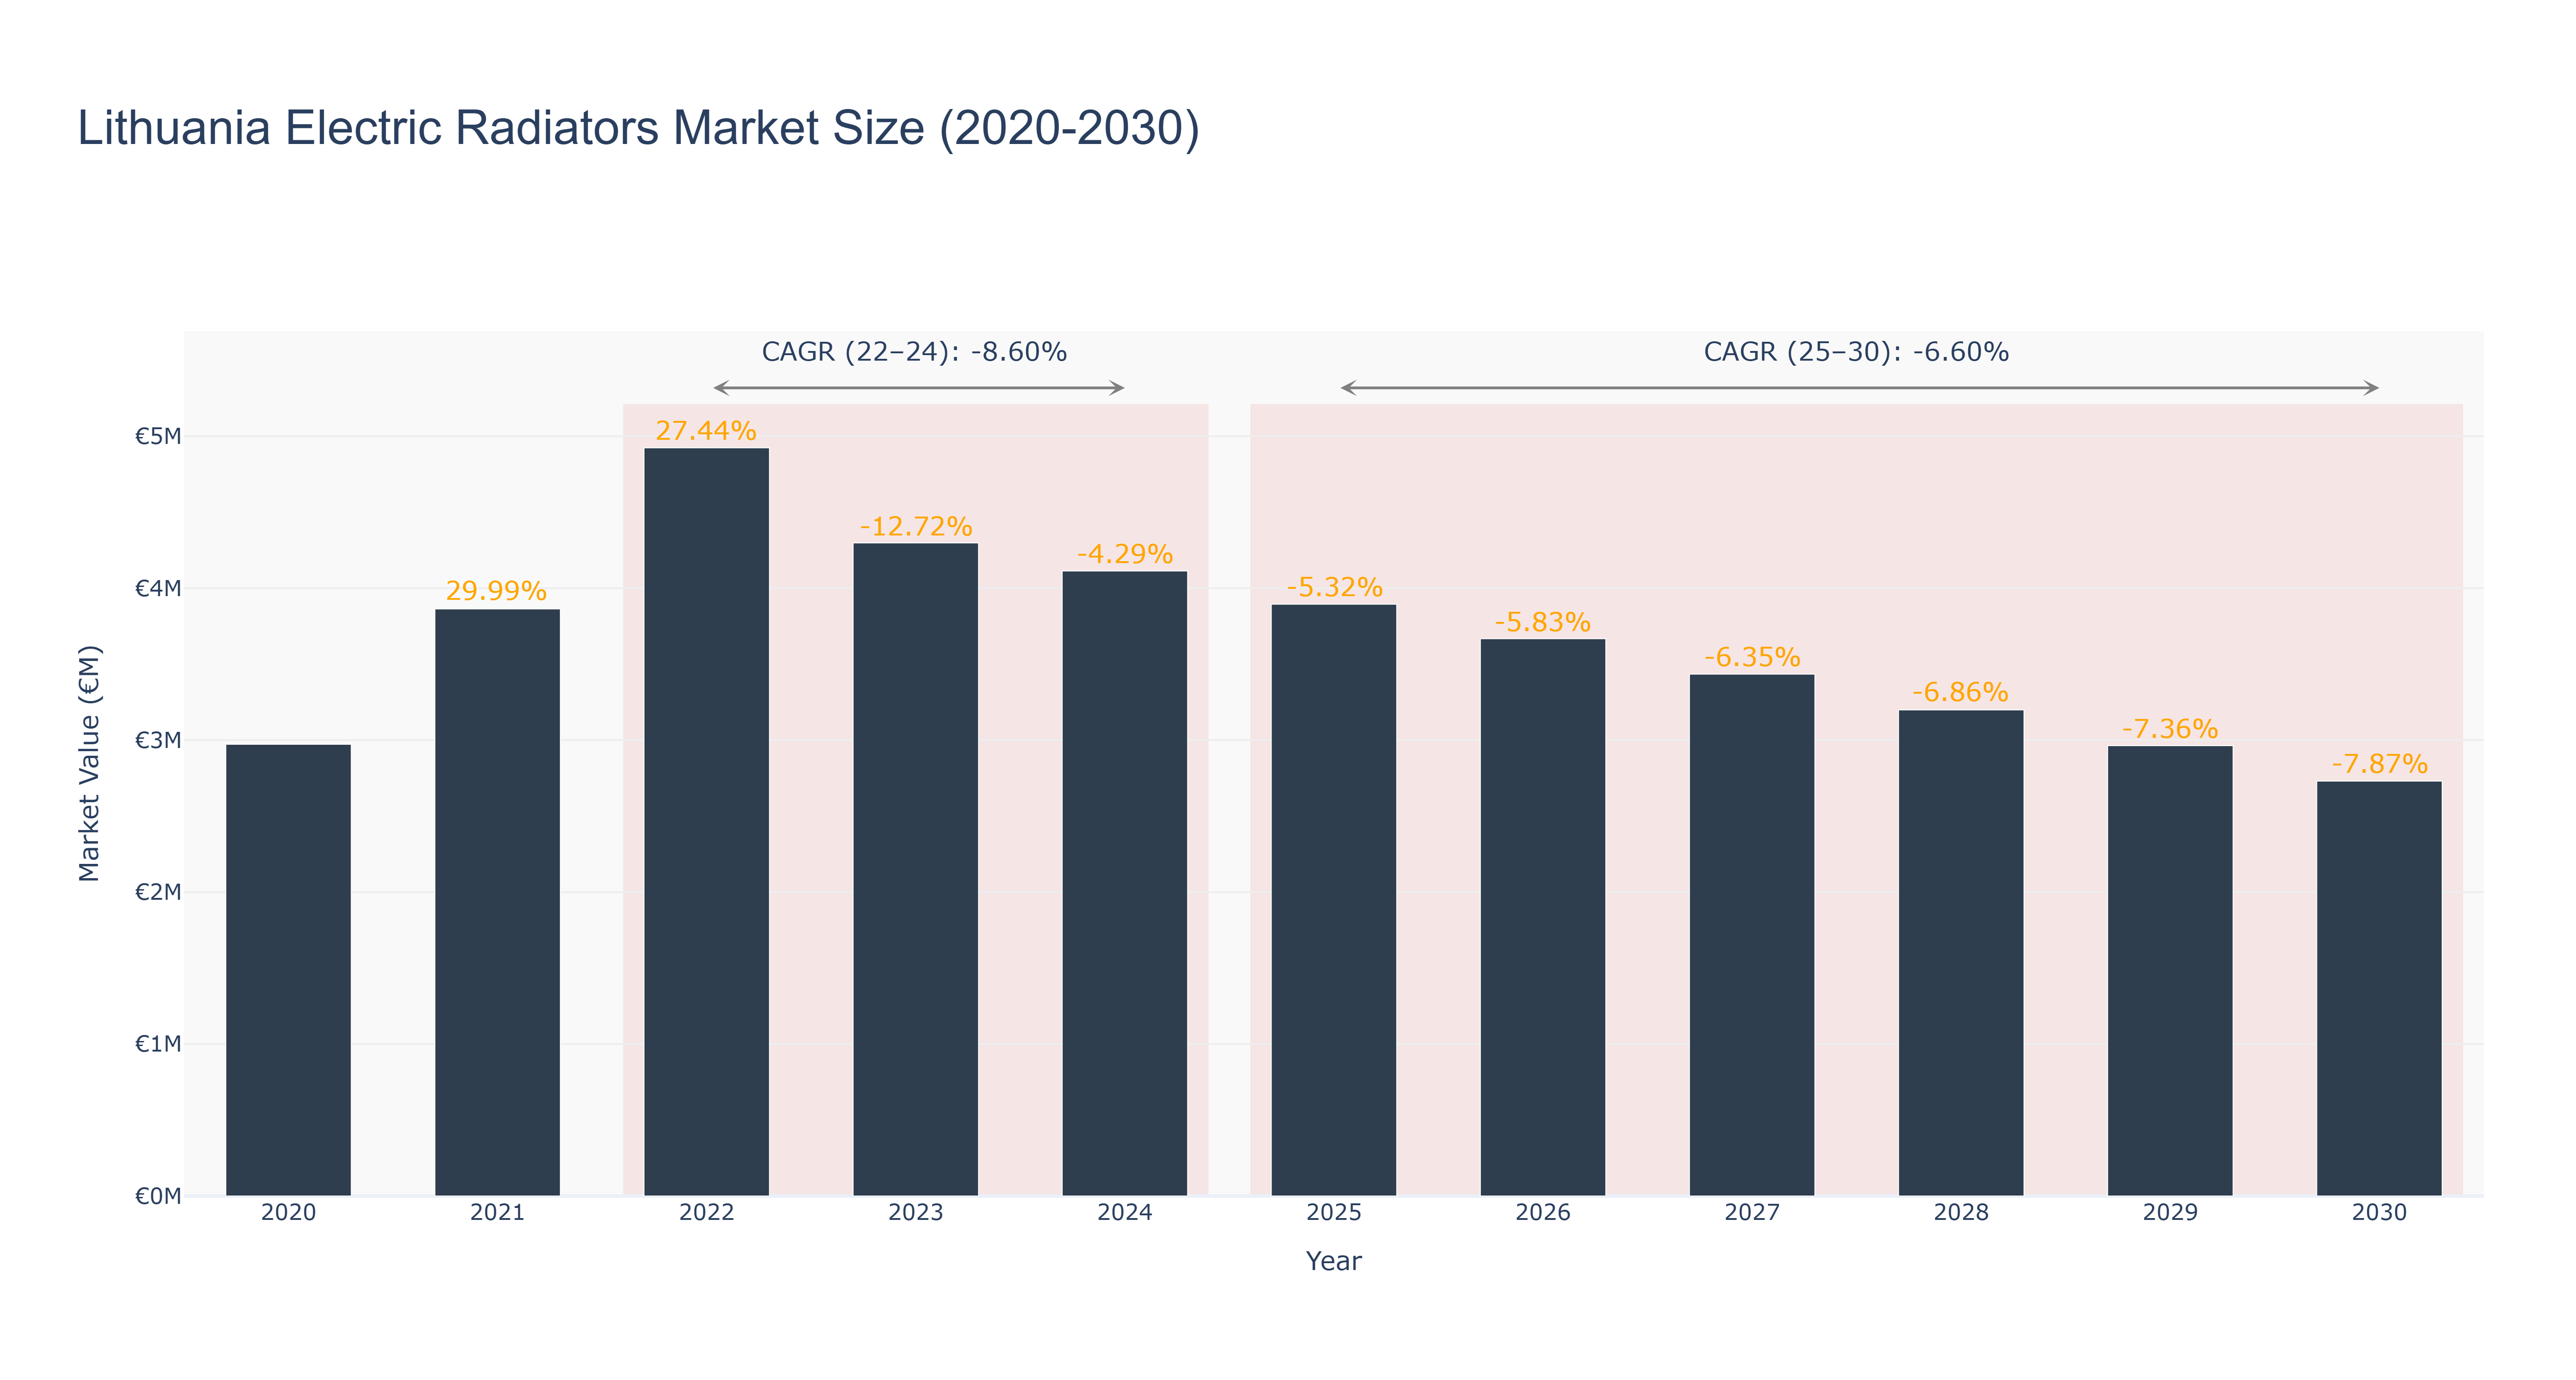
The Lithuania Electric Radiators Market experienced significant growth from 2020 to 2022, peaking at €4.92 million in 2022, with a notable growth rate of 27.44% in that year. However, actual data from 2023 and 2024 indicate a downturn, with market sizes of €4.30 million and €4.11 million, reflecting negative growth rates of -12.72% and -4.29%, respectively. This decline can be attributed to factors such as rising energy costs and increased competition from alternative heating solutions. The forecasted period from 2025 to 2030 anticipates a continued contraction, with projected market sizes decreasing from €3.89 million in 2025 to €2.73 million by 2030, resulting in a compound annual growth rate (CAGR) of -6.60%. The persistent challenges in the energy sector and evolving consumer preferences will likely drive this trend, necessitating innovation and adaptation by market players to remain competitive.
Lithuania Electric Radiators Market: Production & Trade Performance (2019-2025)
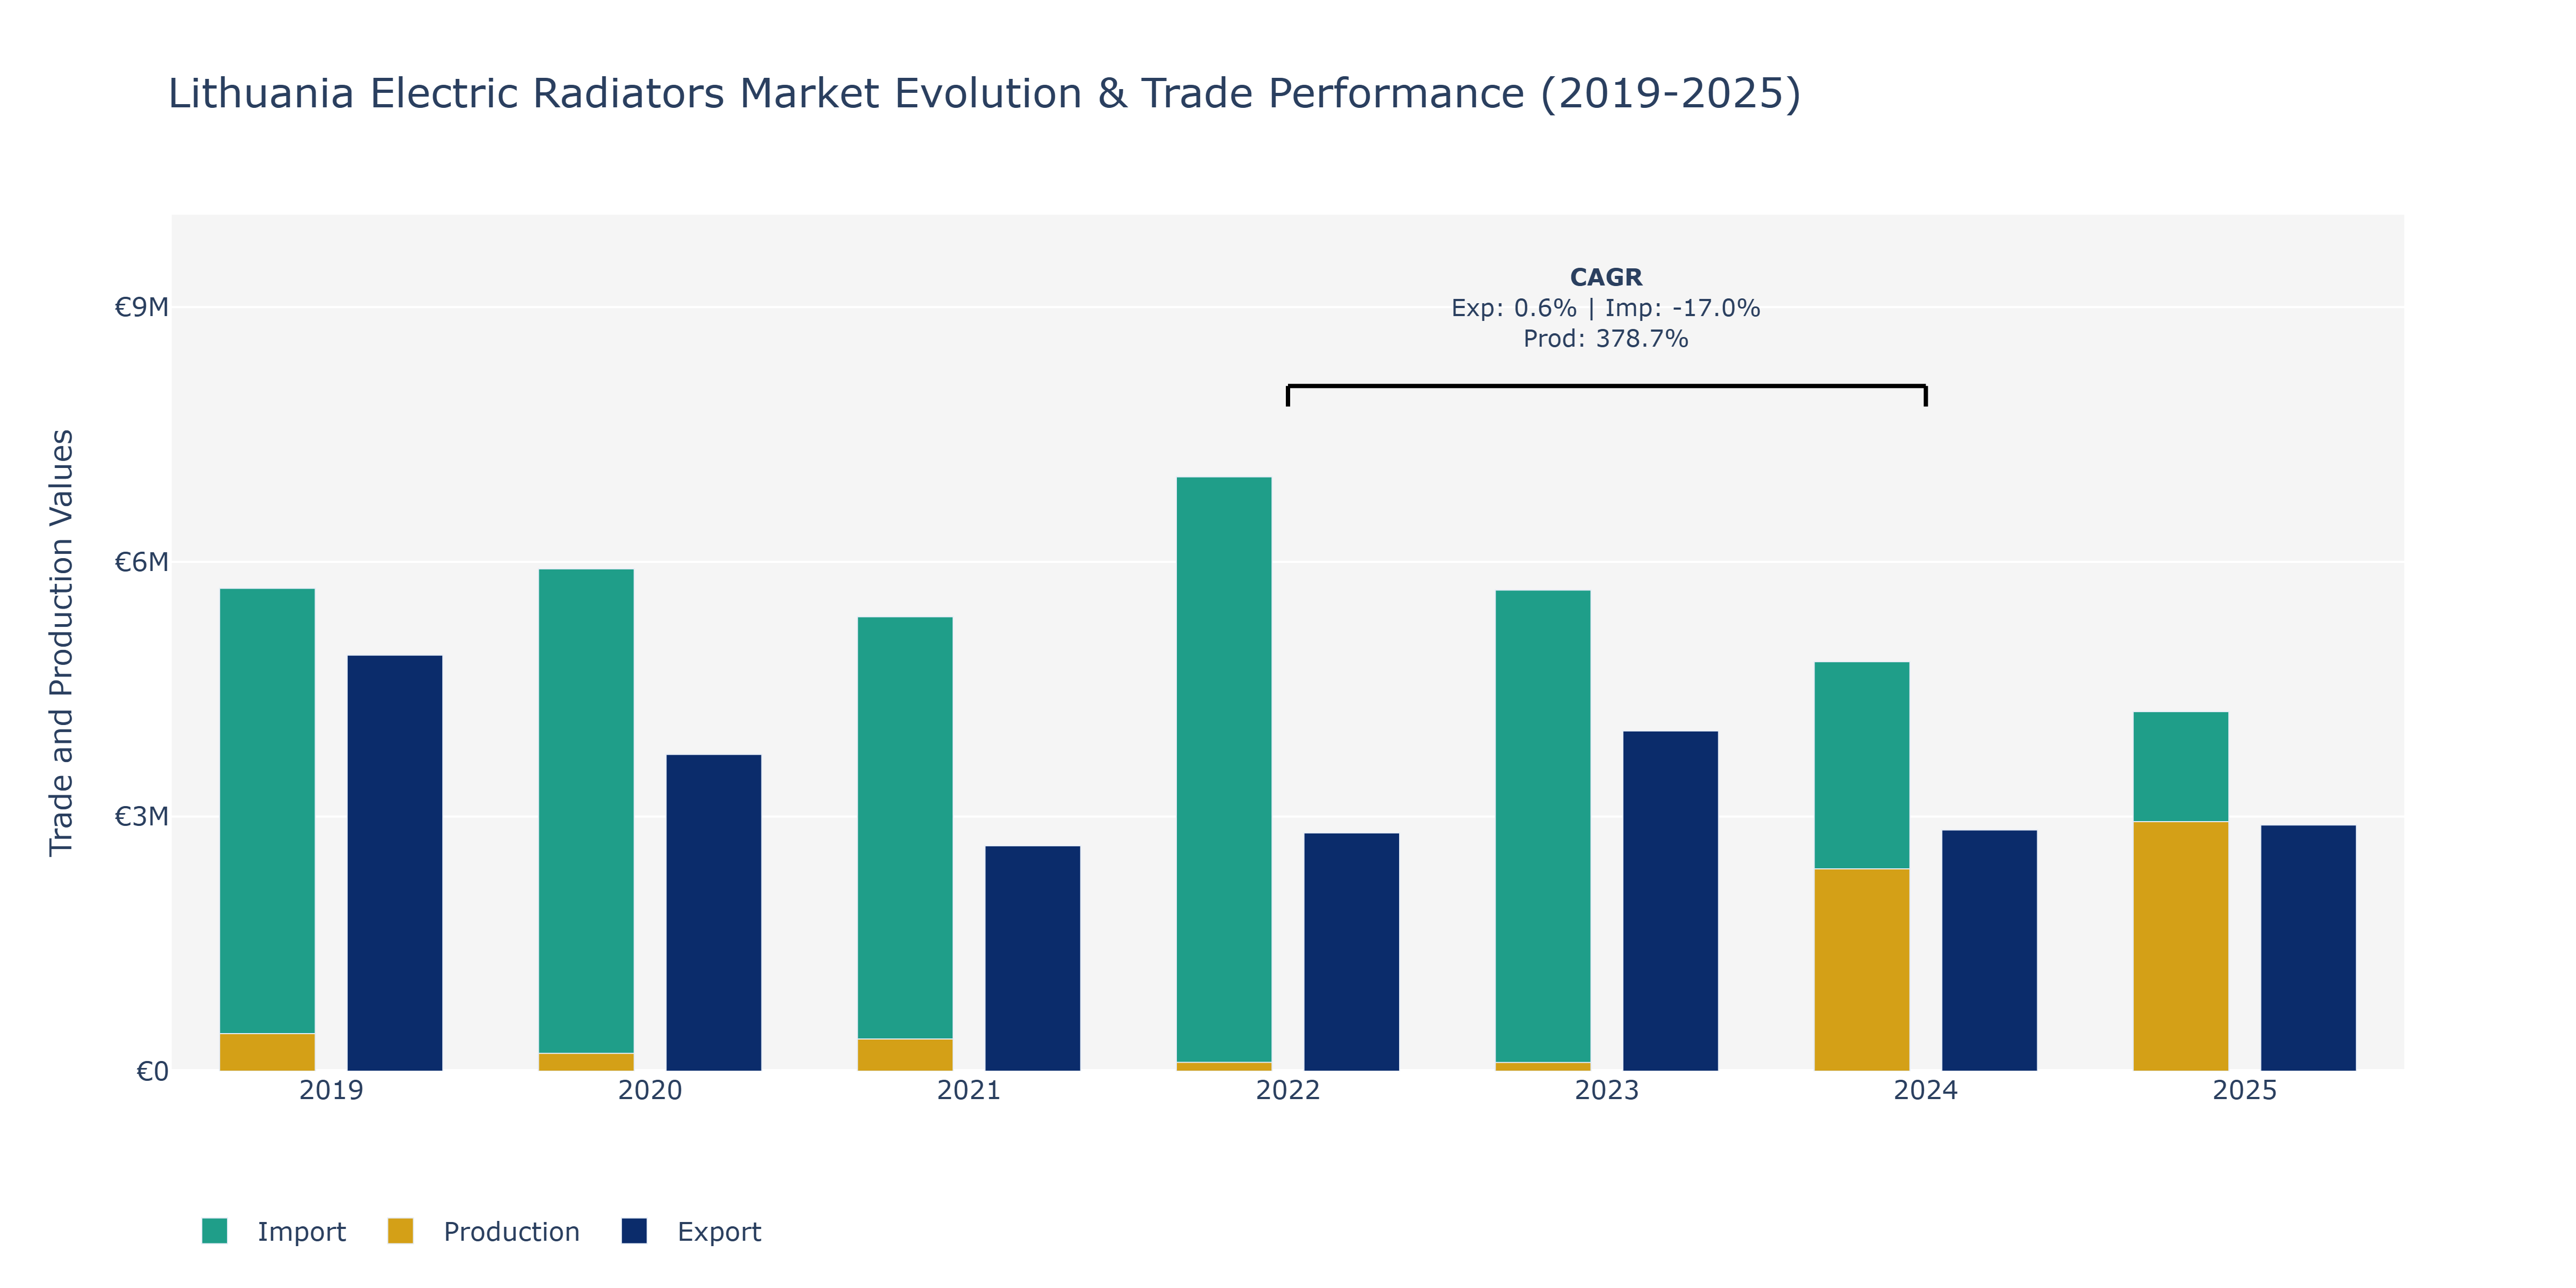
Between 2019 and 2025, the Lithuania Electric Radiators Market witnessed fluctuations in Exports, Imports, and Production. In 2019, Exports stood at €4.9 million, dropping to €2.65 million in 2021 before gradually recovering to €2.9 million in 2025. Imports peaked in 2022 at €7.0 million, showcasing a declining trend thereafter to €4.24 million in 2025. Production experienced substantial growth from €441.73 million in 2019 to €2.93 billion in 2025, with a notable spike in 2024. The surge in Production can be attributed to increased investments in manufacturing facilities, technological advancements in electric radiator production, and a growing demand for energy-efficient heating solutions in the region. The fluctuating Export value may have been influenced by changes in global demand, trade agreements, and economic conditions impacting the export competitiveness of Lithuanian electric radiators. The decline in imports post-2022 could be linked to a shift towards supporting domestic manufacturing capabilities, import regulations, or changes in supply chain strategies. These dynamics underscore the market's response to evolving industry landscapes and economic factors, reflecting a strategic balance between domestic production and international trade in the sector.
Key Highlights of the Report:
- Lithuania Electric Radiators Market Outlook
- Market Size of Lithuania Electric Radiators Market, 2025
- Forecast of Lithuania Electric Radiators Market, 2032
- Historical Data and Forecast of Lithuania Electric Radiators Revenues & Volume for the Period 2022 - 2032F
- Lithuania Electric Radiators Market Trend Evolution
- Lithuania Electric Radiators Market Drivers and Challenges
- Lithuania Electric Radiators Price Trends
- Lithuania Electric Radiators Porter`s Five Forces
- Lithuania Electric Radiators Industry Life Cycle
- Historical Data and Forecast of Lithuania Electric Radiators Market Revenues & Volume By Type for the Period 2022 - 2032F
- Historical Data and Forecast of Lithuania Electric Radiators Market Revenues & Volume By Fan Heaters for the Period 2022 - 2032F
- Historical Data and Forecast of Lithuania Electric Radiators Market Revenues & Volume By Convention Radiators for the Period 2022 - 2032F
- Historical Data and Forecast of Lithuania Electric Radiators Market Revenues & Volume By Infrared Radiators for the Period 2022 - 2032F
- Historical Data and Forecast of Lithuania Electric Radiators Market Revenues & Volume By Oil-based Radiators for the Period 2022 - 2032F
- Historical Data and Forecast of Lithuania Electric Radiators Market Revenues & Volume By Application for the Period 2022 - 2032F
- Historical Data and Forecast of Lithuania Electric Radiators Market Revenues & Volume By Residential for the Period 2022 - 2032F
- Historical Data and Forecast of Lithuania Electric Radiators Market Revenues & Volume By Commercial for the Period 2022 - 2032F
- Historical Data and Forecast of Lithuania Electric Radiators Market Revenues & Volume By Industrial for the Period 2022 - 2032F
- Lithuania Electric Radiators Import Export Trade Statistics
- Market Opportunity Assessment By Type
- Market Opportunity Assessment By Application
- Lithuania Electric Radiators Top Companies Market Share
- Lithuania Electric Radiators Competitive Benchmarking By Technical and Operational Parameters
- Lithuania Electric Radiators Company Profiles
- Lithuania Electric Radiators Key Strategic Recommendations
Frequently Asked Questions About the Market Study (FAQs):
6Wresearch actively monitors the Lithuania Electric Radiators Market and publishes its comprehensive annual report, highlighting emerging trends, growth drivers, revenue analysis, and forecast outlook. Our insights help businesses to make data-backed strategic decisions with ongoing market dynamics. Our analysts track relevent industries related to the Lithuania Electric Radiators Market, allowing our clients with actionable intelligence and reliable forecasts tailored to emerging regional needs.
Yes, we provide customisation as per your requirements. To learn more, feel free to contact us on sales@6wresearch.com
1 Executive Summary |
2 Introduction |
2.1 Key Highlights of the Report |
2.2 Report Description |
2.3 Market Scope & Segmentation |
2.4 Research Methodology |
2.5 Assumptions |
3 Lithuania Electric Radiators Market Overview |
3.1 Lithuania Country Macro Economic Indicators |
3.2 Lithuania Electric Radiators Market Revenues & Volume, 2022 & 2032F |
3.3 Lithuania Electric Radiators Market - Industry Life Cycle |
3.4 Lithuania Electric Radiators Market - Porter's Five Forces |
3.5 Lithuania Electric Radiators Market Revenues & Volume Share, By Type, 2022 & 2032F |
3.6 Lithuania Electric Radiators Market Revenues & Volume Share, By Application, 2022 & 2032F |
4 Lithuania Electric Radiators Market Dynamics |
4.1 Impact Analysis |
4.2 Market Drivers |
4.2.1 Increasing focus on energy efficiency and sustainability in Lithuania |
4.2.2 Government initiatives promoting the use of electric radiators for heating |
4.2.3 Growing consumer awareness about the benefits of electric radiators |
4.3 Market Restraints |
4.3.1 High initial cost of electric radiators compared to traditional heating systems |
4.3.2 Limited awareness and understanding of the benefits of electric radiators among some consumers |
5 Lithuania Electric Radiators Market Trends |
6 Lithuania Electric Radiators Market Segmentations |
6.1 Lithuania Electric Radiators Market, By Type |
6.1.1 Overview and Analysis |
6.1.2 Lithuania Electric Radiators Market Revenues & Volume, By Fan Heaters, 2022 - 2032F |
6.1.3 Lithuania Electric Radiators Market Revenues & Volume, By Convention Radiators, 2022 - 2032F |
6.1.4 Lithuania Electric Radiators Market Revenues & Volume, By Infrared Radiators, 2022 - 2032F |
6.1.5 Lithuania Electric Radiators Market Revenues & Volume, By Oil-based Radiators, 2022 - 2032F |
6.2 Lithuania Electric Radiators Market, By Application |
6.2.1 Overview and Analysis |
6.2.2 Lithuania Electric Radiators Market Revenues & Volume, By Residential, 2022 - 2032F |
6.2.3 Lithuania Electric Radiators Market Revenues & Volume, By Commercial, 2022 - 2032F |
6.2.4 Lithuania Electric Radiators Market Revenues & Volume, By Industrial, 2022 - 2032F |
7 Lithuania Electric Radiators Market Import-Export Trade Statistics |
7.1 Lithuania Electric Radiators Market Export to Major Countries |
7.2 Lithuania Electric Radiators Market Imports from Major Countries |
8 Lithuania Electric Radiators Market Key Performance Indicators |
8.1 Number of energy efficiency certifications obtained by electric radiator manufacturers |
8.2 Percentage increase in government subsidies or incentives for electric radiator installations |
8.3 Growth in the number of households switching from traditional heating systems to electric radiators |
8.4 Increase in the average energy efficiency rating of electric radiators sold in the market |
8.5 Number of new product innovations and technological advancements in electric radiator designs |
9 Lithuania Electric Radiators Market - Opportunity Assessment |
9.1 Lithuania Electric Radiators Market Opportunity Assessment, By Type, 2022 & 2032F |
9.2 Lithuania Electric Radiators Market Opportunity Assessment, By Application, 2022 & 2032F |
10 Lithuania Electric Radiators Market - Competitive Landscape |
10.1 Lithuania Electric Radiators Market Revenue Share, By Companies, 2025 |
10.2 Lithuania Electric Radiators Market Competitive Benchmarking, By Operating and Technical Parameters |
11 Company Profiles |
12 Recommendations | 13 Disclaimer |
Global Go To Market Strategy - 2030
Export potential enables firms to identify high-growth global markets with greater confidence by combining advanced trade intelligence with a structured quantitative methodology. The framework analyzes emerging demand trends and country-level import patterns while integrating macroeconomic and trade datasets such as GDP and population forecasts, bilateral import–export flows, tariff structures, elasticity differentials between developed and developing economies, geographic distance, and import demand projections. Using weighted trade values from 2020–2024 as the base period to project country-to-country export potential for 2030, these inputs are operationalized through calculated drivers such as gravity model parameters, tariff impact factors, and projected GDP per-capita growth. Through an analysis of hidden potentials, demand hotspots, and market conditions that are most favorable to success, this method enables firms to focus on target countries, maximize returns, and global expansion with data, backed by accuracy.
By factoring in the projected importer demand gap that is currently unmet and could be potential opportunity, it identifies the potential for the Exporter (Country) among 190 countries, against the general trade analysis, which identifies the biggest importer or exporter.
To discover high-growth global markets and optimize your business strategy:
Click Here
Pricing
- Single User License$ 1,995
- Department License$ 2,400
- Site License$ 3,120
- Global License$ 3,795

Leadership Perspectives from Industry Events
Search
Thought Leadership and Analyst Meet


Our Clients
6WResearch In News
- India Export Attractiveness Tracker 2026
- India Air Conditioner Market Set for Strong Rebound in 2026 After Weather-Led Correction and GST-Driven Recovery: 6Wresearch
- ADAS in India: How Automatic Emergency Braking, Blind Spot Detection & Driver Monitoring are Transforming Road Safety
- Doha a strategic location for EV manufacturing hub: IPA Qatar
- Demand for luxury TVs surging in the GCC, says Samsung
- Empowering Growth: The Thriving Journey of Bangladesh’s Cable Industry
Latest Reports
- Nicaragua RPG Gaming Market (2026-2032)
- New Zealand RPG Gaming Market (2026-2032)
- Netherlands RPG Gaming Market (2026-2032)
- Nauru RPG Gaming Market (2026-2032)
- Namibia RPG Gaming Market (2026-2032)
- Mozambique RPG Gaming Market (2026-2032)
- Montenegro RPG Gaming Market (2026-2032)
- Mongolia RPG Gaming Market (2026-2032)
- Monaco RPG Gaming Market (2026-2032)
- Micronesia RPG Gaming Market (2026-2032)
Industry Events and Analyst Meet

EV India Expo 2026

HIMTEX 2026

India Refining Summit 2026

India EV Show 2026

EV tech India Expo 2026
Whitepaper
- Middle East & Africa Commercial Security Market Click here to view more.
- Middle East & Africa Fire Safety Systems & Equipment Market Click here to view more.
- GCC Drone Market Click here to view more.
- Middle East Lighting Fixture Market Click here to view more.
- GCC Physical & Perimeter Security Market Click here to view more.