Lithuania Frozen Nile Perch Market (2025-2031) | Outlook, Revenue, Trends, Growth, Industry, Companies, Segmentation, Share, Analysis, Size, Value & Forecast
Market Forecast By Type (Salmon, Tuna, Anchovies, Sardines, Swordfish, Others ), By Distribution Channel (Supermarkets & Hypermarkets, Convenience Stores, Specialty Stores, Online Retail, Others) And Competitive Landscape
| Product Code: ETC5340674 | Publication Date: Nov 2023 | Updated Date: Apr 2026 | Product Type: Market Research Report | |
| Publisher: 6Wresearch | Author: Ravi Bhandari | No. of Pages: 60 | No. of Figures: 30 | No. of Tables: 5 |
Lithuania Frozen Nile Perch Market Size (2020-2030)
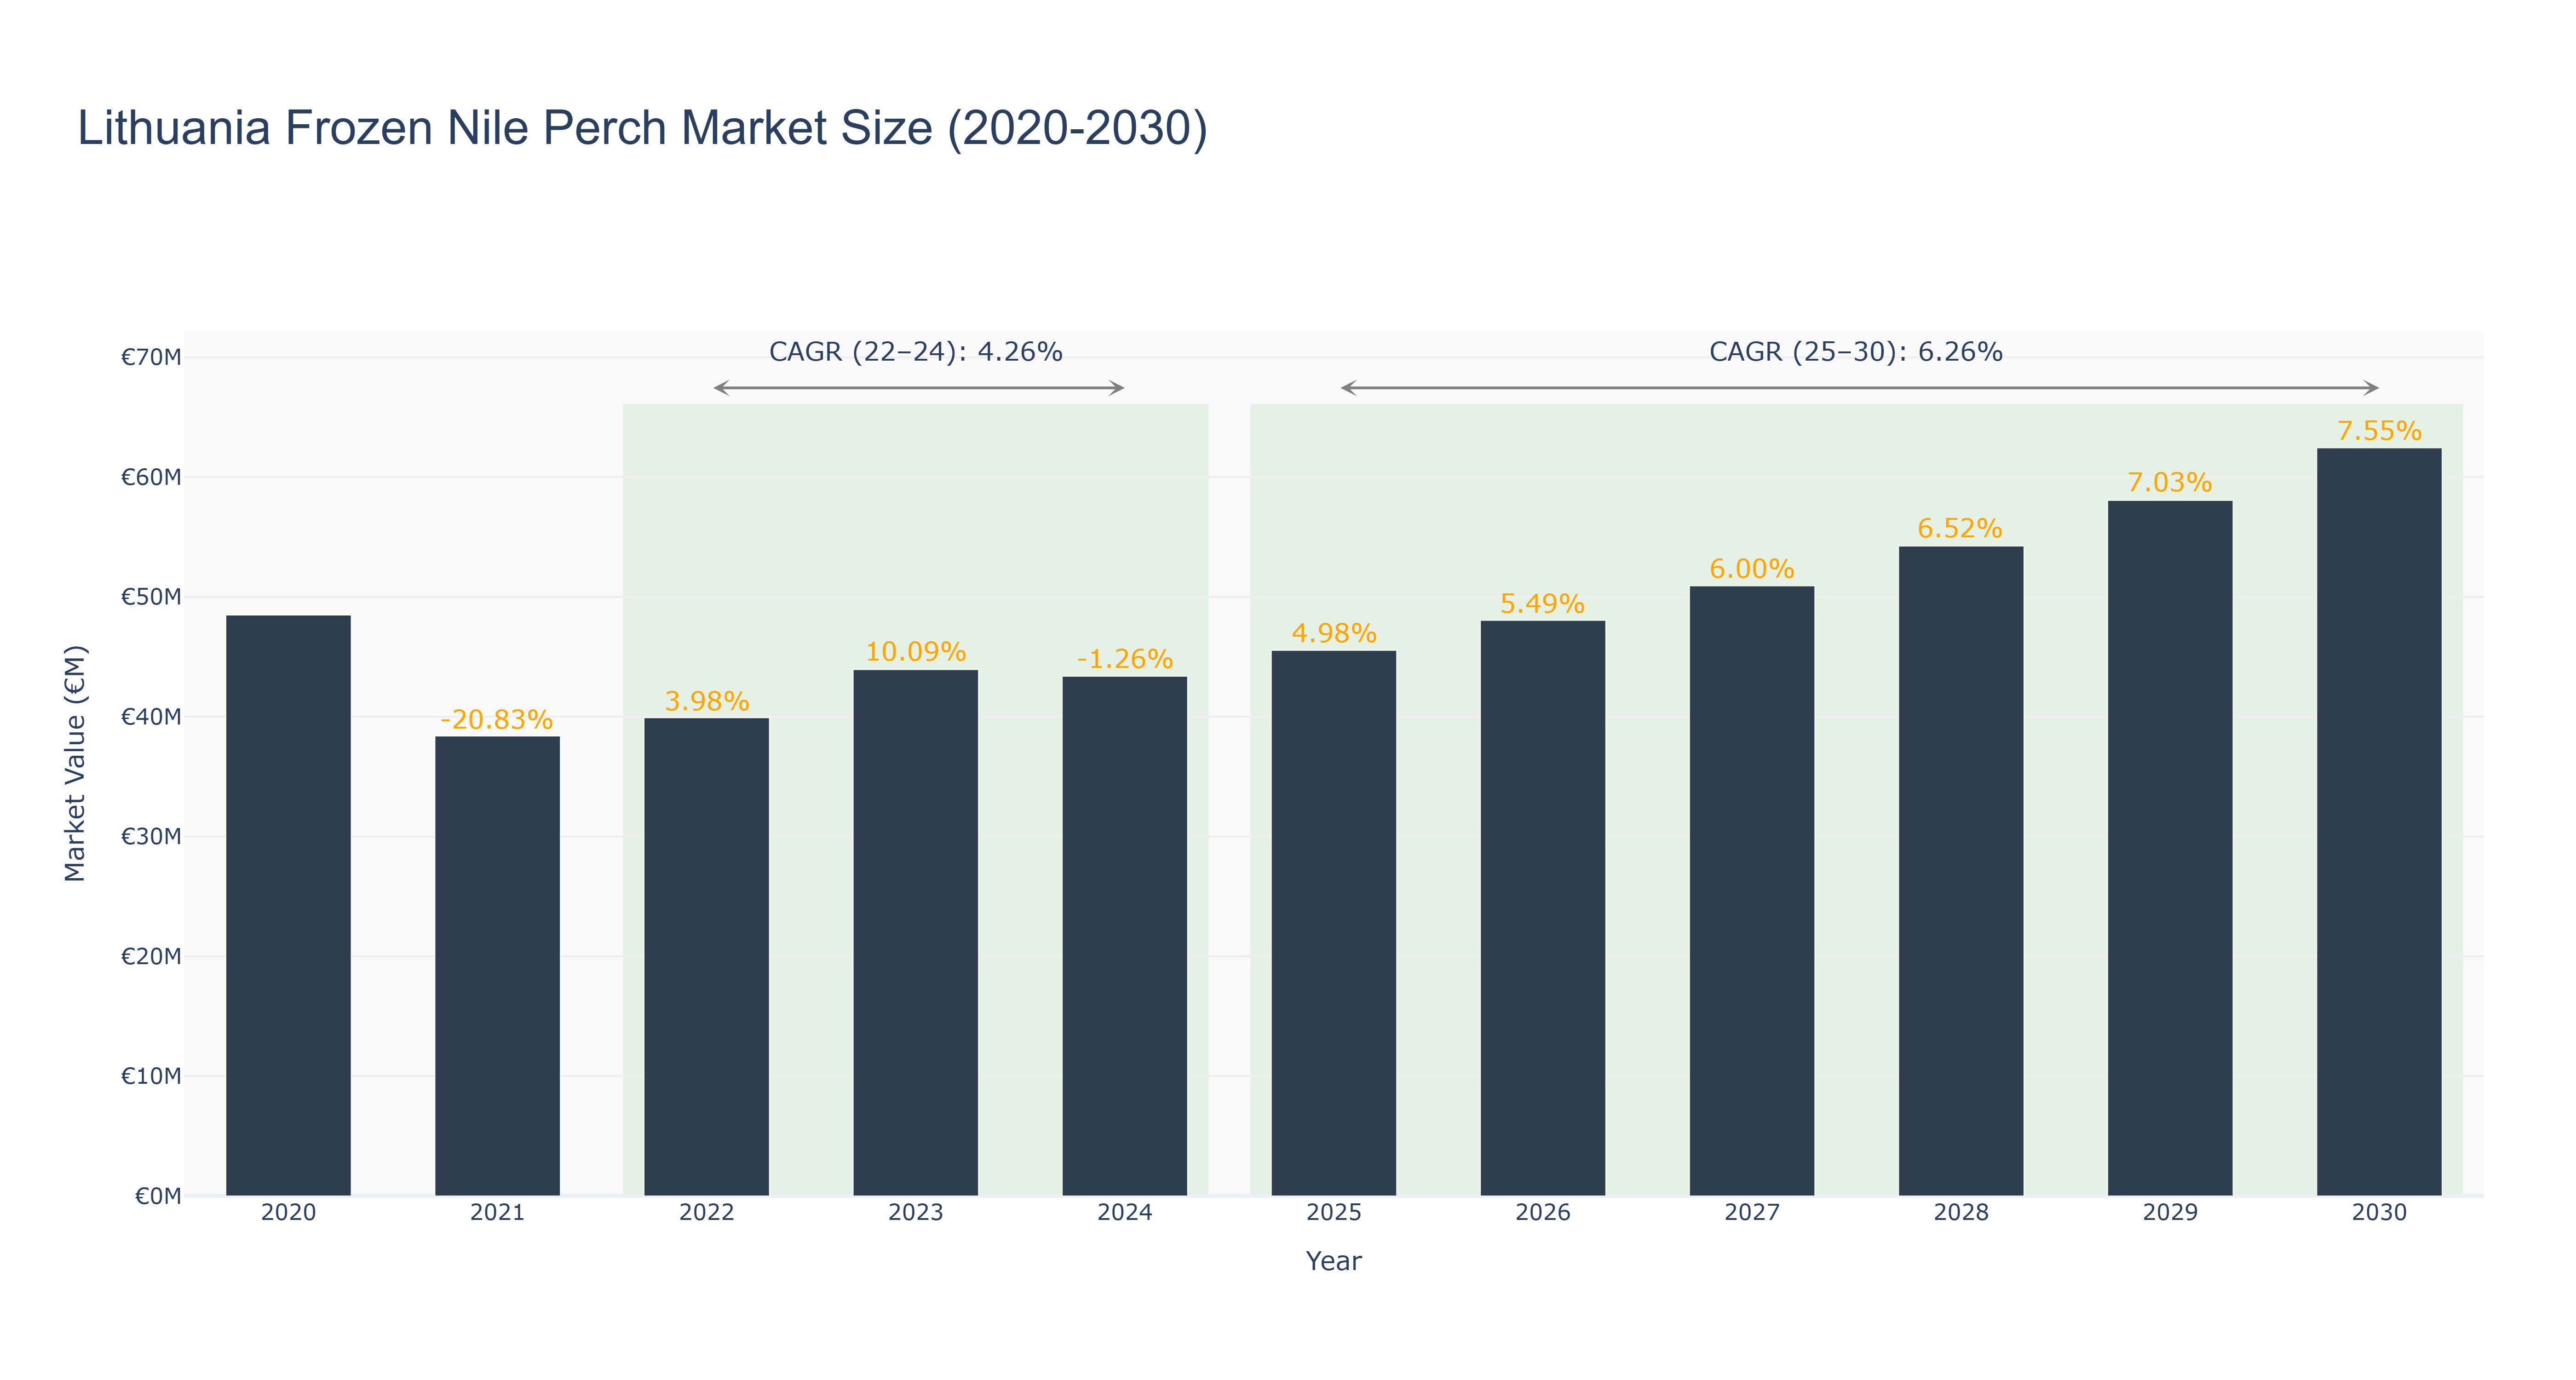
The Lithuania Frozen Nile Perch Market experienced its peak market size of €48.48 million in 2020, followed by a significant decline to €38.38 million in 2021, reflecting a -20.83% growth due to pandemic-related disruptions. However, the market rebounded to €39.91 million in 2022 and reached €43.93 million in 2023, marking a notable recovery with respective growth rates of 3.98% and 10.09%. Looking forward, the market is projected to stabilize slightly at €43.38 million in 2024 before continuing its recovery with a forecasted CAGR of 6.26% from 2025 to 2030. Anticipated growth drivers include increasing consumer demand for frozen seafood products, enhanced distribution channels, and potential innovations in processing techniques. By 2030, the market size is expected to reach €62.44 million, reflecting sustained interest in frozen Nile perch amid a broader trend towards healthy protein sources.
Lithuania Frozen Nile Perch Market: Production & Trade Performance (2019-2025)
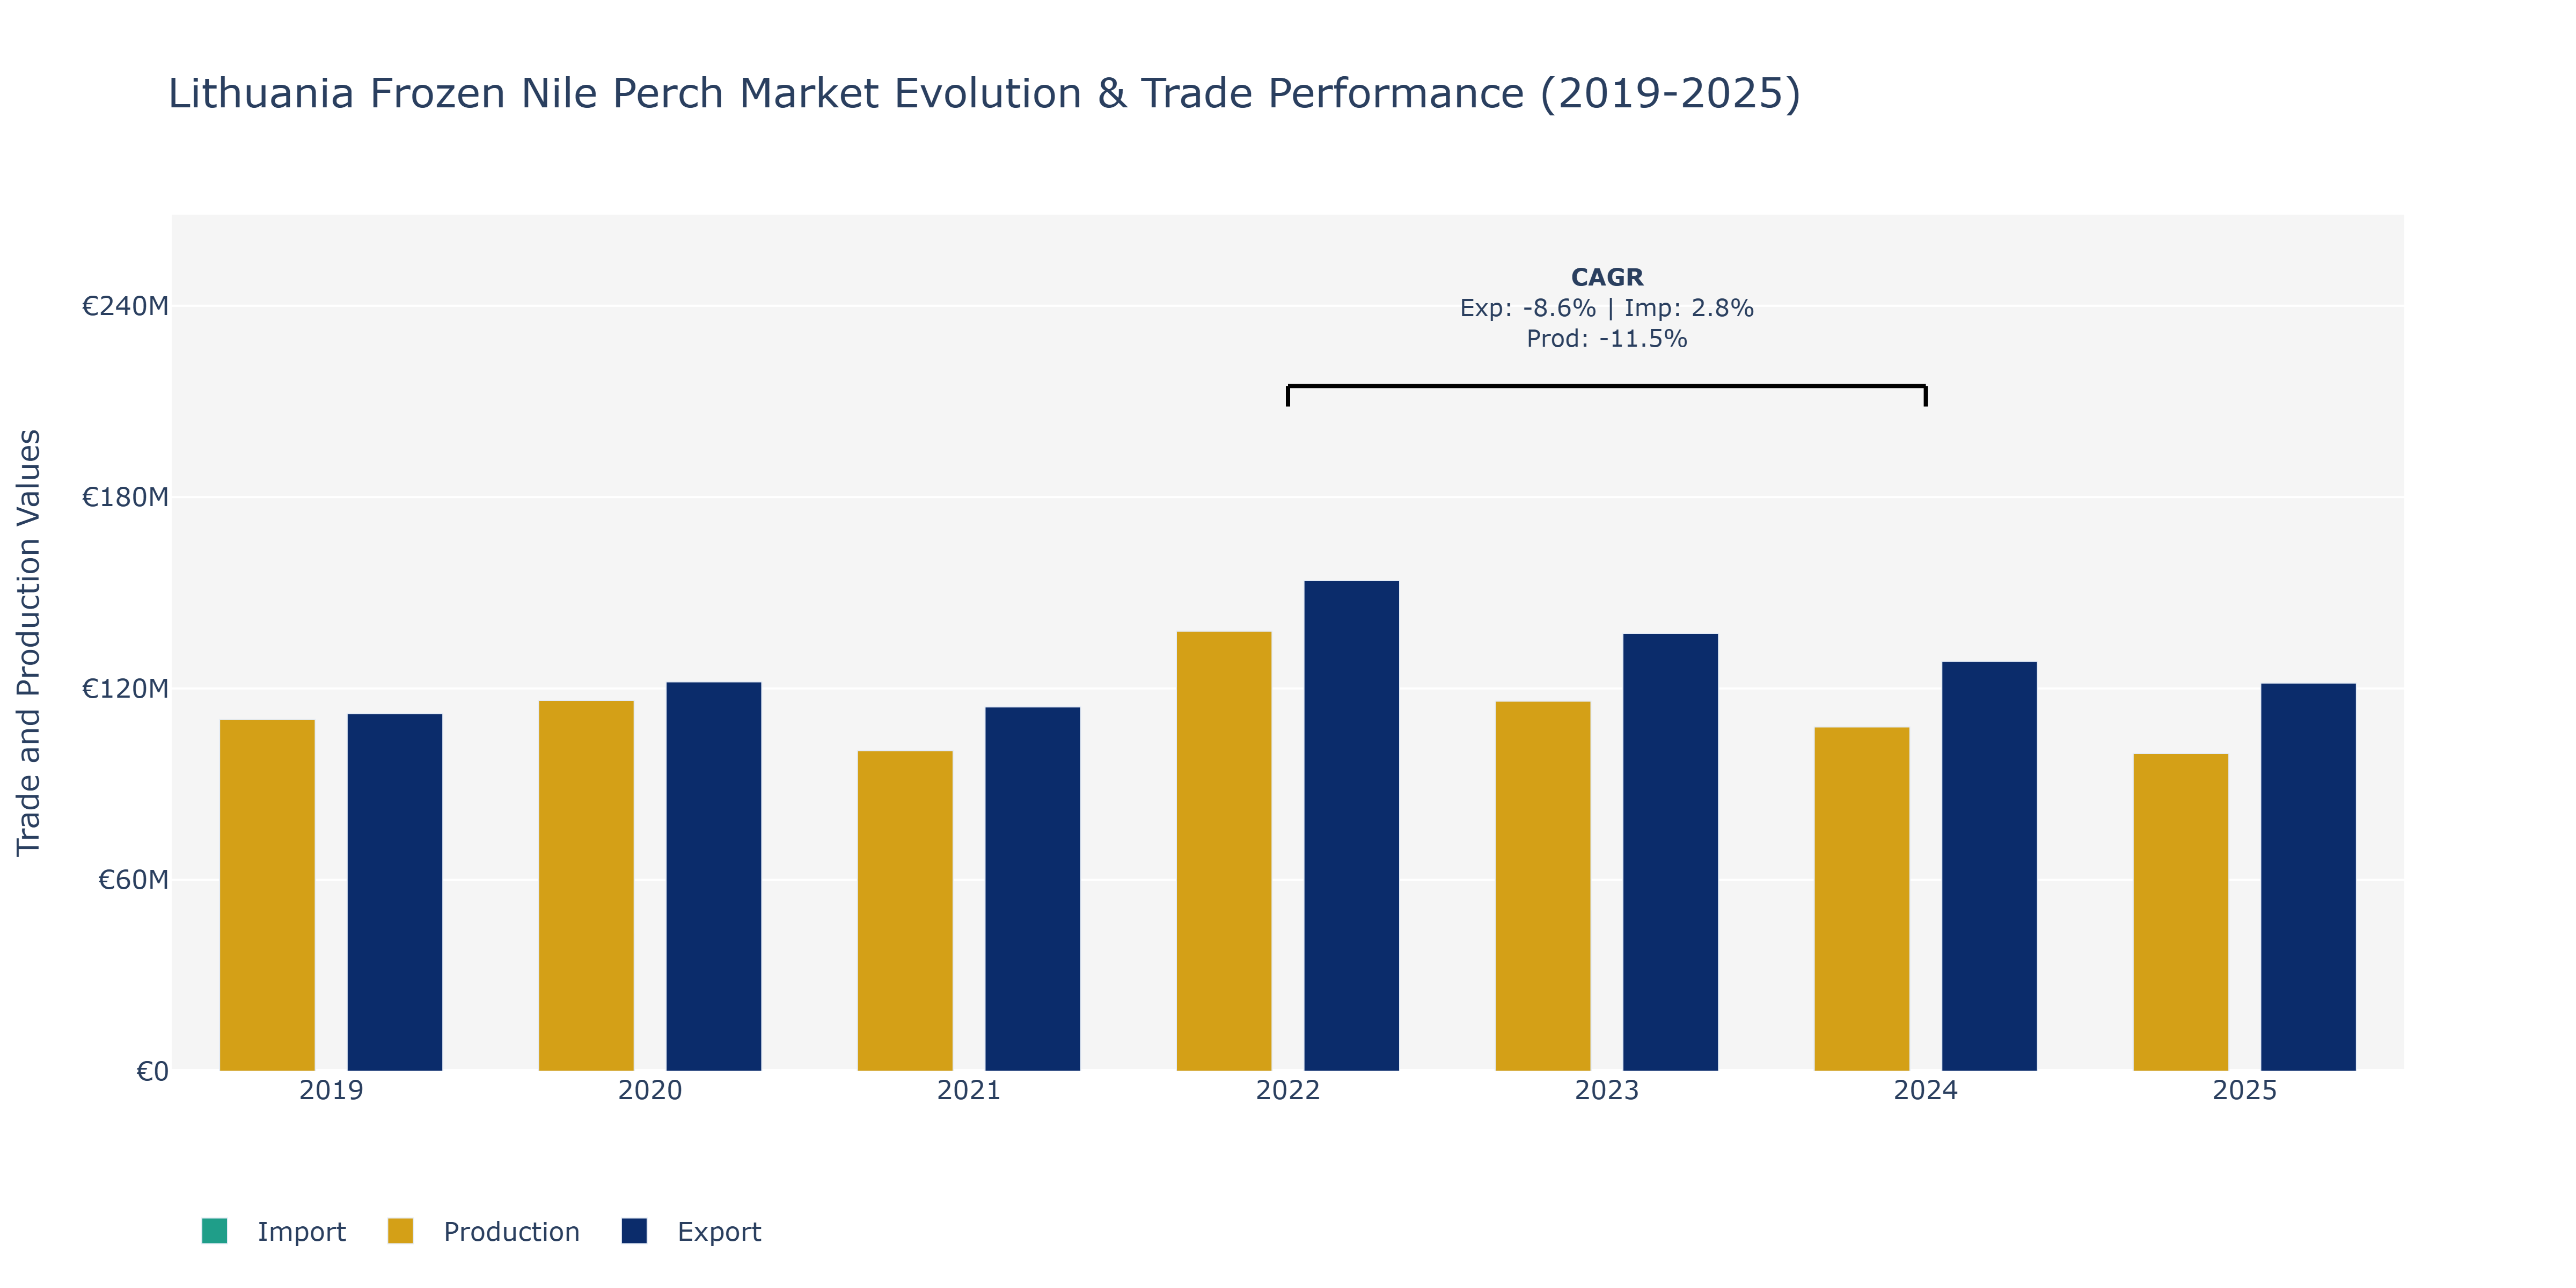
Between 2019 and 2025, the Lithuania Frozen Nile Perch Market witnessed varying trends in Exports, Imports, and Production. Exports showed a general decline from €112.12 million in 2019 to €121.69 million in 2025, with a peak in 2022 at €153.78 million. This fluctuation could be attributed to changing market demands, global economic conditions, and competition from other seafood exporters. Imports, on the other hand, fluctuated between €37.25 million in 2021 and €59.07 million in 2025, showing an overall increasing trend. Production value also varied, with a decrease from €110.27 million in 2019 to €99.61 million in 2025. Factors such as environmental changes affecting fish populations, technological advancements in aquaculture, and regulatory challenges may have influenced these production dynamics. The market may benefit from investing in sustainable fishing practices and exploring new export markets to stabilize and grow its position in the global seafood industry.
Key Highlights of the Report:
- Lithuania Frozen Nile Perch Market Outlook
- Market Size of Lithuania Frozen Nile Perch Market, 2024
- Forecast of Lithuania Frozen Nile Perch Market, 2031
- Historical Data and Forecast of Lithuania Frozen Nile Perch Revenues & Volume for the Period 2021-2031
- Lithuania Frozen Nile Perch Market Trend Evolution
- Lithuania Frozen Nile Perch Market Drivers and Challenges
- Lithuania Frozen Nile Perch Price Trends
- Lithuania Frozen Nile Perch Porter`s Five Forces
- Lithuania Frozen Nile Perch Industry Life Cycle
- Historical Data and Forecast of Lithuania Frozen Nile Perch Market Revenues & Volume By Type for the Period 2021-2031
- Historical Data and Forecast of Lithuania Frozen Nile Perch Market Revenues & Volume By Salmon for the Period 2021-2031
- Historical Data and Forecast of Lithuania Frozen Nile Perch Market Revenues & Volume By Tuna for the Period 2021-2031
- Historical Data and Forecast of Lithuania Frozen Nile Perch Market Revenues & Volume By Anchovies for the Period 2021-2031
- Historical Data and Forecast of Lithuania Frozen Nile Perch Market Revenues & Volume By Sardines for the Period 2021-2031
- Historical Data and Forecast of Lithuania Frozen Nile Perch Market Revenues & Volume By Swordfish for the Period 2021-2031
- Historical Data and Forecast of Lithuania Frozen Nile Perch Market Revenues & Volume By Others for the Period 2021-2031
- Historical Data and Forecast of Lithuania Frozen Nile Perch Market Revenues & Volume By Distribution Channel for the Period 2021-2031
- Historical Data and Forecast of Lithuania Frozen Nile Perch Market Revenues & Volume By Supermarkets & Hypermarkets for the Period 2021-2031
- Historical Data and Forecast of Lithuania Frozen Nile Perch Market Revenues & Volume By Convenience Stores for the Period 2021-2031
- Historical Data and Forecast of Lithuania Frozen Nile Perch Market Revenues & Volume By Specialty Stores for the Period 2021-2031
- Historical Data and Forecast of Lithuania Frozen Nile Perch Market Revenues & Volume By Online Retail for the Period 2021-2031
- Historical Data and Forecast of Lithuania Frozen Nile Perch Market Revenues & Volume By Others for the Period 2021-2031
- Lithuania Frozen Nile Perch Import Export Trade Statistics
- Market Opportunity Assessment By Type
- Market Opportunity Assessment By Distribution Channel
- Lithuania Frozen Nile Perch Top Companies Market Share
- Lithuania Frozen Nile Perch Competitive Benchmarking By Technical and Operational Parameters
- Lithuania Frozen Nile Perch Company Profiles
- Lithuania Frozen Nile Perch Key Strategic Recommendations
Frequently Asked Questions About the Market Study (FAQs):
6Wresearch actively monitors the Lithuania Frozen Nile Perch Market and publishes its comprehensive annual report, highlighting emerging trends, growth drivers, revenue analysis, and forecast outlook. Our insights help businesses to make data-backed strategic decisions with ongoing market dynamics. Our analysts track relevent industries related to the Lithuania Frozen Nile Perch Market, allowing our clients with actionable intelligence and reliable forecasts tailored to emerging regional needs.
Yes, we provide customisation as per your requirements. To learn more, feel free to contact us on sales@6wresearch.com
1 Executive Summary |
2 Introduction |
2.1 Key Highlights of the Report |
2.2 Report Description |
2.3 Market Scope & Segmentation |
2.4 Research Methodology |
2.5 Assumptions |
3 Lithuania Frozen Nile Perch Market Overview |
3.1 Lithuania Country Macro Economic Indicators |
3.2 Lithuania Frozen Nile Perch Market Revenues & Volume, 2021 & 2031F |
3.3 Lithuania Frozen Nile Perch Market - Industry Life Cycle |
3.4 Lithuania Frozen Nile Perch Market - Porter's Five Forces |
3.5 Lithuania Frozen Nile Perch Market Revenues & Volume Share, By Type, 2021 & 2031F |
3.6 Lithuania Frozen Nile Perch Market Revenues & Volume Share, By Distribution Channel, 2021 & 2031F |
4 Lithuania Frozen Nile Perch Market Dynamics |
4.1 Impact Analysis |
4.2 Market Drivers |
4.2.1 Increasing consumer demand for healthy and sustainable seafood options |
4.2.2 Growth in the food service industry leading to higher demand for frozen seafood products |
4.2.3 Rising popularity of international cuisines driving the demand for exotic fish varieties like Nile perch |
4.3 Market Restraints |
4.3.1 Fluctuating raw material prices impacting production costs |
4.3.2 Stringent regulations and compliance requirements for seafood imports |
4.3.3 Competition from other frozen seafood products in the market |
5 Lithuania Frozen Nile Perch Market Trends |
6 Lithuania Frozen Nile Perch Market Segmentations |
6.1 Lithuania Frozen Nile Perch Market, By Type |
6.1.1 Overview and Analysis |
6.1.2 Lithuania Frozen Nile Perch Market Revenues & Volume, By Salmon, 2021-2031F |
6.1.3 Lithuania Frozen Nile Perch Market Revenues & Volume, By Tuna, 2021-2031F |
6.1.4 Lithuania Frozen Nile Perch Market Revenues & Volume, By Anchovies, 2021-2031F |
6.1.5 Lithuania Frozen Nile Perch Market Revenues & Volume, By Sardines, 2021-2031F |
6.1.6 Lithuania Frozen Nile Perch Market Revenues & Volume, By Swordfish, 2021-2031F |
6.1.7 Lithuania Frozen Nile Perch Market Revenues & Volume, By Others ? , 2021-2031F |
6.2 Lithuania Frozen Nile Perch Market, By Distribution Channel |
6.2.1 Overview and Analysis |
6.2.2 Lithuania Frozen Nile Perch Market Revenues & Volume, By Supermarkets & Hypermarkets, 2021-2031F |
6.2.3 Lithuania Frozen Nile Perch Market Revenues & Volume, By Convenience Stores, 2021-2031F |
6.2.4 Lithuania Frozen Nile Perch Market Revenues & Volume, By Specialty Stores, 2021-2031F |
6.2.5 Lithuania Frozen Nile Perch Market Revenues & Volume, By Online Retail, 2021-2031F |
6.2.6 Lithuania Frozen Nile Perch Market Revenues & Volume, By Others, 2021-2031F |
7 Lithuania Frozen Nile Perch Market Import-Export Trade Statistics |
7.1 Lithuania Frozen Nile Perch Market Export to Major Countries |
7.2 Lithuania Frozen Nile Perch Market Imports from Major Countries |
8 Lithuania Frozen Nile Perch Market Key Performance Indicators |
8.1 Average selling price per unit of frozen Nile perch |
8.2 Percentage of market penetration in the food service industry |
8.3 Consumer awareness and perception of frozen Nile perch as a premium seafood choice |
9 Lithuania Frozen Nile Perch Market - Opportunity Assessment |
9.1 Lithuania Frozen Nile Perch Market Opportunity Assessment, By Type, 2021 & 2031F |
9.2 Lithuania Frozen Nile Perch Market Opportunity Assessment, By Distribution Channel, 2021 & 2031F |
10 Lithuania Frozen Nile Perch Market - Competitive Landscape |
10.1 Lithuania Frozen Nile Perch Market Revenue Share, By Companies, 2024 |
10.2 Lithuania Frozen Nile Perch Market Competitive Benchmarking, By Operating and Technical Parameters |
11 Company Profiles |
12 Recommendations | 13 Disclaimer |
Global Go To Market Strategy - 2030
Export potential enables firms to identify high-growth global markets with greater confidence by combining advanced trade intelligence with a structured quantitative methodology. The framework analyzes emerging demand trends and country-level import patterns while integrating macroeconomic and trade datasets such as GDP and population forecasts, bilateral import–export flows, tariff structures, elasticity differentials between developed and developing economies, geographic distance, and import demand projections. Using weighted trade values from 2020–2024 as the base period to project country-to-country export potential for 2030, these inputs are operationalized through calculated drivers such as gravity model parameters, tariff impact factors, and projected GDP per-capita growth. Through an analysis of hidden potentials, demand hotspots, and market conditions that are most favorable to success, this method enables firms to focus on target countries, maximize returns, and global expansion with data, backed by accuracy.
By factoring in the projected importer demand gap that is currently unmet and could be potential opportunity, it identifies the potential for the Exporter (Country) among 190 countries, against the general trade analysis, which identifies the biggest importer or exporter.
To discover high-growth global markets and optimize your business strategy:
Click Here
Pricing
- Single User License$ 1,995
- Department License$ 2,400
- Site License$ 3,120
- Global License$ 3,795

Leadership Perspectives from Industry Events
Search
Thought Leadership and Analyst Meet


Our Clients
6WResearch In News
- India Export Attractiveness Tracker 2026
- India Air Conditioner Market Set for Strong Rebound in 2026 After Weather-Led Correction and GST-Driven Recovery: 6Wresearch
- ADAS in India: How Automatic Emergency Braking, Blind Spot Detection & Driver Monitoring are Transforming Road Safety
- Doha a strategic location for EV manufacturing hub: IPA Qatar
- Demand for luxury TVs surging in the GCC, says Samsung
- Empowering Growth: The Thriving Journey of Bangladesh’s Cable Industry
Latest Reports
- Nicaragua RPG Gaming Market (2026-2032)
- New Zealand RPG Gaming Market (2026-2032)
- Netherlands RPG Gaming Market (2026-2032)
- Nauru RPG Gaming Market (2026-2032)
- Namibia RPG Gaming Market (2026-2032)
- Mozambique RPG Gaming Market (2026-2032)
- Montenegro RPG Gaming Market (2026-2032)
- Mongolia RPG Gaming Market (2026-2032)
- Monaco RPG Gaming Market (2026-2032)
- Micronesia RPG Gaming Market (2026-2032)
Industry Events and Analyst Meet

EV India Expo 2026

HIMTEX 2026

India Refining Summit 2026

India EV Show 2026

EV tech India Expo 2026
Whitepaper
- Middle East & Africa Commercial Security Market Click here to view more.
- Middle East & Africa Fire Safety Systems & Equipment Market Click here to view more.
- GCC Drone Market Click here to view more.
- Middle East Lighting Fixture Market Click here to view more.
- GCC Physical & Perimeter Security Market Click here to view more.