Lithuania Herbicides Market (2026-2032) | Companies, Growth, Outlook, Revenue, Industry, Analysis, Forecast, Segmentation, Size, Value, Trends & Share
Market Forecast By Type (Glyphosate, 2, 4-D, Diquat, Others), By Mode of Action (Non-Selective, Selective), By Crop Type (Cereals & Grains, Oilseeds & Pulses, Fruits & Vegetables, Others) And Competitive Landscape
| Product Code: ETC5680470 | Publication Date: Nov 2023 | Updated Date: Apr 2026 | Product Type: Market Research Report | |
| Publisher: 6Wresearch | Author: Ravi Bhandari | No. of Pages: 60 | No. of Figures: 30 | No. of Tables: 5 |
Lithuania Herbicides Market Size (2020-2030)
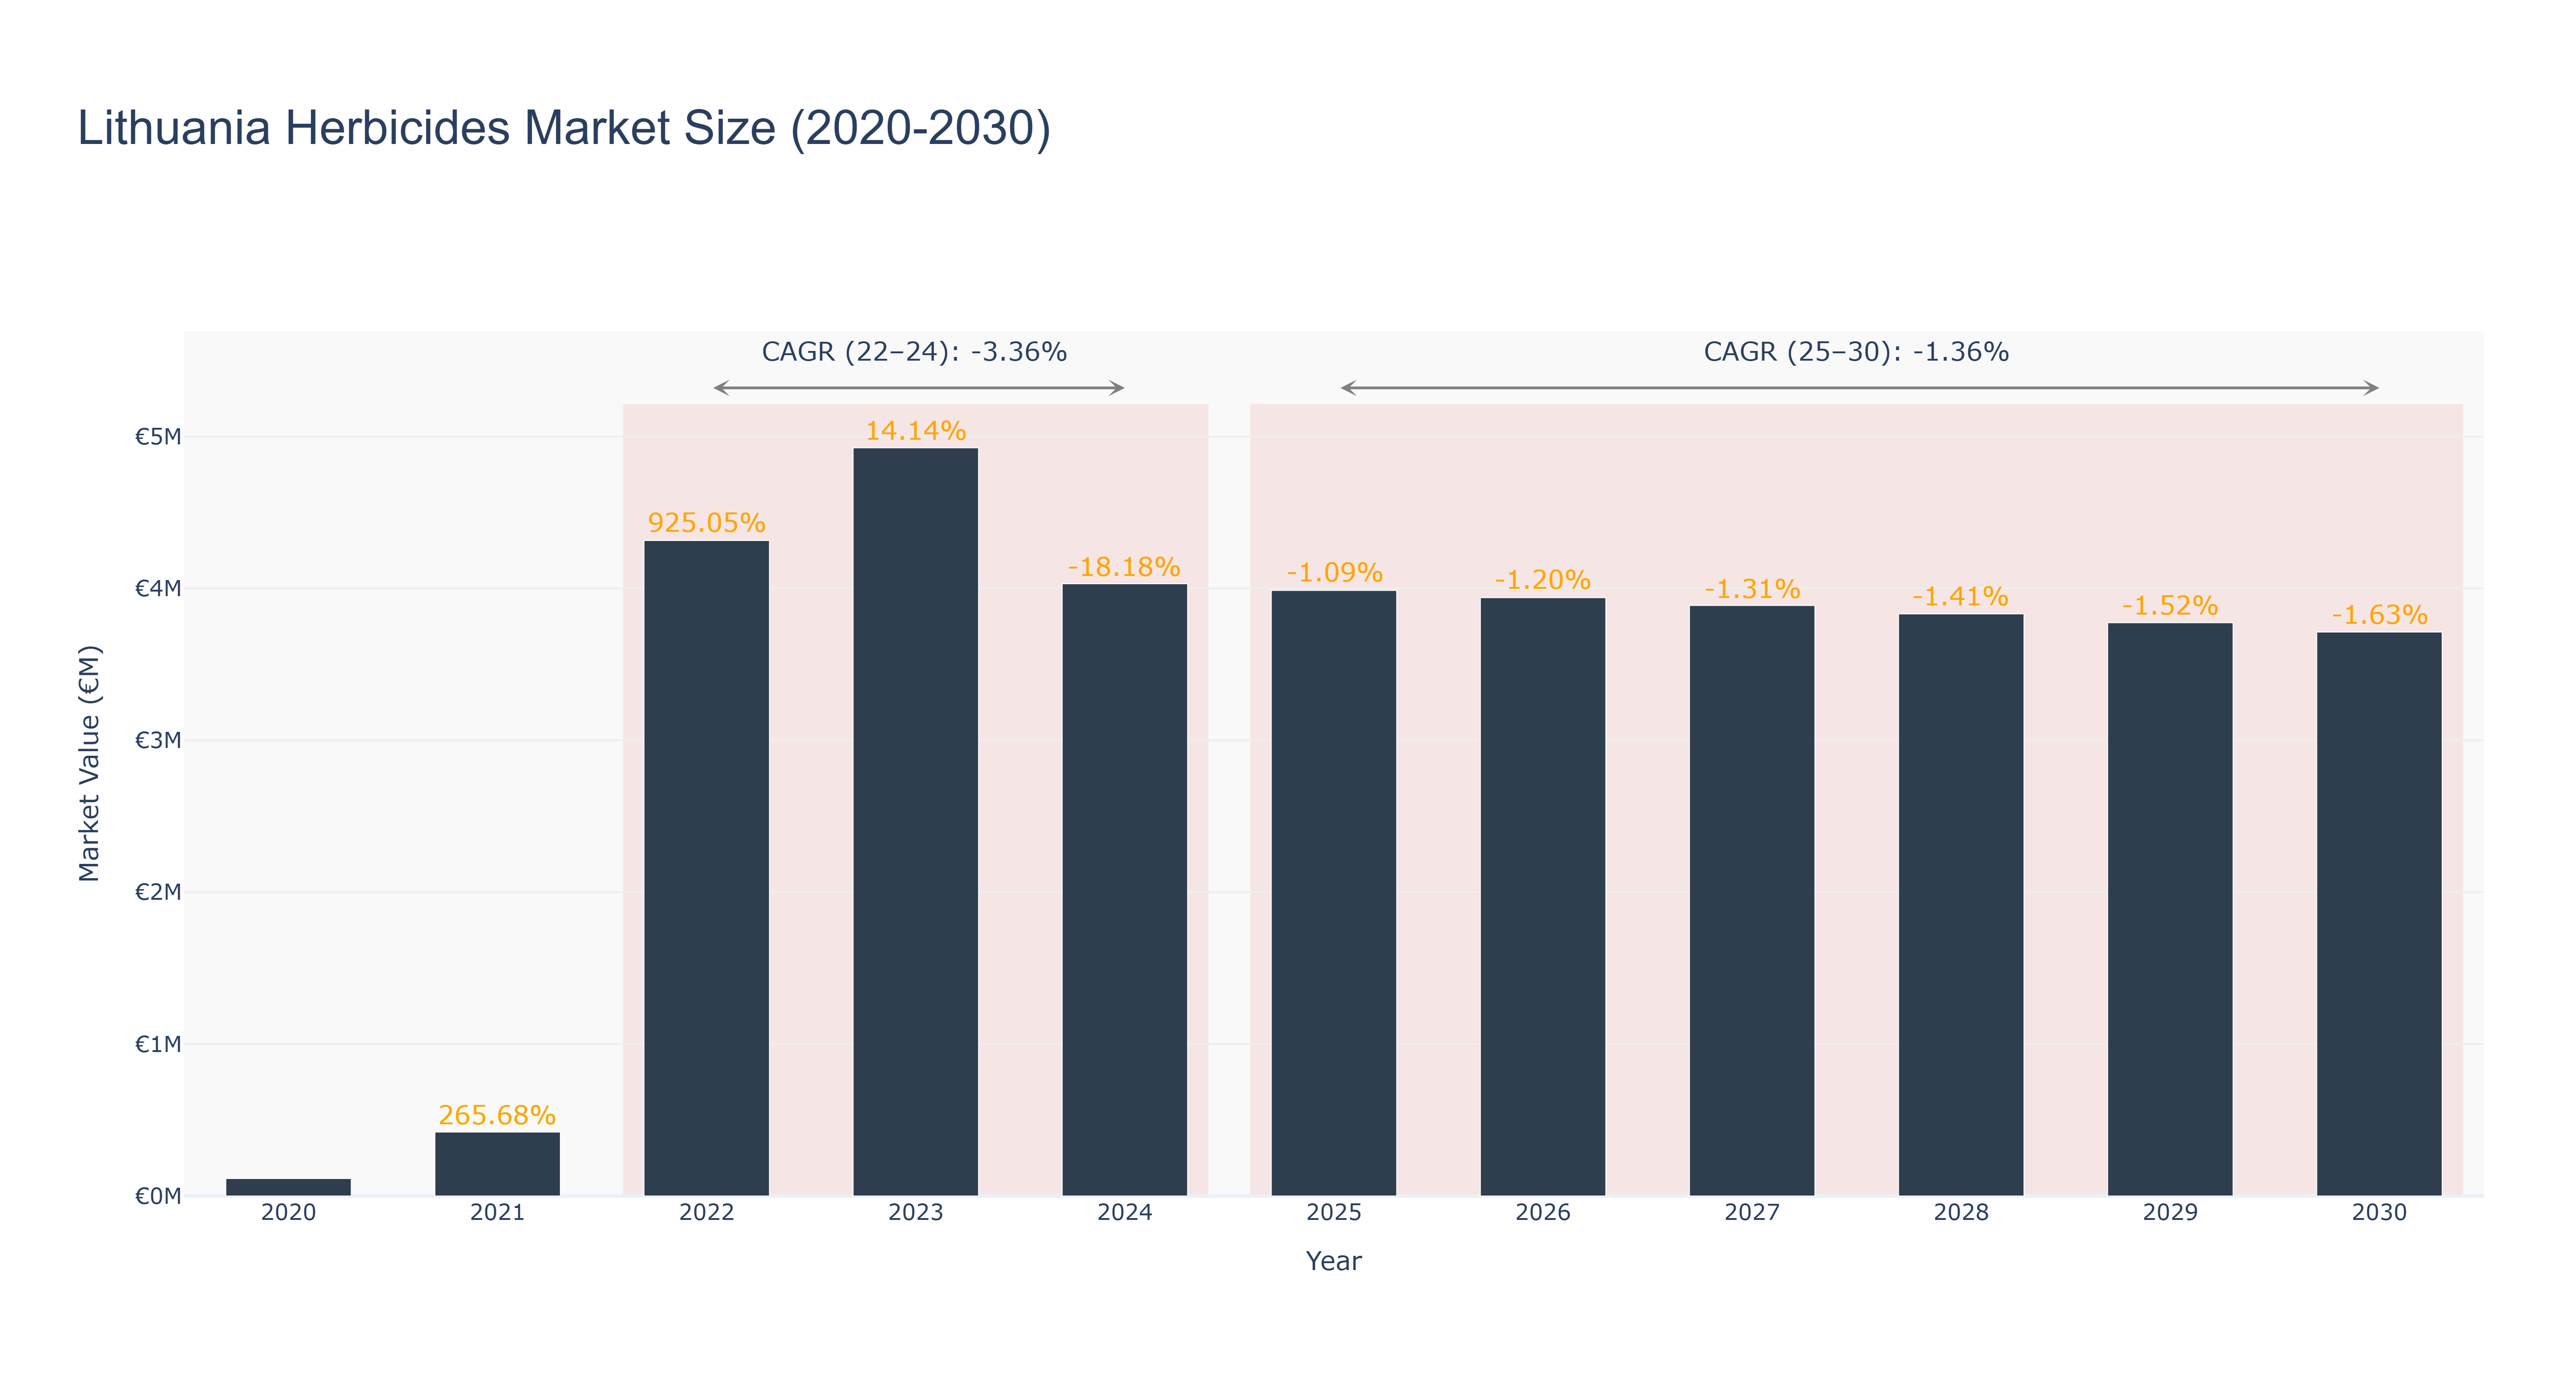
The Lithuania Herbicides Market witnessed a peak size of €4.93 million in 2023, followed by a slight decline to €4.03 million in 2024. The market is forecasted to continue its downward trend with an expected size of €3.71 million in 2030. The CAGR for the period 2022-24 stands at -3.36%, reflecting a negative growth rate, while the CAGR for 2025-30 is projected at -1.36%. The market size fluctuations can be attributed to changing agricultural practices, regulatory factors, and evolving consumer preferences. Recent developments in sustainable herbicide solutions and precision agriculture technologies are expected to shape the market landscape in the coming years, driving innovation and efficiency in herbicide applications within Lithuania.
Lithuania Herbicides Market: Production & Trade Performance (2019-2025)
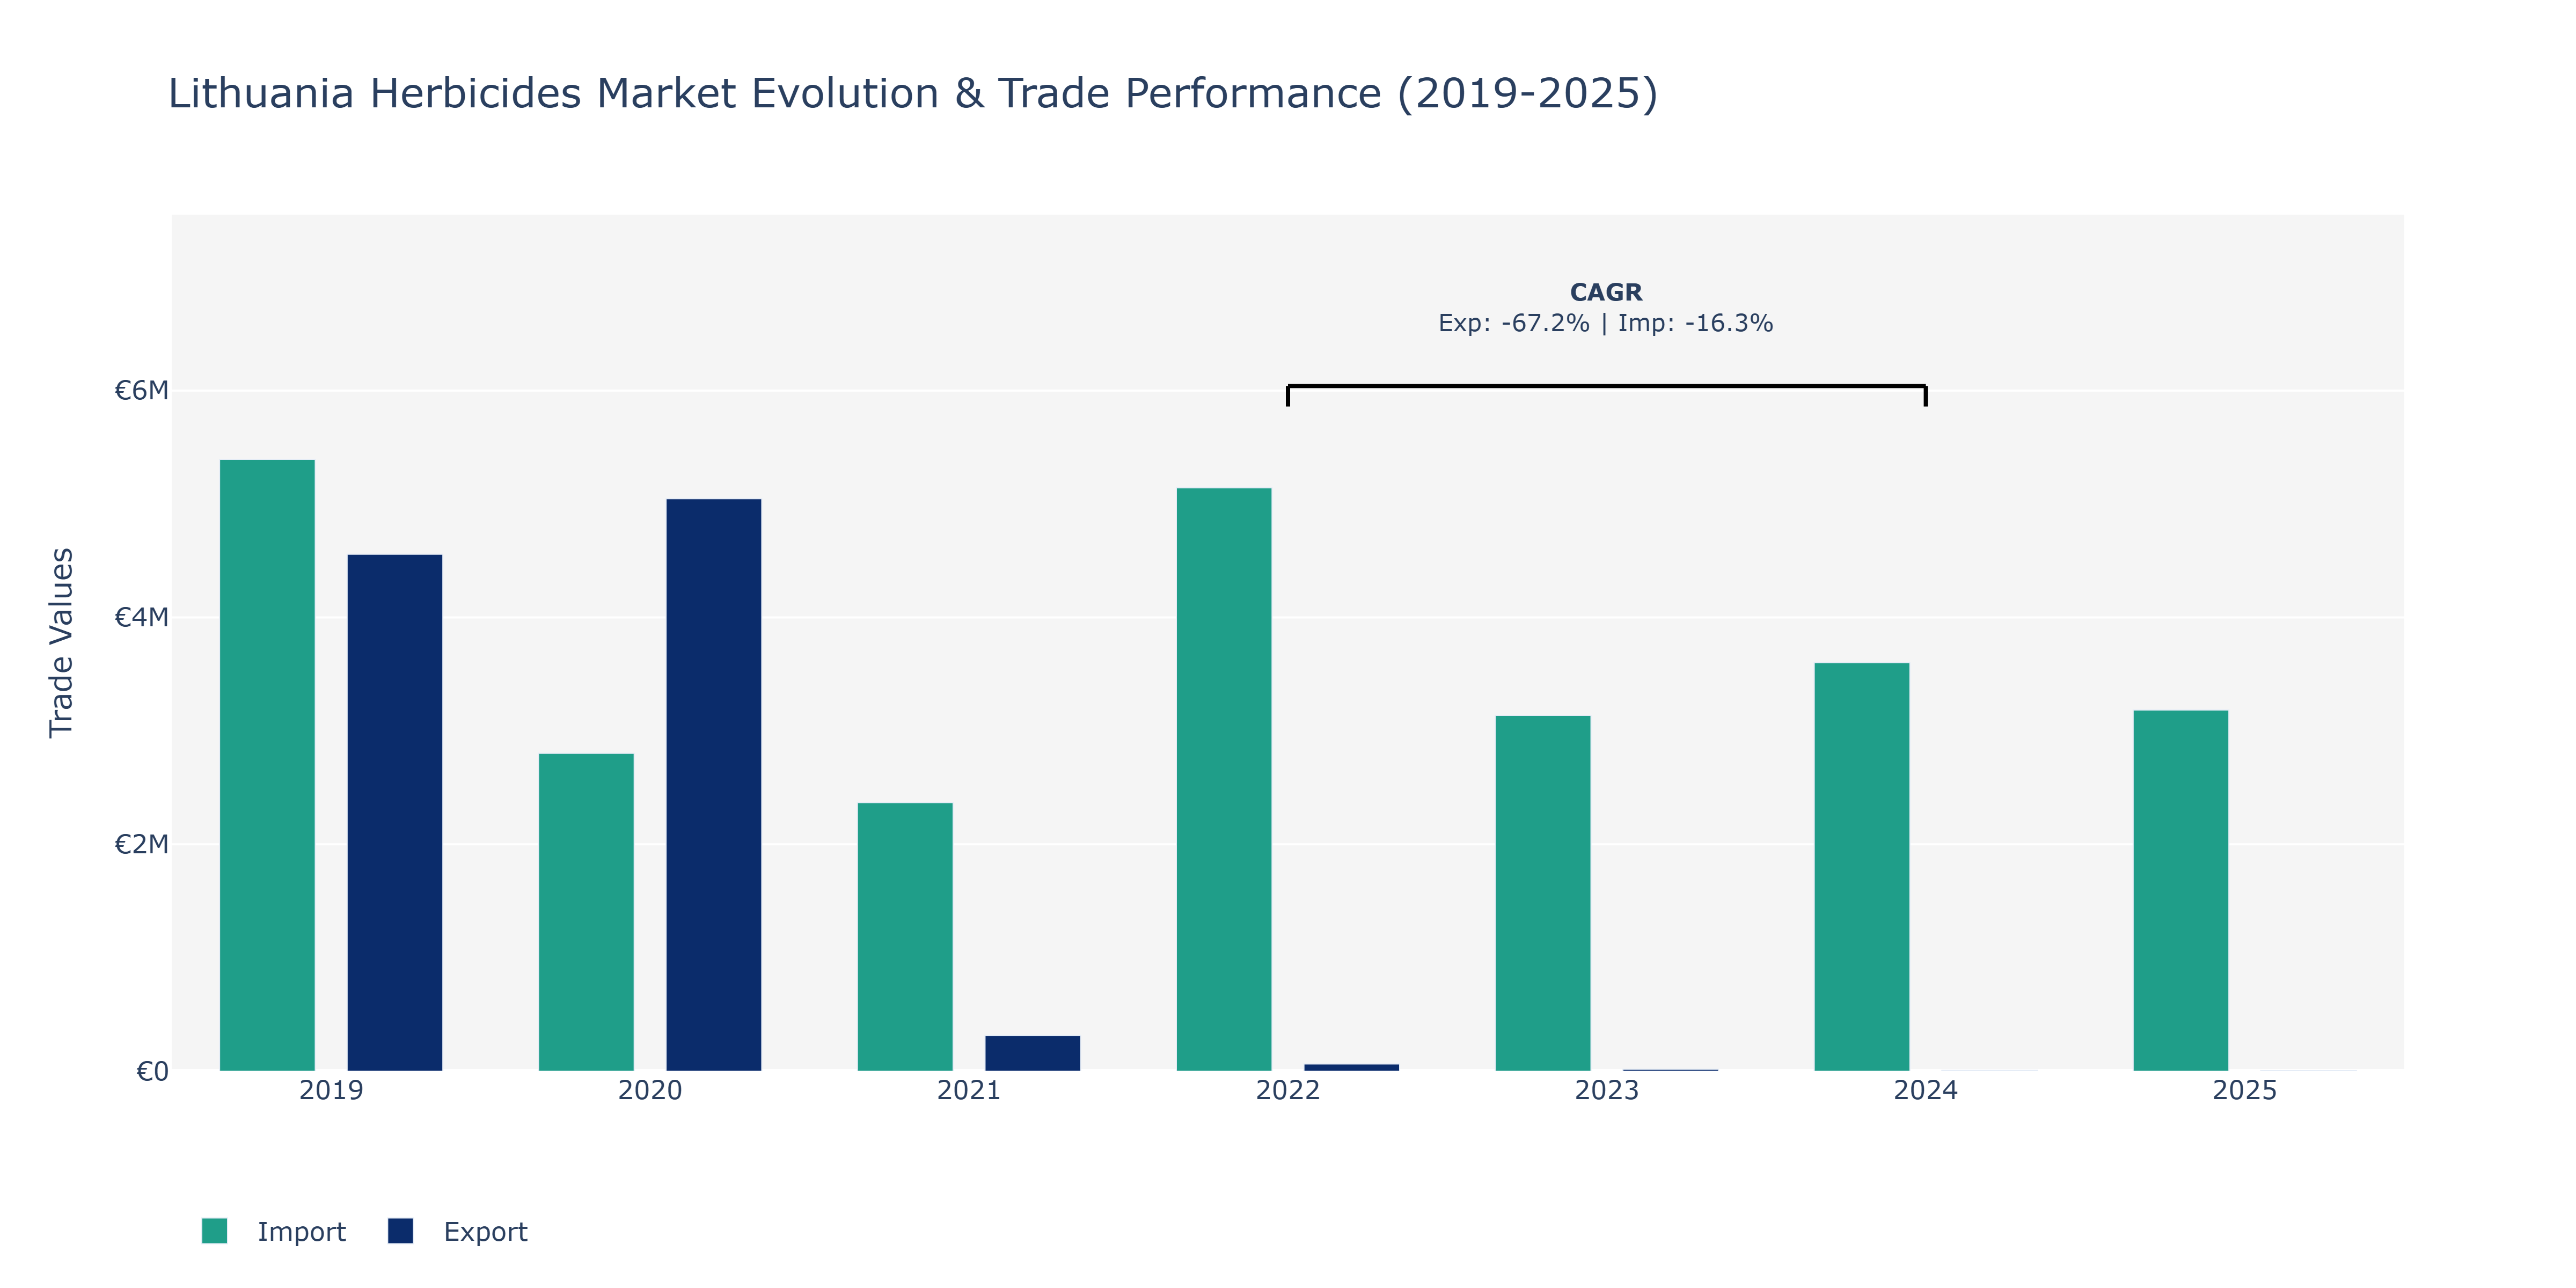
In the Lithuania Herbicides Market, exports and imports witnessed notable fluctuations over the years. Exports peaked at €5.05 million in 2020, showing a substantial increase from the previous year. However, a sharp decline followed in 2021, dropping to €315.2 thousand, attributing this significant decrease to potential shifts in demand or external market conditions. Imports, on the other hand, demonstrated a different pattern, with a peak in 2022 at €5.14 million. This surge could indicate a rise in domestic consumption or strategic sourcing decisions. The subsequent years saw a decline, possibly reflecting changes in trade policies or global market dynamics affecting imports of herbicides. The market's dynamics seem influenced by various factors like regulatory changes, environmental concerns, and shifts in agricultural practices, driving the fluctuations in exports and imports. Such trends emphasize the market's sensitivity to both local and global influences, highlighting the need for adaptive strategies by market players to navigate these dynamics effectively.
Key Highlights of the Report:
- Lithuania Herbicides Market Outlook
- Market Size of Lithuania Herbicides Market, 2025
- Forecast of Lithuania Herbicides Market, 2032
- Historical Data and Forecast of Lithuania Herbicides Revenues & Volume for the Period 2022 - 2032F
- Lithuania Herbicides Market Trend Evolution
- Lithuania Herbicides Market Drivers and Challenges
- Lithuania Herbicides Price Trends
- Lithuania Herbicides Porter`s Five Forces
- Lithuania Herbicides Industry Life Cycle
- Historical Data and Forecast of Lithuania Herbicides Market Revenues & Volume By Type for the Period 2022 - 2032F
- Historical Data and Forecast of Lithuania Herbicides Market Revenues & Volume By Glyphosate for the Period 2022 - 2032F
- Historical Data and Forecast of Lithuania Herbicides Market Revenues & Volume By 2, 4-D for the Period 2022 - 2032F
- Historical Data and Forecast of Lithuania Herbicides Market Revenues & Volume By Diquat for the Period 2022 - 2032F
- Historical Data and Forecast of Lithuania Herbicides Market Revenues & Volume By Others for the Period 2022 - 2032F
- Historical Data and Forecast of Lithuania Herbicides Market Revenues & Volume By Mode of Action for the Period 2022 - 2032F
- Historical Data and Forecast of Lithuania Herbicides Market Revenues & Volume By Non-Selective for the Period 2022 - 2032F
- Historical Data and Forecast of Lithuania Herbicides Market Revenues & Volume By Selective for the Period 2022 - 2032F
- Historical Data and Forecast of Lithuania Herbicides Market Revenues & Volume By Crop Type for the Period 2022 - 2032F
- Historical Data and Forecast of Lithuania Herbicides Market Revenues & Volume By Cereals & Grains for the Period 2022 - 2032F
- Historical Data and Forecast of Lithuania Herbicides Market Revenues & Volume By Oilseeds & Pulses for the Period 2022 - 2032F
- Historical Data and Forecast of Lithuania Herbicides Market Revenues & Volume By Fruits & Vegetables for the Period 2022 - 2032F
- Historical Data and Forecast of Lithuania Herbicides Market Revenues & Volume By Others for the Period 2022 - 2032F
- Lithuania Herbicides Import Export Trade Statistics
- Market Opportunity Assessment By Type
- Market Opportunity Assessment By Mode of Action
- Market Opportunity Assessment By Crop Type
- Lithuania Herbicides Top Companies Market Share
- Lithuania Herbicides Competitive Benchmarking By Technical and Operational Parameters
- Lithuania Herbicides Company Profiles
- Lithuania Herbicides Key Strategic Recommendations
Frequently Asked Questions About the Market Study (FAQs):
6Wresearch actively monitors the Lithuania Herbicides Market and publishes its comprehensive annual report, highlighting emerging trends, growth drivers, revenue analysis, and forecast outlook. Our insights help businesses to make data-backed strategic decisions with ongoing market dynamics. Our analysts track relevent industries related to the Lithuania Herbicides Market, allowing our clients with actionable intelligence and reliable forecasts tailored to emerging regional needs.
Yes, we provide customisation as per your requirements. To learn more, feel free to contact us on sales@6wresearch.com
1 Executive Summary |
2 Introduction |
2.1 Key Highlights of the Report |
2.2 Report Description |
2.3 Market Scope & Segmentation |
2.4 Research Methodology |
2.5 Assumptions |
3 Lithuania Herbicides? Market Overview |
3.1 Lithuania Country Macro Economic Indicators |
3.2 Lithuania Herbicides? Market Revenues & Volume, 2022 & 2032F |
3.3 Lithuania Herbicides? Market - Industry Life Cycle |
3.4 Lithuania Herbicides? Market - Porter's Five Forces |
3.5 Lithuania Herbicides? Market Revenues & Volume Share, By Type, 2022 & 2032F |
3.6 Lithuania Herbicides? Market Revenues & Volume Share, By Mode of Action, 2022 & 2032F |
3.7 Lithuania Herbicides? Market Revenues & Volume Share, By Crop Type, 2022 & 2032F |
4 Lithuania Herbicides? Market Dynamics |
4.1 Impact Analysis |
4.2 Market Drivers |
4.2.1 Increase in demand for high-quality crops and agricultural productivity |
4.2.2 Growing adoption of herbicides for weed control and crop protection |
4.2.3 Favorable government regulations supporting the use of herbicides in agriculture |
4.3 Market Restraints |
4.3.1 Environmental concerns and regulations regarding the use of herbicides |
4.3.2 Potential health hazards associated with the use of certain herbicides |
4.3.3 Competition from alternative pest control methods such as organic farming practices |
5 Lithuania Herbicides? Market Trends |
6 Lithuania Herbicides? Market Segmentations |
6.1 Lithuania Herbicides? Market, By Type |
6.1.1 Overview and Analysis |
6.1.2 Lithuania Herbicides? Market Revenues & Volume, By Glyphosate, 2022 - 2032F |
6.1.3 Lithuania Herbicides? Market Revenues & Volume, By 2, 4-D, 2022 - 2032F |
6.1.4 Lithuania Herbicides? Market Revenues & Volume, By Diquat, 2022 - 2032F |
6.1.5 Lithuania Herbicides? Market Revenues & Volume, By Others, 2022 - 2032F |
6.2 Lithuania Herbicides? Market, By Mode of Action |
6.2.1 Overview and Analysis |
6.2.2 Lithuania Herbicides? Market Revenues & Volume, By Non-Selective, 2022 - 2032F |
6.2.3 Lithuania Herbicides? Market Revenues & Volume, By Selective, 2022 - 2032F |
6.3 Lithuania Herbicides? Market, By Crop Type |
6.3.1 Overview and Analysis |
6.3.2 Lithuania Herbicides? Market Revenues & Volume, By Cereals & Grains, 2022 - 2032F |
6.3.3 Lithuania Herbicides? Market Revenues & Volume, By Oilseeds & Pulses, 2022 - 2032F | 6.3.4 Lithuania Herbicides? Market Revenues & Volume, By Fruits & Vegetables, 2022 - 2032F |
6.3.5 Lithuania Herbicides? Market Revenues & Volume, By Others, 2022 - 2032F |
7 Lithuania Herbicides? Market Import-Export Trade Statistics |
7.1 Lithuania Herbicides? Market Export to Major Countries |
7.2 Lithuania Herbicides? Market Imports from Major Countries |
8 Lithuania Herbicides? Market Key Performance Indicators |
8.1 Adoption rate of advanced herbicide technologies in Lithuania |
8.2 Percentage of agricultural land using herbicides for crop protection |
8.3 Investment in research and development for safer and more effective herbicides |
9 Lithuania Herbicides? Market - Opportunity Assessment |
9.1 Lithuania Herbicides? Market Opportunity Assessment, By Type, 2022 & 2032F |
9.2 Lithuania Herbicides? Market Opportunity Assessment, By Mode of Action, 2022 & 2032F |
9.3 Lithuania Herbicides? Market Opportunity Assessment, By Crop Type, 2022 & 2032F |
10 Lithuania Herbicides? Market - Competitive Landscape |
10.1 Lithuania Herbicides? Market Revenue Share, By Companies, 2025 |
10.2 Lithuania Herbicides? Market Competitive Benchmarking, By Operating and Technical Parameters |
11 Company Profiles |
12 Recommendations | 13 Disclaimer |
Global Go To Market Strategy - 2030
Export potential enables firms to identify high-growth global markets with greater confidence by combining advanced trade intelligence with a structured quantitative methodology. The framework analyzes emerging demand trends and country-level import patterns while integrating macroeconomic and trade datasets such as GDP and population forecasts, bilateral import–export flows, tariff structures, elasticity differentials between developed and developing economies, geographic distance, and import demand projections. Using weighted trade values from 2020–2024 as the base period to project country-to-country export potential for 2030, these inputs are operationalized through calculated drivers such as gravity model parameters, tariff impact factors, and projected GDP per-capita growth. Through an analysis of hidden potentials, demand hotspots, and market conditions that are most favorable to success, this method enables firms to focus on target countries, maximize returns, and global expansion with data, backed by accuracy.
By factoring in the projected importer demand gap that is currently unmet and could be potential opportunity, it identifies the potential for the Exporter (Country) among 190 countries, against the general trade analysis, which identifies the biggest importer or exporter.
To discover high-growth global markets and optimize your business strategy:
Click Here
Pricing
- Single User License$ 1,995
- Department License$ 2,400
- Site License$ 3,120
- Global License$ 3,795

Leadership Perspectives from Industry Events
Search
Thought Leadership and Analyst Meet


Our Clients
6WResearch In News
- India Export Attractiveness Tracker 2026
- India Air Conditioner Market Set for Strong Rebound in 2026 After Weather-Led Correction and GST-Driven Recovery: 6Wresearch
- ADAS in India: How Automatic Emergency Braking, Blind Spot Detection & Driver Monitoring are Transforming Road Safety
- Doha a strategic location for EV manufacturing hub: IPA Qatar
- Demand for luxury TVs surging in the GCC, says Samsung
- Empowering Growth: The Thriving Journey of Bangladesh’s Cable Industry
Latest Reports
- Nicaragua RPG Gaming Market (2026-2032)
- New Zealand RPG Gaming Market (2026-2032)
- Netherlands RPG Gaming Market (2026-2032)
- Nauru RPG Gaming Market (2026-2032)
- Namibia RPG Gaming Market (2026-2032)
- Mozambique RPG Gaming Market (2026-2032)
- Montenegro RPG Gaming Market (2026-2032)
- Mongolia RPG Gaming Market (2026-2032)
- Monaco RPG Gaming Market (2026-2032)
- Micronesia RPG Gaming Market (2026-2032)
Industry Events and Analyst Meet

EV India Expo 2026

HIMTEX 2026

India Refining Summit 2026

India EV Show 2026

EV tech India Expo 2026
Whitepaper
- Middle East & Africa Commercial Security Market Click here to view more.
- Middle East & Africa Fire Safety Systems & Equipment Market Click here to view more.
- GCC Drone Market Click here to view more.
- Middle East Lighting Fixture Market Click here to view more.
- GCC Physical & Perimeter Security Market Click here to view more.