Lithuania Maleic Anhydride Market (2025-2031) | Analysis, Companies, Revenue, Growth, Segmentation, Outlook, Trends, Size, Forecast, Industry, Value & Share
Market Forecast By Raw Material (N-Butane, Benzene), By Application (Unsaturated Polyester Resin, Copolymers, Lubricant Additives, Alkenyl Succinic Anhydrides, Malic Acid, Fumaric Acid, Others), By End-users (Construction, Automotive, Food & Beverages, Textile, Pharmaceuticals, Personal Care, Agriculture, Others) And Competitive Landscape
| Product Code: ETC4693363 | Publication Date: Nov 2023 | Updated Date: Apr 2026 | Product Type: Market Research Report | |
| Publisher: 6Wresearch | Author: Shubham Padhi | No. of Pages: 60 | No. of Figures: 30 | No. of Tables: 5 |
Lithuania Maleic Anhydride Market Size (2020-2030)
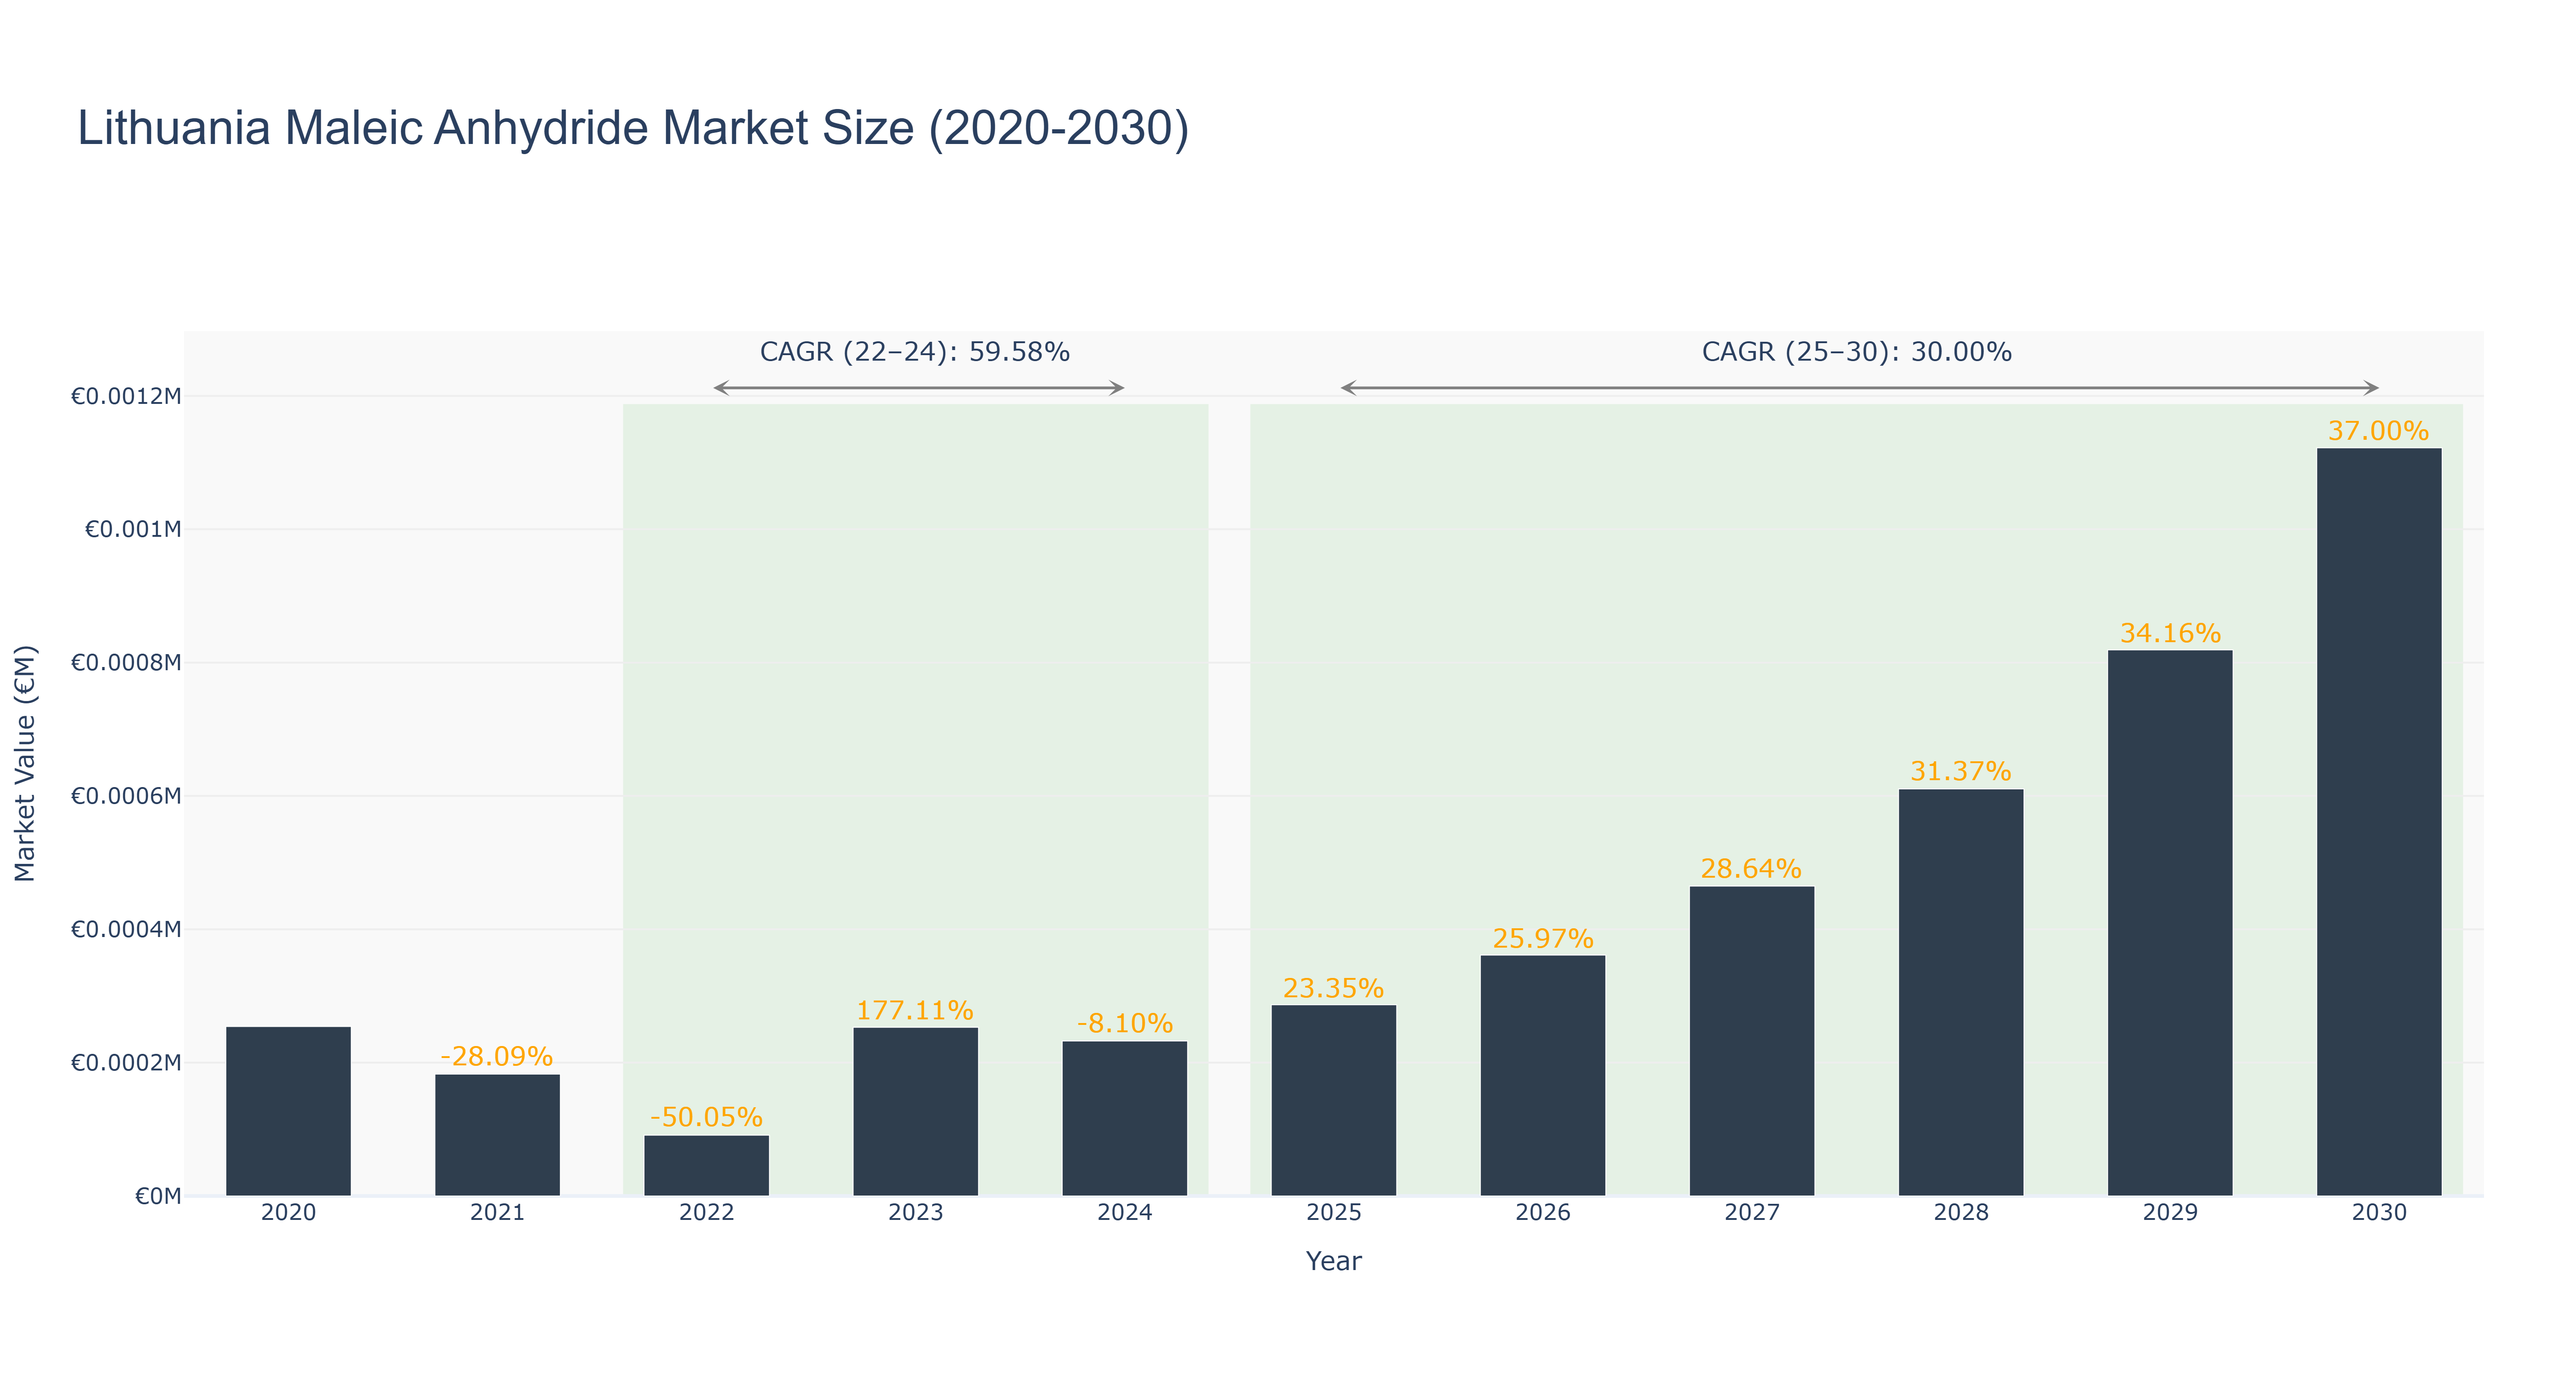
The Lithuania Maleic Anhydride Market has exhibited a volatile trajectory in recent years, characterized by significant fluctuations. The market peaked in 2020 at €254.20 million, followed by a steep decline to €91.30 million in 2022, reflecting a compounded annual growth rate (CAGR) of -50.05% during this period. However, a remarkable recovery is evidenced in 2023, with the market rebounding to €253.00 million, leading to a CAGR of 59.58% from 2022 to 2024. Looking ahead, the forecasted period from 2025 to 2030 anticipates a more stable growth trajectory, with projected market sizes increasing from €286.80 million in 2025 to €1.12 billion by 2030, corresponding to a CAGR of 30.00%. This growth is driven by rising demand in the automotive and construction sectors, alongside advancements in production technologies. Continued investments in infrastructure and sustainable practices are expected to further bolster the market's expansion.
Lithuania Maleic Anhydride Market: Production & Trade Performance (2019-2025)
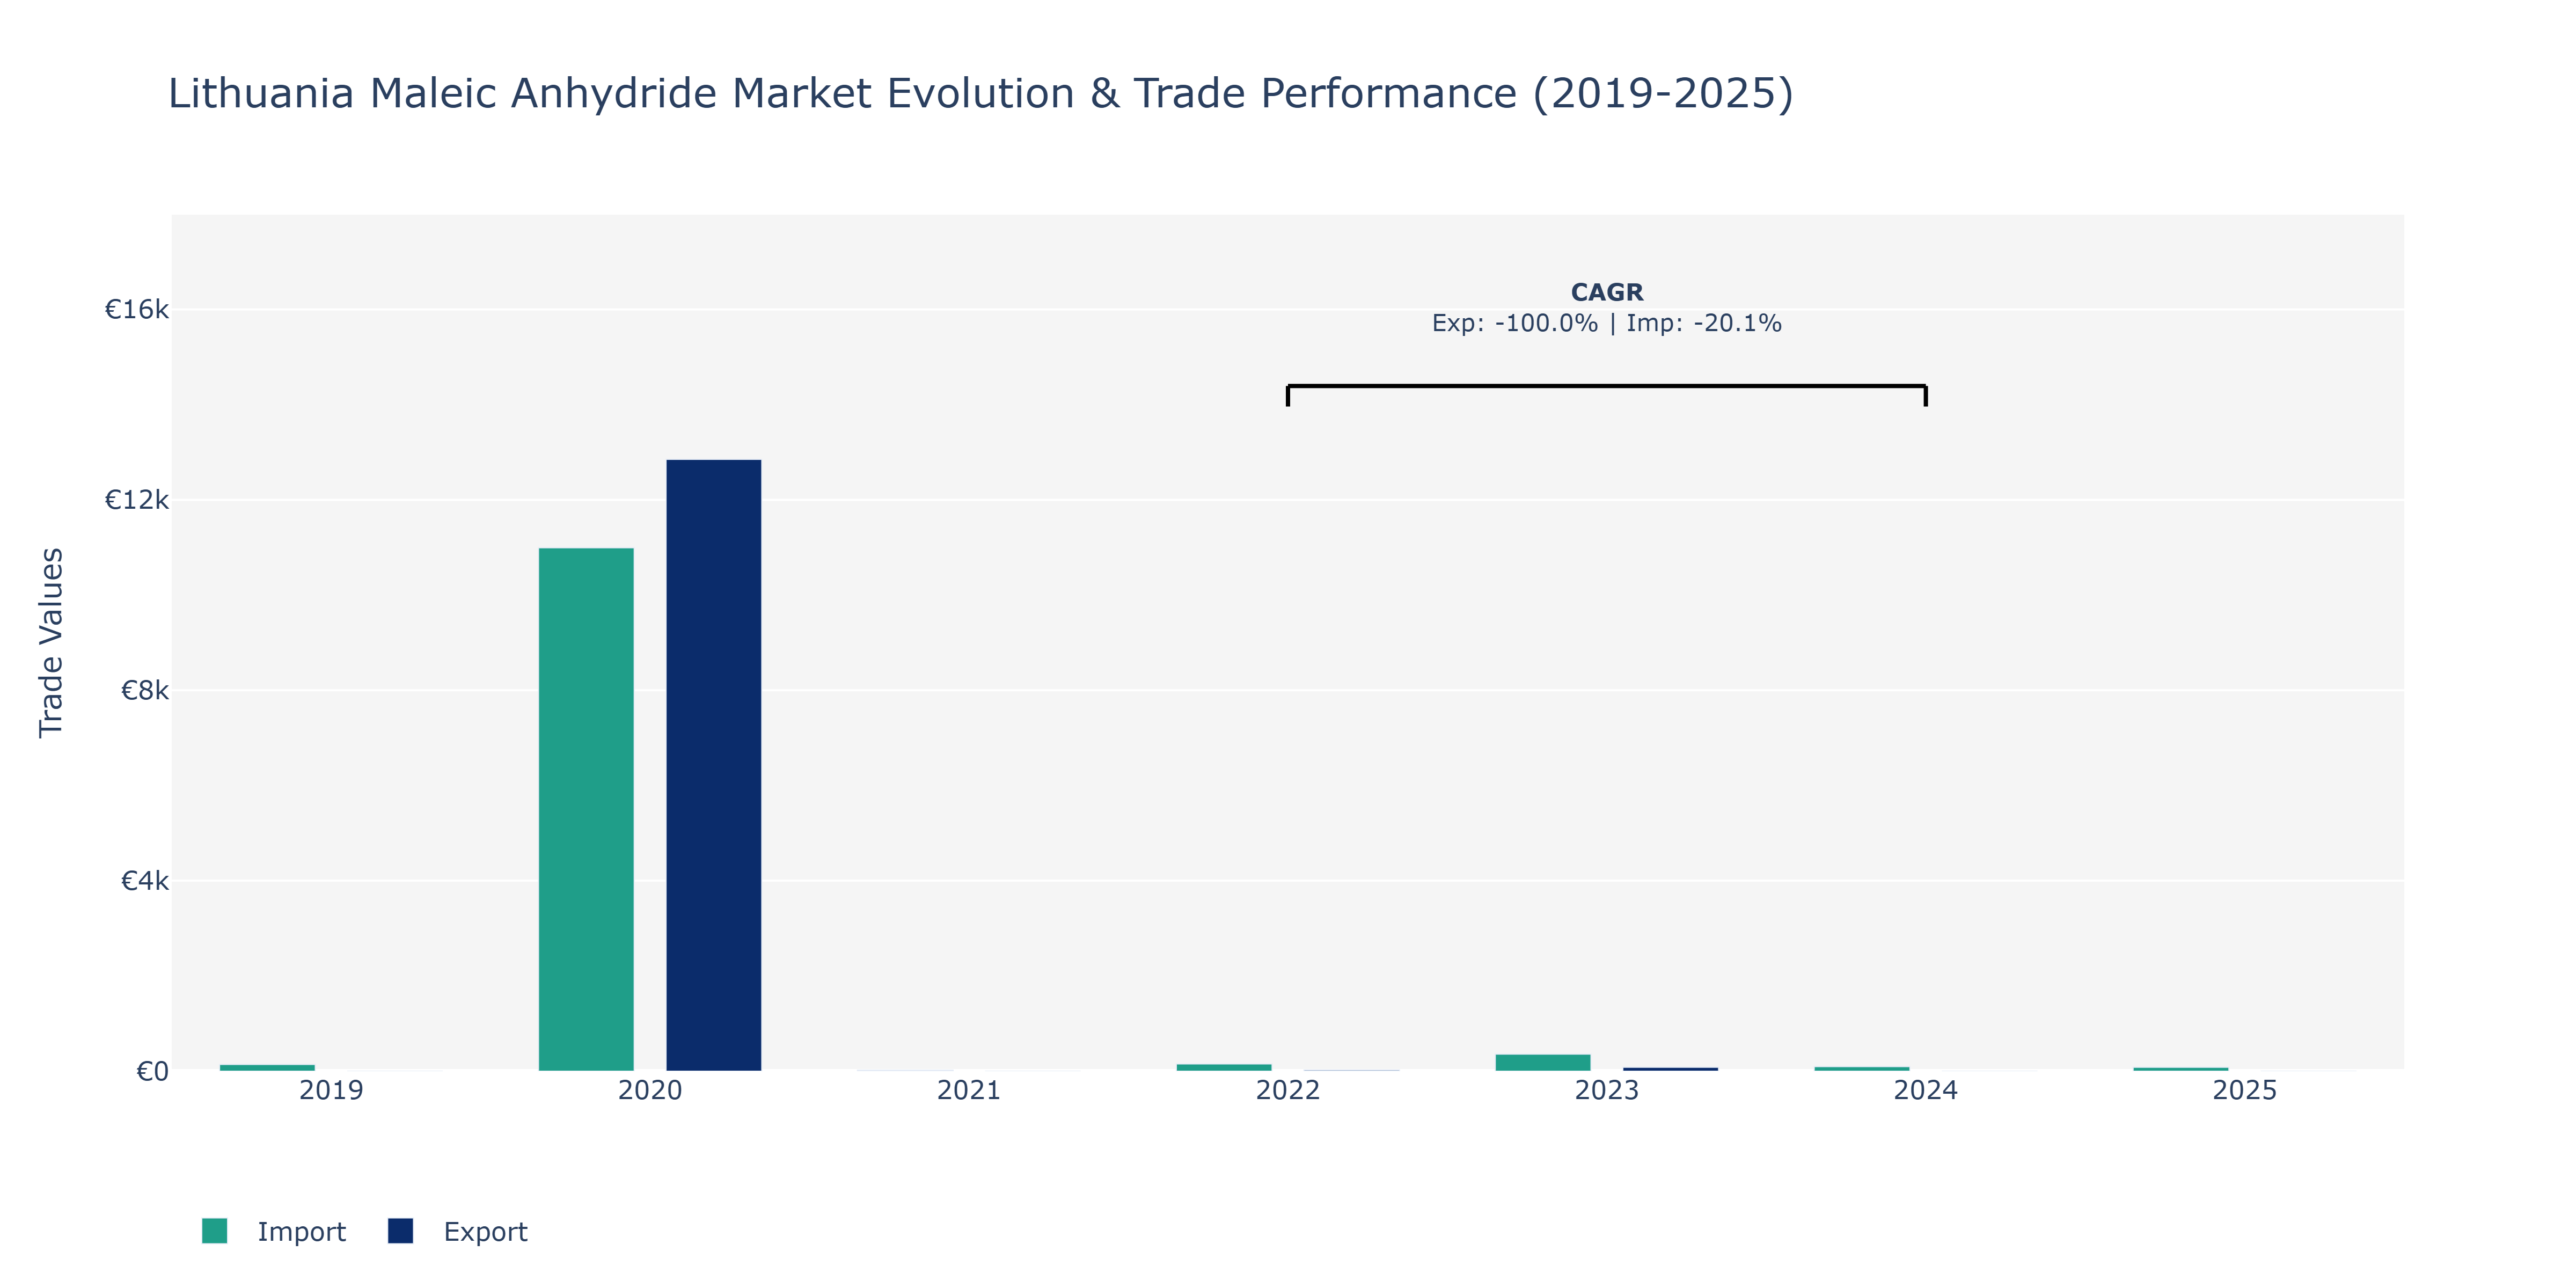
The Lithuania Maleic Anhydride Market witnessed a notable disparity between Exports and Imports during the review period. In 2019, Imports stood at €140 million, marking the starting point of recorded data. The subsequent years saw substantial variations in trade activities. Exports surged to €12.85 billion in 2020, surpassing the Import value that year, which were €10.992 billion. This peak in Exports could be attributed to increased global demand or strategic market penetration initiatives. However, in 2021, Imports sharply dropped to €21 million, possibly due to shifting supply chain dynamics or domestic production capacity enhancements. The market then experienced a mild recovery in 2022 with Exports at €25 million and Imports at €152 million. Notably, Imports soared to €358 million in 2023, potentially indicating an uptick in manufacturing activities or raw material requirements within the sector. The trend reversed in 2024 as Imports declined to €97 million. By 2025, Imports slightly decreased further to approximately €82.67 million. This fluctuation could be influenced by evolving trade regulations or market saturation effects. The CAGR for Imports recorded a decline of -20.12% between 2022 and 2024, highlighting a contraction in demand or evolving sourcing strategies within the industry. The dynamic shifts in trade flows underscore the market's sensitivity to both internal and external factors, necessitating strategic adaptability to thrive in the Lithuania Maleic Anhydride Market.
Key Highlights of the Report:
- Lithuania Maleic Anhydride Market Outlook
- Market Size of Lithuania Maleic Anhydride Market, 2024
- Forecast of Lithuania Maleic Anhydride Market, 2031
- Historical Data and Forecast of Lithuania Maleic Anhydride Revenues & Volume for the Period 2021-2031
- Lithuania Maleic Anhydride Market Trend Evolution
- Lithuania Maleic Anhydride Market Drivers and Challenges
- Lithuania Maleic Anhydride Price Trends
- Lithuania Maleic Anhydride Porter`s Five Forces
- Lithuania Maleic Anhydride Industry Life Cycle
- Historical Data and Forecast of Lithuania Maleic Anhydride Market Revenues & Volume By Raw Material for the Period 2021-2031
- Historical Data and Forecast of Lithuania Maleic Anhydride Market Revenues & Volume By N-Butane for the Period 2021-2031
- Historical Data and Forecast of Lithuania Maleic Anhydride Market Revenues & Volume By Benzene for the Period 2021-2031
- Historical Data and Forecast of Lithuania Maleic Anhydride Market Revenues & Volume By Application for the Period 2021-2031
- Historical Data and Forecast of Lithuania Maleic Anhydride Market Revenues & Volume By Unsaturated Polyester Resin for the Period 2021-2031
- Historical Data and Forecast of Lithuania Maleic Anhydride Market Revenues & Volume By Copolymers for the Period 2021-2031
- Historical Data and Forecast of Lithuania Maleic Anhydride Market Revenues & Volume By Lubricant Additives for the Period 2021-2031
- Historical Data and Forecast of Lithuania Maleic Anhydride Market Revenues & Volume By Alkenyl Succinic Anhydrides for the Period 2021-2031
- Historical Data and Forecast of Lithuania Maleic Anhydride Market Revenues & Volume By Malic Acid for the Period 2021-2031
- Historical Data and Forecast of Lithuania Maleic Anhydride Market Revenues & Volume By Fumaric Acid for the Period 2021-2031
- Historical Data and Forecast of Lithuania Maleic Anhydride Market Revenues & Volume By Others for the Period 2021-2031
- Historical Data and Forecast of Lithuania Maleic Anhydride Market Revenues & Volume By End-users for the Period 2021-2031
- Historical Data and Forecast of Lithuania Maleic Anhydride Market Revenues & Volume By Construction for the Period 2021-2031
- Historical Data and Forecast of Lithuania Maleic Anhydride Market Revenues & Volume By Automotive for the Period 2021-2031
- Historical Data and Forecast of Lithuania Maleic Anhydride Market Revenues & Volume By Food & Beverages for the Period 2021-2031
- Historical Data and Forecast of Lithuania Maleic Anhydride Market Revenues & Volume By Textile for the Period 2021-2031
- Historical Data and Forecast of Lithuania Maleic Anhydride Market Revenues & Volume By Pharmaceuticals for the Period 2021-2031
- Historical Data and Forecast of Lithuania Maleic Anhydride Market Revenues & Volume By Personal Care for the Period 2021-2031
- Historical Data and Forecast of Lithuania Maleic Anhydride Market Revenues & Volume By Agriculture for the Period 2021-2031
- Historical Data and Forecast of Lithuania Maleic Anhydride Market Revenues & Volume By Others for the Period 2021-2031
- Lithuania Maleic Anhydride Import Export Trade Statistics
- Market Opportunity Assessment By Raw Material
- Market Opportunity Assessment By Application
- Market Opportunity Assessment By End-users
- Lithuania Maleic Anhydride Top Companies Market Share
- Lithuania Maleic Anhydride Competitive Benchmarking By Technical and Operational Parameters
- Lithuania Maleic Anhydride Company Profiles
- Lithuania Maleic Anhydride Key Strategic Recommendations
Frequently Asked Questions About the Market Study (FAQs):
6Wresearch actively monitors the Lithuania Maleic Anhydride Market and publishes its comprehensive annual report, highlighting emerging trends, growth drivers, revenue analysis, and forecast outlook. Our insights help businesses to make data-backed strategic decisions with ongoing market dynamics. Our analysts track relevent industries related to the Lithuania Maleic Anhydride Market, allowing our clients with actionable intelligence and reliable forecasts tailored to emerging regional needs.
Yes, we provide customisation as per your requirements. To learn more, feel free to contact us on sales@6wresearch.com
1 Executive Summary |
2 Introduction |
2.1 Key Highlights of the Report |
2.2 Report Description |
2.3 Market Scope & Segmentation |
2.4 Research Methodology |
2.5 Assumptions |
3 Lithuania Maleic Anhydride Market Overview |
3.1 Lithuania Country Macro Economic Indicators |
3.2 Lithuania Maleic Anhydride Market Revenues & Volume, 2021 & 2031F |
3.3 Lithuania Maleic Anhydride Market - Industry Life Cycle |
3.4 Lithuania Maleic Anhydride Market - Porter's Five Forces |
3.5 Lithuania Maleic Anhydride Market Revenues & Volume Share, By Raw Material, 2021 & 2031F |
3.6 Lithuania Maleic Anhydride Market Revenues & Volume Share, By Application, 2021 & 2031F |
3.7 Lithuania Maleic Anhydride Market Revenues & Volume Share, By End-users, 2021 & 2031F |
4 Lithuania Maleic Anhydride Market Dynamics |
4.1 Impact Analysis |
4.2 Market Drivers |
4.3 Market Restraints |
5 Lithuania Maleic Anhydride Market Trends |
6 Lithuania Maleic Anhydride Market Segmentations |
6.1 Lithuania Maleic Anhydride Market, By Raw Material |
6.1.1 Overview and Analysis |
6.1.2 Lithuania Maleic Anhydride Market Revenues & Volume, By N-Butane, 2021-2031F |
6.1.3 Lithuania Maleic Anhydride Market Revenues & Volume, By Benzene, 2021-2031F |
6.2 Lithuania Maleic Anhydride Market, By Application |
6.2.1 Overview and Analysis |
6.2.2 Lithuania Maleic Anhydride Market Revenues & Volume, By Unsaturated Polyester Resin, 2021-2031F |
6.2.3 Lithuania Maleic Anhydride Market Revenues & Volume, By Copolymers, 2021-2031F |
6.2.4 Lithuania Maleic Anhydride Market Revenues & Volume, By Lubricant Additives, 2021-2031F |
6.2.5 Lithuania Maleic Anhydride Market Revenues & Volume, By Alkenyl Succinic Anhydrides, 2021-2031F |
6.2.6 Lithuania Maleic Anhydride Market Revenues & Volume, By Malic Acid, 2021-2031F |
6.2.7 Lithuania Maleic Anhydride Market Revenues & Volume, By Fumaric Acid, 2021-2031F |
6.3 Lithuania Maleic Anhydride Market, By End-users |
6.3.1 Overview and Analysis |
6.3.2 Lithuania Maleic Anhydride Market Revenues & Volume, By Construction, 2021-2031F |
6.3.3 Lithuania Maleic Anhydride Market Revenues & Volume, By Automotive, 2021-2031F |
6.3.4 Lithuania Maleic Anhydride Market Revenues & Volume, By Food & Beverages, 2021-2031F |
6.3.5 Lithuania Maleic Anhydride Market Revenues & Volume, By Textile, 2021-2031F |
6.3.6 Lithuania Maleic Anhydride Market Revenues & Volume, By Pharmaceuticals, 2021-2031F |
6.3.7 Lithuania Maleic Anhydride Market Revenues & Volume, By Personal Care, 2021-2031F |
6.3.8 Lithuania Maleic Anhydride Market Revenues & Volume, By Others, 2021-2031F |
6.3.9 Lithuania Maleic Anhydride Market Revenues & Volume, By Others, 2021-2031F |
7 Lithuania Maleic Anhydride Market Import-Export Trade Statistics |
7.1 Lithuania Maleic Anhydride Market Export to Major Countries |
7.2 Lithuania Maleic Anhydride Market Imports from Major Countries |
8 Lithuania Maleic Anhydride Market Key Performance Indicators |
9 Lithuania Maleic Anhydride Market - Opportunity Assessment |
9.1 Lithuania Maleic Anhydride Market Opportunity Assessment, By Raw Material, 2021 & 2031F |
9.2 Lithuania Maleic Anhydride Market Opportunity Assessment, By Application, 2021 & 2031F |
9.3 Lithuania Maleic Anhydride Market Opportunity Assessment, By End-users, 2021 & 2031F |
10 Lithuania Maleic Anhydride Market - Competitive Landscape |
10.1 Lithuania Maleic Anhydride Market Revenue Share, By Companies, 2024 |
10.2 Lithuania Maleic Anhydride Market Competitive Benchmarking, By Operating and Technical Parameters |
11 Company Profiles |
12 Recommendations | 13 Disclaimer |
Global Go To Market Strategy - 2030
Export potential enables firms to identify high-growth global markets with greater confidence by combining advanced trade intelligence with a structured quantitative methodology. The framework analyzes emerging demand trends and country-level import patterns while integrating macroeconomic and trade datasets such as GDP and population forecasts, bilateral import–export flows, tariff structures, elasticity differentials between developed and developing economies, geographic distance, and import demand projections. Using weighted trade values from 2020–2024 as the base period to project country-to-country export potential for 2030, these inputs are operationalized through calculated drivers such as gravity model parameters, tariff impact factors, and projected GDP per-capita growth. Through an analysis of hidden potentials, demand hotspots, and market conditions that are most favorable to success, this method enables firms to focus on target countries, maximize returns, and global expansion with data, backed by accuracy.
By factoring in the projected importer demand gap that is currently unmet and could be potential opportunity, it identifies the potential for the Exporter (Country) among 190 countries, against the general trade analysis, which identifies the biggest importer or exporter.
To discover high-growth global markets and optimize your business strategy:
Click Here
Pricing
- Single User License$ 1,995
- Department License$ 2,400
- Site License$ 3,120
- Global License$ 3,795

Leadership Perspectives from Industry Events
Search
Thought Leadership and Analyst Meet


Our Clients
6WResearch In News
- India Export Attractiveness Tracker 2026
- India Air Conditioner Market Set for Strong Rebound in 2026 After Weather-Led Correction and GST-Driven Recovery: 6Wresearch
- ADAS in India: How Automatic Emergency Braking, Blind Spot Detection & Driver Monitoring are Transforming Road Safety
- Doha a strategic location for EV manufacturing hub: IPA Qatar
- Demand for luxury TVs surging in the GCC, says Samsung
- Empowering Growth: The Thriving Journey of Bangladesh’s Cable Industry
Latest Reports
- Nicaragua RPG Gaming Market (2026-2032)
- New Zealand RPG Gaming Market (2026-2032)
- Netherlands RPG Gaming Market (2026-2032)
- Nauru RPG Gaming Market (2026-2032)
- Namibia RPG Gaming Market (2026-2032)
- Mozambique RPG Gaming Market (2026-2032)
- Montenegro RPG Gaming Market (2026-2032)
- Mongolia RPG Gaming Market (2026-2032)
- Monaco RPG Gaming Market (2026-2032)
- Micronesia RPG Gaming Market (2026-2032)
Industry Events and Analyst Meet

EV India Expo 2026

HIMTEX 2026

India Refining Summit 2026

India EV Show 2026

EV tech India Expo 2026
Whitepaper
- Middle East & Africa Commercial Security Market Click here to view more.
- Middle East & Africa Fire Safety Systems & Equipment Market Click here to view more.
- GCC Drone Market Click here to view more.
- Middle East Lighting Fixture Market Click here to view more.
- GCC Physical & Perimeter Security Market Click here to view more.