Lithuania Photo Album Market (2026-2032) | Segmentation, Growth, Forecast, Outlook, Value, Revenue, Companies, Size, Trends, Share, Industry & Analysis
Market Forecast By Product Type (Matted, Flush Mount, Gift), By Size (4‚
| Product Code: ETC5301971 | Publication Date: Nov 2023 | Updated Date: Apr 2026 | Product Type: Market Research Report | |
| Publisher: 6Wresearch | Author: Ravi Bhandari | No. of Pages: 60 | No. of Figures: 30 | No. of Tables: 5 |
Lithuania Photo Album Market Size (2020-2030)
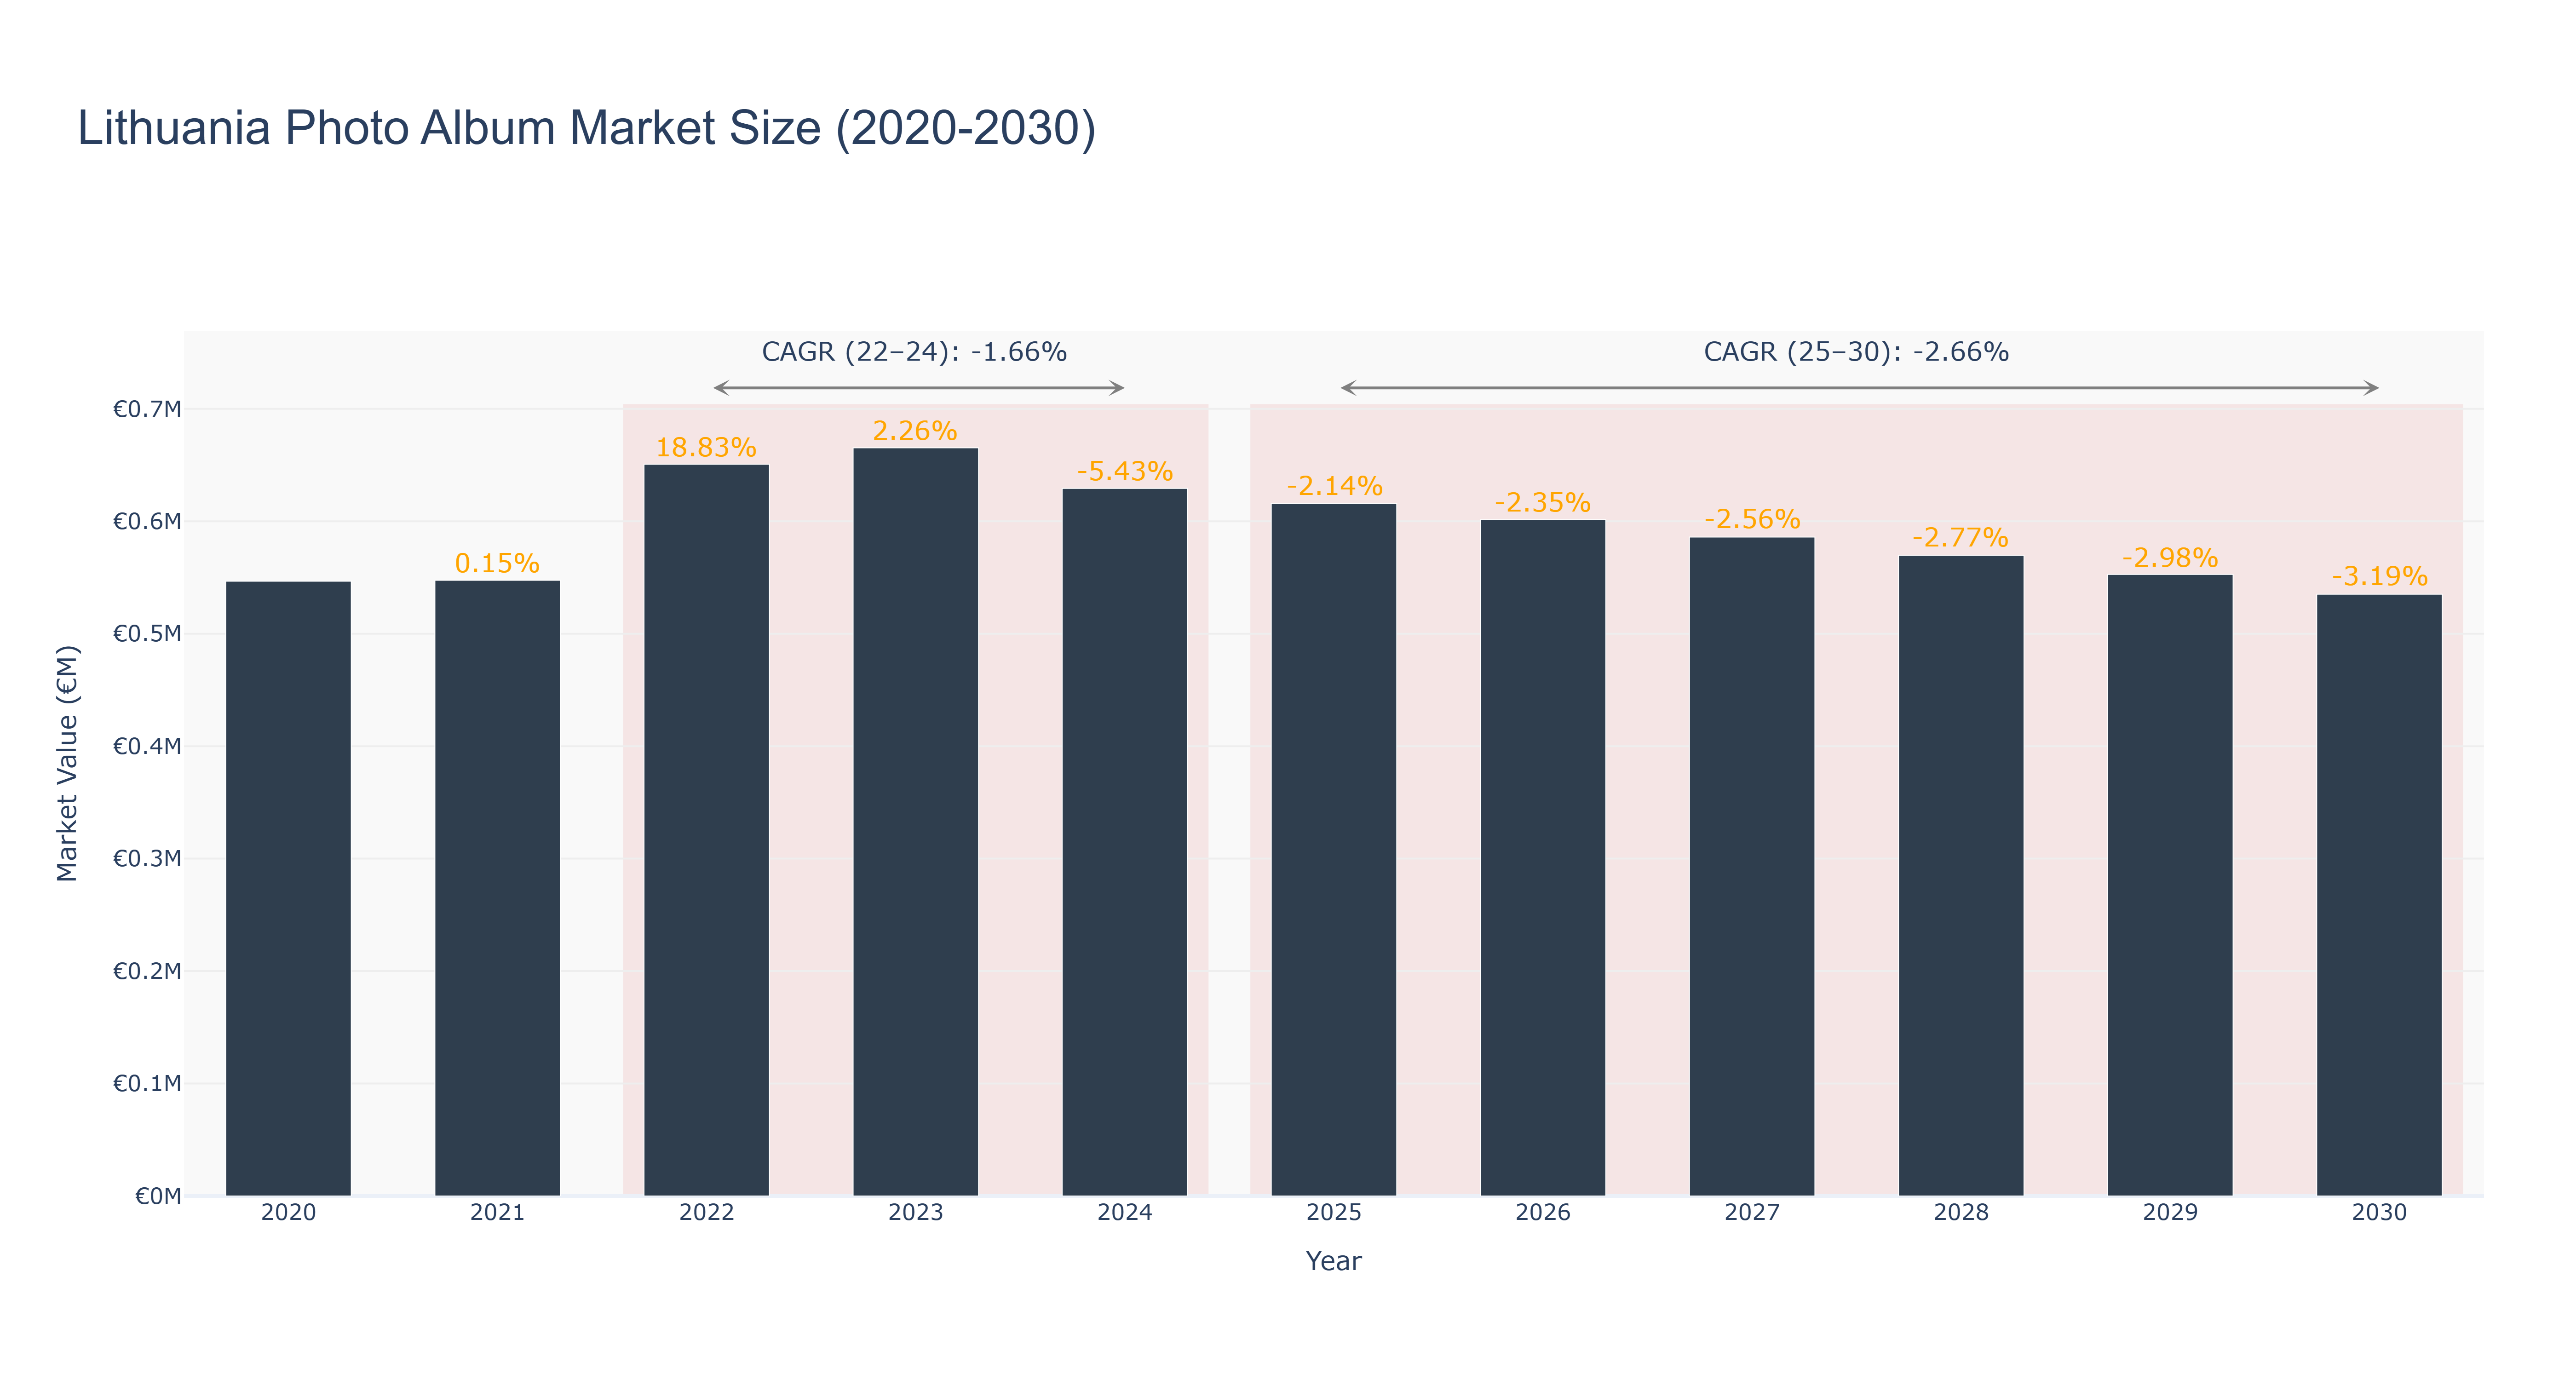
The Lithuania Photo Album Market experienced significant fluctuations from 2020 to 2024. The market reached its peak in 2022, with a size of €650.67 thousand, reflecting a robust growth rate of 18.83% from the previous year. However, this growth was followed by a modest increase of 2.26% in 2023, before a decline to €629.21 thousand in 2024, marking a downturn of -5.43%. The actual CAGR for the period 2022-2024 stands at -1.66%, indicating a challenging environment. Looking ahead, the forecasted period from 2025 to 2030 suggests a continued decline, with projected market sizes decreasing from €615.78 thousand in 2025 to €535.16 thousand by 2030, reflecting a CAGR of -2.66%. This anticipated downturn may be driven by the increasing digitalization of photo storage and sharing, which diminishes demand for physical albums. As consumer preferences evolve, the market will need to adapt to these shifts to remain relevant.
Lithuania Photo Album Market: Production & Trade Performance (2019-2025)
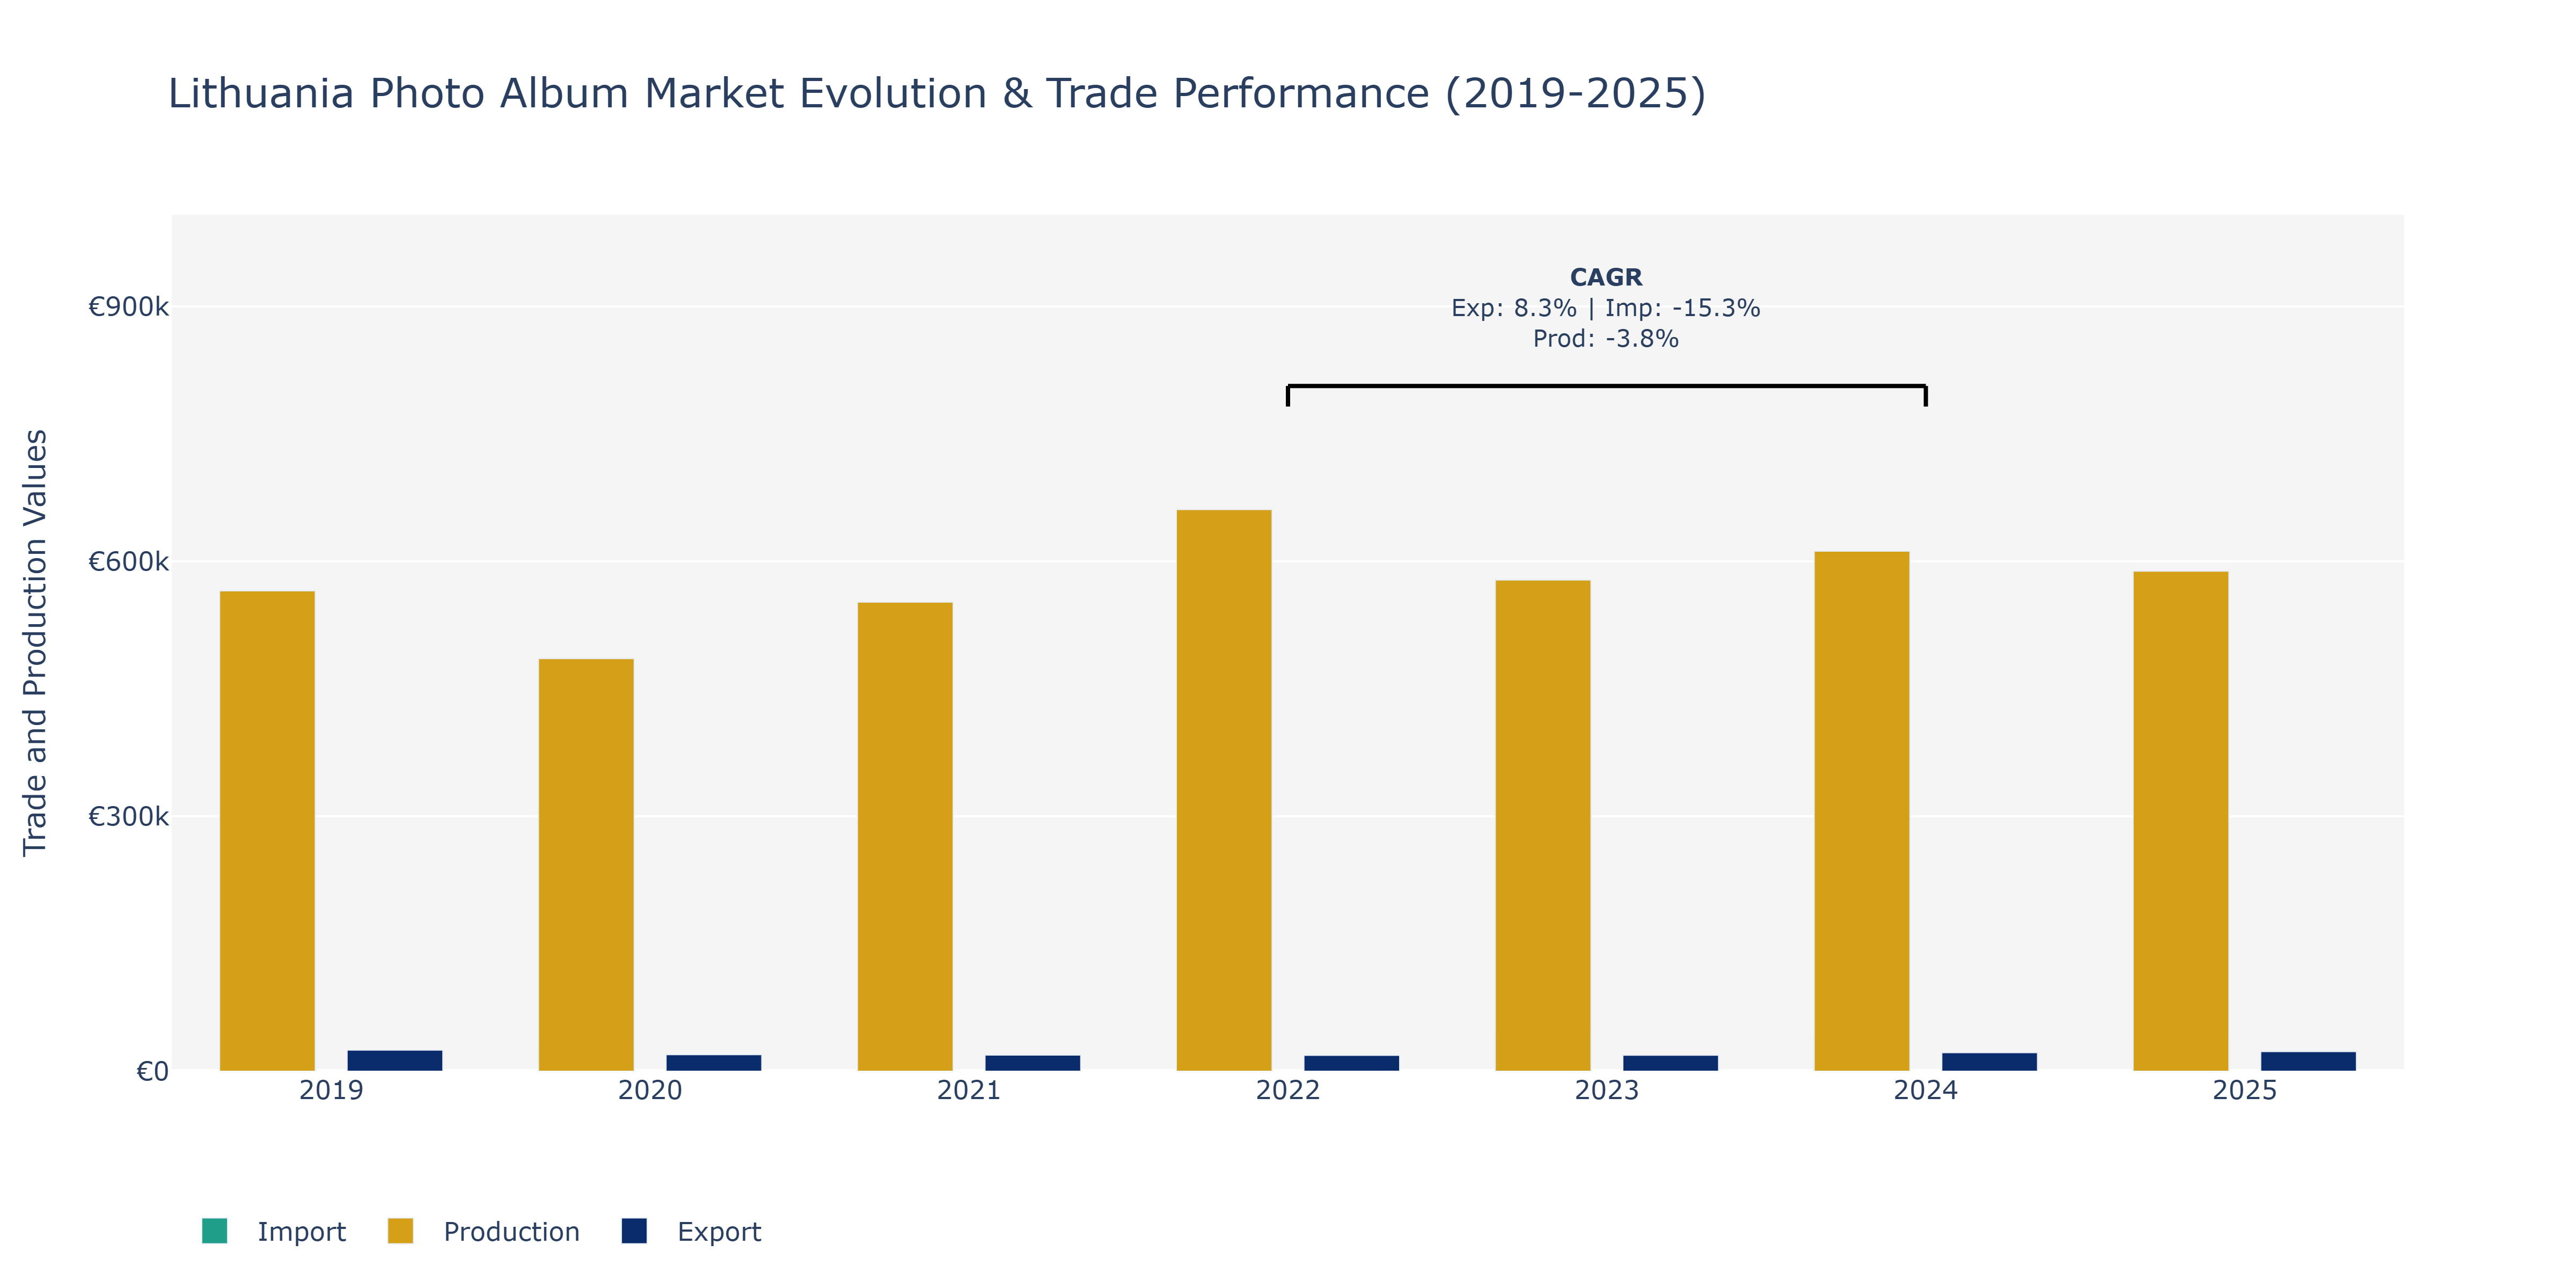
In the Lithuania Photo Album Market, a noticeable fluctuation can be observed in Exports, Imports, and Production over the years. From 2019 to 2025, Exports showed a slight increase, reaching €23.08 thousand in 2025 after a peak in 2024 at €21.81 thousand. Imports experienced a downward trend, decreasing to €36.66 thousand in 2025 from €59.01 thousand in 2022. Production demonstrated fluctuations, with a peak in 2022 at €661.00 thousand and a decline to €588.49 thousand in 2025. The decline in Imports could be attributed to changes in global trade dynamics or shifts in consumer preferences. Production fluctuations may be influenced by market demand and supply chain disruptions. Therefore, stakeholders in the Lithuania Photo Album Market should closely monitor these trends to make informed business decisions and adapt strategies accordingly.
Key Highlights of the Report:
- Lithuania Photo Album Market Outlook
- Market Size of Lithuania Photo Album Market, 2025
- Forecast of Lithuania Photo Album Market, 2032
- Historical Data and Forecast of Lithuania Photo Album Revenues & Volume for the Period 2022 - 2032F
- Lithuania Photo Album Market Trend Evolution
- Lithuania Photo Album Market Drivers and Challenges
- Lithuania Photo Album Price Trends
- Lithuania Photo Album Porter`s Five Forces
- Lithuania Photo Album Industry Life Cycle
- Historical Data and Forecast of Lithuania Photo Album Market Revenues & Volume By Product Type for the Period 2022 - 2032F
- Historical Data and Forecast of Lithuania Photo Album Market Revenues & Volume By Matted for the Period 2022 - 2032F
- Historical Data and Forecast of Lithuania Photo Album Market Revenues & Volume By Flush Mount for the Period 2022 - 2032F
- Historical Data and Forecast of Lithuania Photo Album Market Revenues & Volume By Gift for the Period 2022 - 2032F
- Historical Data and Forecast of Lithuania Photo Album Market Revenues & Volume By Size for the Period 2022 - 2032F
- Historical Data and Forecast of Lithuania Photo Album Market Revenues & Volume By 4?
- Historical Data and Forecast of Lithuania Photo Album Market Revenues & Volume By 5?
- Historical Data and Forecast of Lithuania Photo Album Market Revenues & Volume By 8?
- Historical Data and Forecast of Lithuania Photo Album Market Revenues & Volume By End-User for the Period 2022 - 2032F
- Historical Data and Forecast of Lithuania Photo Album Market Revenues & Volume By Personal for the Period 2022 - 2032F
- Historical Data and Forecast of Lithuania Photo Album Market Revenues & Volume By Professional for the Period 2022 - 2032F
- Lithuania Photo Album Import Export Trade Statistics
- Market Opportunity Assessment By Product Type
- Market Opportunity Assessment By Size
- Market Opportunity Assessment By End-User
- Lithuania Photo Album Top Companies Market Share
- Lithuania Photo Album Competitive Benchmarking By Technical and Operational Parameters
- Lithuania Photo Album Company Profiles
- Lithuania Photo Album Key Strategic Recommendations
Frequently Asked Questions About the Market Study (FAQs):
6Wresearch actively monitors the Lithuania Photo Album Market and publishes its comprehensive annual report, highlighting emerging trends, growth drivers, revenue analysis, and forecast outlook. Our insights help businesses to make data-backed strategic decisions with ongoing market dynamics. Our analysts track relevent industries related to the Lithuania Photo Album Market, allowing our clients with actionable intelligence and reliable forecasts tailored to emerging regional needs.
Yes, we provide customisation as per your requirements. To learn more, feel free to contact us on sales@6wresearch.com
1 Executive Summary |
2 Introduction |
2.1 Key Highlights of the Report |
2.2 Report Description |
2.3 Market Scope & Segmentation |
2.4 Research Methodology |
2.5 Assumptions |
3 Lithuania Photo Album Market Overview |
3.1 Lithuania Country Macro Economic Indicators |
3.2 Lithuania Photo Album Market Revenues & Volume, 2022 & 2032F |
3.3 Lithuania Photo Album Market - Industry Life Cycle |
3.4 Lithuania Photo Album Market - Porter's Five Forces |
3.5 Lithuania Photo Album Market Revenues & Volume Share, By Product Type, 2022 & 2032F |
3.6 Lithuania Photo Album Market Revenues & Volume Share, By Size, 2022 & 2032F |
3.7 Lithuania Photo Album Market Revenues & Volume Share, By End-User, 2022 & 2032F |
4 Lithuania Photo Album Market Dynamics |
4.1 Impact Analysis |
4.2 Market Drivers |
4.2.1 Increasing trend of personalized and customized photo albums |
4.2.2 Growing demand for high-quality printed photo products |
4.2.3 Rising popularity of preserving memories and nostalgia through physical photo albums |
4.3 Market Restraints |
4.3.1 Competition from digital photo sharing platforms and online photo storage solutions |
4.3.2 Price sensitivity among consumers in the face of economic fluctuations |
5 Lithuania Photo Album Market Trends |
6 Lithuania Photo Album Market Segmentations |
6.1 Lithuania Photo Album Market, By Product Type |
6.1.1 Overview and Analysis |
6.1.2 Lithuania Photo Album Market Revenues & Volume, By Matted, 2022 - 2032F |
6.1.3 Lithuania Photo Album Market Revenues & Volume, By Flush Mount, 2022 - 2032F |
6.1.4 Lithuania Photo Album Market Revenues & Volume, By Gift, 2022 - 2032F |
6.2 Lithuania Photo Album Market, By Size |
6.2.1 Overview and Analysis |
6.2.2 Lithuania Photo Album Market Revenues & Volume, By 4? |
6.2.3 Lithuania Photo Album Market Revenues & Volume, By 5? |
6.2.4 Lithuania Photo Album Market Revenues & Volume, By 8? |
6.3 Lithuania Photo Album Market, By End-User |
6.3.1 Overview and Analysis |
6.3.2 Lithuania Photo Album Market Revenues & Volume, By Personal, 2022 - 2032F |
6.3.3 Lithuania Photo Album Market Revenues & Volume, By Professional, 2022 - 2032F |
7 Lithuania Photo Album Market Import-Export Trade Statistics |
7.1 Lithuania Photo Album Market Export to Major Countries |
7.2 Lithuania Photo Album Market Imports from Major Countries |
8 Lithuania Photo Album Market Key Performance Indicators |
8.1 Customer engagement on social media platforms promoting photo albums |
8.2 Number of new product launches and innovations in the photo album market |
8.3 Growth in the number of photography enthusiasts and hobbyists in Lithuania |
8.4 Percentage of repeat customers purchasing photo albums |
9 Lithuania Photo Album Market - Opportunity Assessment |
9.1 Lithuania Photo Album Market Opportunity Assessment, By Product Type, 2022 & 2032F |
9.2 Lithuania Photo Album Market Opportunity Assessment, By Size, 2022 & 2032F |
9.3 Lithuania Photo Album Market Opportunity Assessment, By End-User, 2022 & 2032F |
10 Lithuania Photo Album Market - Competitive Landscape |
10.1 Lithuania Photo Album Market Revenue Share, By Companies, 2025 |
10.2 Lithuania Photo Album Market Competitive Benchmarking, By Operating and Technical Parameters |
11 Company Profiles |
12 Recommendations | 13 Disclaimer |
Global Go To Market Strategy - 2030
Export potential enables firms to identify high-growth global markets with greater confidence by combining advanced trade intelligence with a structured quantitative methodology. The framework analyzes emerging demand trends and country-level import patterns while integrating macroeconomic and trade datasets such as GDP and population forecasts, bilateral import–export flows, tariff structures, elasticity differentials between developed and developing economies, geographic distance, and import demand projections. Using weighted trade values from 2020–2024 as the base period to project country-to-country export potential for 2030, these inputs are operationalized through calculated drivers such as gravity model parameters, tariff impact factors, and projected GDP per-capita growth. Through an analysis of hidden potentials, demand hotspots, and market conditions that are most favorable to success, this method enables firms to focus on target countries, maximize returns, and global expansion with data, backed by accuracy.
By factoring in the projected importer demand gap that is currently unmet and could be potential opportunity, it identifies the potential for the Exporter (Country) among 190 countries, against the general trade analysis, which identifies the biggest importer or exporter.
To discover high-growth global markets and optimize your business strategy:
Click Here
Pricing
- Single User License$ 1,995
- Department License$ 2,400
- Site License$ 3,120
- Global License$ 3,795

Leadership Perspectives from Industry Events
Search
Thought Leadership and Analyst Meet


Our Clients
6WResearch In News
- India Export Attractiveness Tracker 2026
- India Air Conditioner Market Set for Strong Rebound in 2026 After Weather-Led Correction and GST-Driven Recovery: 6Wresearch
- ADAS in India: How Automatic Emergency Braking, Blind Spot Detection & Driver Monitoring are Transforming Road Safety
- Doha a strategic location for EV manufacturing hub: IPA Qatar
- Demand for luxury TVs surging in the GCC, says Samsung
- Empowering Growth: The Thriving Journey of Bangladesh’s Cable Industry
Latest Reports
- Nicaragua RPG Gaming Market (2026-2032)
- New Zealand RPG Gaming Market (2026-2032)
- Netherlands RPG Gaming Market (2026-2032)
- Nauru RPG Gaming Market (2026-2032)
- Namibia RPG Gaming Market (2026-2032)
- Mozambique RPG Gaming Market (2026-2032)
- Montenegro RPG Gaming Market (2026-2032)
- Mongolia RPG Gaming Market (2026-2032)
- Monaco RPG Gaming Market (2026-2032)
- Micronesia RPG Gaming Market (2026-2032)
Industry Events and Analyst Meet

EV India Expo 2026

HIMTEX 2026

India Refining Summit 2026

India EV Show 2026

EV tech India Expo 2026
Whitepaper
- Middle East & Africa Commercial Security Market Click here to view more.
- Middle East & Africa Fire Safety Systems & Equipment Market Click here to view more.
- GCC Drone Market Click here to view more.
- Middle East Lighting Fixture Market Click here to view more.
- GCC Physical & Perimeter Security Market Click here to view more.